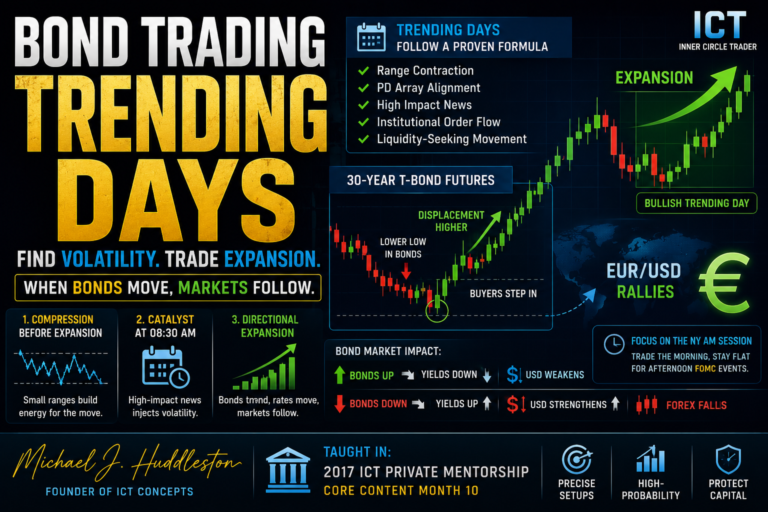
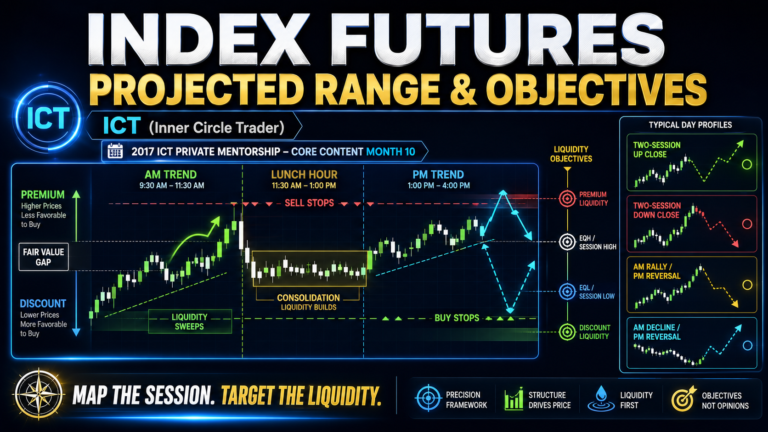
The Commitment of Traders, commonly called the COT report, is a weekly market-positioning report that helps traders study the activities of different groups participating in the futures market. Michael J. Huddleston, the founder of ICT (Inner Circle Trader) concepts, teaches a distinctive way of interpreting this information by focusing on commercial hedging activity, institutional order flow and ICT Premium and Discount Arrays.
This concept is taught in the 2017 ICT Private Mentorship Core Content Month 10.
Instead of simply checking whether commercial traders are net long or net short, the ICT approach examines how their positions change within six-month and twelve-month ranges. This allows a trader to identify the shorter-term hedging programs taking place inside a larger commercial buying or selling program.
As Michael J. Huddleston explains:
“You have to look deeper and go behind the numbers and see what it is they’ve been doing.”
The Commitment of Traders report should not be treated as a standalone entry signal. Its greatest value appears when it is combined with institutional order flow, market structure and ICT PD Arrays.
What Is the Commitment of Traders Report?
The Commitment of Traders report is released weekly by the United States Commodity Futures Trading Commission, or CFTC.
The report shows the futures positions held by several major categories of market participants. Depending on the report format, these groups may include:
- Commercial traders
- Large speculators
- Small speculators
- Non-commercial traders
- Non-reportable traders
For ICT analysis, the main focus is generally placed on the commercial traders.
Commercial traders are usually large institutions, banks, producers, manufacturers, processors or users of a particular commodity. They participate in the futures market primarily to manage price risk rather than to speculate in the same way as retail traders.
Currency futures can also be studied through the Commitment of Traders report. Currencies are treated as commodities within the futures market because they are bought and sold for international trade, lending, investing and financial transactions.
Which COT Report Does ICT Use?
When studying currencies or commodities, ICT focuses on the futures-only report in the short format.
The options positions are not required for this particular method. The objective is to study the commercial futures positions and determine whether commercial traders are operating within a larger buying or selling program.
For currency analysis, a trader can locate the corresponding futures contract on the relevant exchange.
Examples include:
- Japanese yen futures
- British pound futures
- Euro futures
- Swiss franc futures
- Canadian dollar futures
- Australian dollar futures
- US Dollar Index futures
The futures contract is used to study commercial activity, while the corresponding forex pair can be used for execution and technical analysis.
Understanding Commercial Long and Short Positions
The Commitment of Traders report lists the number of long and short contracts held by commercial traders.
The commercial net position can be calculated as:
Commercial long contracts minus commercial short contracts
When the result is positive, commercial traders are net long.
When the result is negative, commercial traders are net short.
For example, suppose commercial traders hold:
- 143,450 long contracts
- 76,426 short contracts
The net commercial position would be:
143,450 − 76,426 = 67,024 contracts net long
However, this number alone does not provide enough information to determine where price will move next.
A net-long commercial position does not automatically mean the trader should buy. Similarly, a net-short commercial position does not automatically mean the trader should sell.
The commercial position must be studied in relation to its previous readings, price action and institutional order flow.
The Main Problem With Traditional COT Analysis
Many traders interpret the Commitment of Traders report in a very basic way:
- Commercials net long means bullish
- Commercials net short means bearish
- Large speculators buying means bullish
- Large speculators selling means bearish
This interpretation is incomplete.
Commercial traders are hedgers. Their objective is often to protect future costs, lock in favourable prices or reduce exposure to price fluctuations.
A manufacturer that expects raw material prices to rise may buy futures contracts to lock in a lower price. A producer may sell futures contracts to protect against a future decline.
Because commercial traders continuously hedge, they can buy during a larger selling program and sell during a larger buying program.
This is why the COT report may appear to contradict price.
Commercials may remain net short while price continues rising. They may also remain net long while price experiences a significant decline.
The apparent contradiction becomes clearer when the trader separates the long-term commercial program from the shorter-term hedging program.
Commercial Buying and Selling Programs
ICT divides commercial activity into two broad conditions.
Commercial Buy Program
A commercial buy program exists when the commercial net-position line remains above the zero line.
This means commercial traders are net long on an overall basis.
However, the market can still experience bearish price movements because commercials may conduct short-term selling or hedging within the larger buy program.
Commercial Sell Program
A commercial sell program exists when the commercial net-position line remains below the zero line.
This means commercial traders are net short on an overall basis.
However, bullish moves can still develop because commercials may conduct short-term buying or hedging inside the larger sell program.
The zero line therefore identifies the larger commercial program, but it does not reveal every shorter-term action occurring within that program.
As Huddleston states:
“A larger long-term sell program can still have bullish hedging buy programs in it.”
This distinction is one of the most important parts of the ICT Commitment of Traders method.
The Net Traders Position Line Chart
Instead of reading only the raw weekly figures, traders can plot the COT data as a net-position line chart underneath a daily price chart.
The three commonly displayed lines represent:
- Commercial traders
- Large speculators
- Small speculators
On some charting platforms, the commercial position may be displayed as a red line, large speculators as a green line and small speculators as a blue line.
For this method, the commercial line is the primary focus.
The large-speculator line is often positioned opposite the commercial line because the two groups frequently take opposing positions.
The small-speculator line represents less-informed market participants and is generally not required for the analysis.
A trader should display at least one year of price and COT data. This provides enough information to identify:
- The zero-line position
- The six-month commercial range
- The twelve-month commercial range
- Important commercial extremes
- Changes in commercial hedging behaviour
Why the Zero Line Is Not Enough
The zero line helps identify whether commercials are operating in a broad buy program or sell program.
However, it should not be used as an isolated directional signal.
Suppose commercial traders remain below the zero line for several months. A traditional interpretation would consider the market bearish throughout that entire period.
But price may still rise strongly during the same period.
This can happen because commercials are increasing their net-long exposure relative to their recent range, even though their total position remains below zero.
The commercial traders are still technically net short, but their activity within the recent range may show aggressive short covering or buying.
Therefore, the trader must ask two separate questions:
- Are commercials above or below the zero line?
- Where is the current commercial position within its recent range?
The first question identifies the long-term program.
The second question identifies the shorter-term hedging activity.
The Six-Month Commercial Range
The six-month commercial range is created by identifying the highest and lowest commercial net-position readings during the previous six months.
The trader marks:
- The highest commercial net-position reading
- The lowest commercial net-position reading
- The midpoint of that range
This creates an adjusted range for evaluating current commercial activity.
A commercial position moving towards the upper portion of the range suggests commercials are becoming relatively more bullish.
A commercial position moving towards the lower portion suggests commercials are becoming relatively more bearish.
This interpretation applies even when the entire range is above or below the traditional zero line.
For example, commercials may remain below zero but move aggressively from the lower portion of their six-month range towards the upper portion. This can reveal a bullish hedging program inside a larger commercial sell program.
Likewise, commercials may remain above zero but move sharply from the upper part of their range towards the lower part. This can reveal a bearish hedging program inside a larger commercial buy program.
The Twelve-Month Commercial Range
The twelve-month range is calculated in the same way as the six-month range, but it uses one full year of commercial net-position data.
The trader identifies:
- The highest commercial reading during the previous twelve months
- The lowest commercial reading during the previous twelve months
- The midpoint of the twelve-month range
The twelve-month range provides broader context, while the six-month range helps identify more recent changes.
When both ranges show commercials moving in the same direction, the signal becomes more meaningful.
For example, a bullish commercial condition becomes stronger when:
- Commercials are moving towards the upper end of the six-month range
- Commercials are also moving towards the upper end of the twelve-month range
- Institutional order flow is bullish
- Price is reacting from a Discount PD Array
A bearish condition becomes stronger when:
- Commercials are moving towards the lower end of the six-month range
- Commercials are also moving towards the lower end of the twelve-month range
- Institutional order flow is bearish
- Price is reacting from a Premium PD Array
Commercial Hedging Nodules
When the commercial net-position line is studied within its recent range, small directional changes can become visible.
ICT refers to these changes as hedging activity or hedging nodules.
A bullish nodule appears when commercial positioning begins rising relative to its recent range.
A bearish nodule appears when commercial positioning begins falling relative to its recent range.
These changes may occur even when commercials remain on the same side of the zero line.
For example:
- A bullish nodule can form below zero
- A bearish nodule can form above zero
The nodule does not automatically produce a trade. It identifies a period in which commercial hedging behaviour is changing.
The trader must then compare this activity with price.
Important questions include:
- Is price respecting bullish order blocks?
- Is price respecting bearish order blocks?
- Are short-term highs being broken?
- Are short-term lows being broken?
- Is price reacting from a Premium or Discount Array?
- Is institutional order flow bullish or bearish?
When commercial positioning and price behaviour agree, the directional analysis becomes stronger.
Commitment of Traders and Institutional Order Flow
Institutional order flow helps the trader determine whether price is currently being delivered higher or lower.
COT data should confirm or strengthen that conclusion rather than replace it.
Bullish Institutional Order Flow
Institutional order flow may be considered bullish when:
- Bullish order blocks support price
- Short-term lows are swept and rejected
- Price trades through bearish PD Arrays
- Old highs are being targeted
- Discount Arrays produce upward reactions
- Down-close candles act as support
During bullish institutional order flow, the trader looks for commercial positioning to rise within the six-month or twelve-month range.
The best bullish conditions occur when commercials are also above zero, but bullish hedging activity can still develop below zero.
Bearish Institutional Order Flow
Institutional order flow may be considered bearish when:
- Bearish order blocks resist price
- Short-term highs are swept and rejected
- Price trades through bullish PD Arrays
- Old lows are being targeted
- Premium Arrays produce downward reactions
- Up-close candles act as resistance
During bearish institutional order flow, the trader looks for commercial positioning to fall within the six-month or twelve-month range.
The best bearish conditions occur when commercials are also below zero, but bearish hedging activity can still develop above zero.
Commitment of Traders and PD Arrays
The ICT PD Array Matrix provides the price levels needed to convert COT information into a practical market framework.
COT data identifies how commercial positioning is changing.
Institutional order flow identifies whether price delivery is bullish or bearish.
PD Arrays identify where the trader should expect price to react.
Bullish COT Confluence
A bullish Commitment of Traders setup may include:
- Commercial positioning rising within its six-month range
- Commercial positioning rising within its twelve-month range
- Bullish institutional order flow
- Price trading in discount
- A bullish order block
- A bullish fair value gap
- Sell-side liquidity being taken
- A previous low acting as a stop raid
- Premium liquidity available above price
The commercial data provides directional confidence, while the Discount PD Array provides the location.
Bearish COT Confluence
A bearish Commitment of Traders setup may include:
- Commercial positioning falling within its six-month range
- Commercial positioning falling within its twelve-month range
- Bearish institutional order flow
- Price trading in premium
- A bearish order block
- A bearish fair value gap
- Buy-side liquidity being taken
- A previous high acting as a stop raid
- Discount liquidity available below price
The commercial data supports the bearish expectation, while the Premium PD Array provides the location.
The Best Commitment of Traders Conditions
The highest-quality conditions occur when three elements agree:
- The broad commercial program
- The shorter-term commercial hedging program
- Institutional order flow and PD Arrays
A high-quality bullish condition may appear when:
- Commercials are above the zero line
- Commercial positioning is rising within its six-month and twelve-month ranges
- Institutional order flow is bullish
- Price is reacting from a Discount PD Array
A high-quality bearish condition may appear when:
- Commercials are below the zero line
- Commercial positioning is falling within its six-month and twelve-month ranges
- Institutional order flow is bearish
- Price is reacting from a Premium PD Array
Huddleston explains the principle clearly:
“The best conditions are seen when both net sum basis agree with institutional order flow and PD Array Matrix confluences.”
These conditions do not guarantee that every trade will succeed. They simply provide stronger alignment between commercial activity and price delivery.
Trading Against the Broad Commercial Program
Both sides of the market can still be traded even when commercial positioning is clearly above or below zero.
Suppose commercials are above zero and operating within a long-term buy program. The trader may still find short-term bearish trades if:
- Commercial positioning declines within its recent range
- Institutional order flow becomes bearish
- Price reaches a Premium PD Array
- Buy-side liquidity is taken
- A bearish market structure shift develops
Similarly, commercials may be below zero while a valid long opportunity develops if:
- Commercial positioning rises within its recent range
- Institutional order flow becomes bullish
- Price reaches a Discount PD Array
- Sell-side liquidity is taken
- A bullish market structure shift develops
However, counter-program trades may have less long-term support than trades aligned with the broad commercial position.
They may therefore be more suitable for shorter-term objectives rather than long-term directional positions.
Long-Term Commercial Extremes
Commercial positioning becomes especially important when it reaches a major historical extreme.
ICT considers several lookback periods:
- Six-month extremes
- Twelve-month extremes
- Two-year extremes
- Three-year extremes
- Four-year extremes
A multi-year extreme can suggest that a major repricing or long-term reversal may be developing.
When commercial positions reach a one-year, two-year or four-year extreme, the trader should give greater importance to the long-term condition.
Short-term hedging movements may become less important when compared with an unusually large historical commercial position.
For example, if commercials reach their most net-long position in four years, it may indicate that the market is approaching a significant long-term low.
If commercials reach their most net-short position in four years, it may indicate that the market is approaching a significant long-term high.
The extreme still requires confirmation from price action. Commercial traders can remain at an extreme for an extended period before the market reverses.
COT Data and Quarterly Shifts
Commercial hedging programs can also help identify quarterly market changes.
Markets often experience meaningful shifts in market structure every three or four months. A directional move may then continue for several weeks or months.
The six-month and twelve-month COT ranges help reveal these changes because they show whether commercial positioning is beginning to move from one side of its recent range to the other.
A potential bullish quarterly shift may include:
- Commercial positioning turning higher
- Price reaching a higher-time-frame Discount Array
- Sell-side liquidity being removed
- Bullish market structure developing
- A new bullish dealing range forming
A potential bearish quarterly shift may include:
- Commercial positioning turning lower
- Price reaching a higher-time-frame Premium Array
- Buy-side liquidity being removed
- Bearish market structure developing
- A new bearish dealing range forming
The Commitment of Traders report is therefore most useful for swing trading, position trading and higher-time-frame directional analysis.
How to Use Commitment of Traders Data Step by Step
Step 1: Select the Relevant Futures Contract
Choose the futures contract that corresponds with the commodity or currency you want to analyse.
For forex pairs, study the futures contract of the foreign currency.
For example:
- EURUSD can be studied with euro futures
- GBPUSD can be studied with British pound futures
- USDJPY can be studied with Japanese yen futures
- AUDUSD can be studied with Australian dollar futures
- USDCAD can be studied with Canadian dollar futures
Remember that some forex pairs may require an inverse interpretation because the foreign currency appears on the opposite side of the pair.
Step 2: Use Futures-Only COT Data
Select the futures-only report and identify the commercial long and short positions.
Calculate or display the net commercial position.
Step 3: Plot the Commercial Net-Position Line
Place the commercial net-position data under a daily or weekly price chart.
Display at least twelve months of data.
Step 4: Identify the Zero-Line Program
Determine whether commercials are:
- Above zero and broadly net long
- Below zero and broadly net short
This defines the larger commercial program.
Step 5: Mark the Six-Month Range
Identify the highest and lowest commercial readings from the previous six months.
Divide the range at its midpoint.
Step 6: Mark the Twelve-Month Range
Identify the highest and lowest readings from the previous twelve months.
Compare the current commercial position with this larger range.
Step 7: Identify the Hedging Direction
Determine whether the commercial position is:
- Rising within the range
- Falling within the range
- Near the upper extreme
- Near the lower extreme
- Remaining in a tight consolidation
Step 8: Determine Institutional Order Flow
Study higher-time-frame price action.
Ask whether bullish or bearish PD Arrays are being respected.
Step 9: Locate Premium or Discount
For bullish ideas, focus on Discount PD Arrays.
For bearish ideas, focus on Premium PD Arrays.
Step 10: Wait for a Trade Setup
Use the Commitment of Traders report to establish directional bias.
Use lower-time-frame ICT concepts to frame the actual entry.
Possible entry confirmations include:
- Liquidity sweep
- Market structure shift
- Fair value gap
- Order block
- Optimal Trade Entry
- Breaker block
- Displacement
- Change in State of Delivery
Example of a Bullish COT Framework
Suppose commercial traders are below the zero line, which indicates a larger sell program.
However, during the last several weeks:
- Commercial positioning rises sharply within its six-month range
- Commercial positioning also rises within its twelve-month range
- Price sweeps a significant weekly low
- A higher-time-frame bullish order block supports price
- Bearish PD Arrays begin failing
- Price displaces higher and breaks a short-term high
Although commercials remain technically net short, the change inside the range reveals bullish hedging activity.
The trader can then look for a retracement into a Discount PD Array for a possible long setup.
The broad commercial sell program remains relevant, so the trader may use nearer profit objectives rather than assuming a permanent long-term reversal.
Example of a Bearish COT Framework
Suppose commercial traders are above the zero line, indicating a larger buy program.
However:
- Commercial positioning declines within its six-month range
- The twelve-month position also begins weakening
- Price trades into a weekly Premium Array
- Buy-side liquidity is taken above an old high
- A bearish market structure shift forms
- Price displaces lower through a bullish order block
This combination suggests a bearish hedging program may be developing inside the larger commercial buy program.
The trader can use a retracement into a Premium PD Array to frame a short-term bearish setup.
Important COT Price Levels
Areas where commercial hedging activity changes significantly may later become important price levels.
When commercial positioning shifts aggressively near a particular price, the trader should mark that area on the chart.
The level may later function as:
- Support
- Resistance
- A bullish order block
- A bearish order block
- A Premium PD Array
- A Discount PD Array
- A liquidity objective
- A long-term reversal area
The Commitment of Traders report therefore provides more than directional information. It can also help the trader recognise price levels associated with significant commercial activity.
Common Commitment of Traders Mistakes
Buying Only Because Commercials Are Net Long
Commercials can remain net long while price continues falling.
The current position must be compared with the six-month and twelve-month ranges.
Selling Only Because Commercials Are Net Short
Commercials can remain net short during a strong bullish move.
Look for changes inside the commercial range and confirmation from price.
Ignoring Institutional Order Flow
COT data does not replace price action.
If commercial positioning appears bullish but institutional order flow remains bearish, the trader should wait for price to confirm a change.
Using COT Data for Precise Entries
The COT report is weekly data. It is not designed to identify an exact intraday entry price.
Use it for directional analysis and then apply lower-time-frame execution models.
Focusing on Small Speculators
The ICT method primarily focuses on commercial traders.
Small-speculator positioning is not the main source of institutional insight.
Ignoring Historical Extremes
A commercial position near a four-year extreme should not be treated the same as an ordinary six-month fluctuation.
The longer-term context matters.
Treating the Report as Immediate
COT data reflects positions from earlier in the week and is released later.
It should be used as a higher-time-frame analytical tool rather than as a real-time signal.
Commitment of Traders Checklist
Before using COT data for directional analysis, confirm the following:
- Have I selected the correct futures contract?
- Am I using futures-only data?
- Have I identified the commercial net position?
- Are commercials above or below the zero line?
- What is the highest commercial reading from the last six months?
- What is the lowest commercial reading from the last six months?
- What is the highest commercial reading from the last twelve months?
- What is the lowest commercial reading from the last twelve months?
- Is commercial positioning currently rising or falling?
- Is the market near a major commercial extreme?
- Is institutional order flow bullish or bearish?
- Is price trading at a Premium or Discount PD Array?
- Has liquidity been taken?
- Has market structure confirmed the directional idea?
- Is the COT analysis supporting the trade rather than acting as the only reason for entering?
Final Thoughts
The Commitment of Traders report gives traders a weekly view of how major futures-market participants are positioned. However, the ICT interpretation goes beyond the common net-long versus net-short analysis.
The zero line identifies the broad commercial buy or sell program. The six-month and twelve-month ranges reveal the shorter-term hedging activity occurring within that larger program. Institutional order flow confirms whether price delivery is bullish or bearish, while the ICT PD Array Matrix identifies the most favourable location for a setup.
The strongest analysis appears when commercial positioning, institutional order flow and Premium or Discount Arrays all support the same directional expectation.
The central principle is simple: commercial traders should not be followed blindly. Their activity must be interpreted within a range and then confirmed through price action.
As Michael J. Huddleston explains:
“By blending those things, you can get to the truth of what the market’s actually doing.”
The Commitment of Traders report is not an entry system by itself. It is a higher-time-frame directional filter that can help traders understand commercial hedging, identify important market conditions and approach ICT trade setups with greater confidence.
All trading examples and concepts discussed here are for educational and paper-trading purposes. Futures, forex and commodity trading involve substantial risk, and no analytical method can guarantee future results.