ICT Divergence Phantoms/SMT Divergence is an important divergence concept studied by ICT (Inner Circle Trader) traders to understand when common retail divergence signals may create a false expectation in the market. The concept is explained by Michael J. Huddleston, the Inner Circle Trader, through price action, liquidity and institutional order flow.
In his Divergence Phantoms teaching, Huddleston does not use a momentum indicator as the primary reason to enter a trade. Instead, he studies how indicator-based traders may interpret divergence and then compares that expectation with what price is actually showing.
The basic idea is simple.
Retail traders see divergence and expect a top or bottom.
An ICT trader studies liquidity and asks where price is actually likely to seek orders.
Michael J. Huddleston clearly explains:
“Price has no awareness of our indicators.”
This difference between indicator expectation and actual price delivery creates the idea of ICT Divergence Phantoms.
What Is ICT Divergence Phantoms?
ICT Divergence Phantoms is a condition where a traditional momentum divergence gives traders one directional expectation, but price action and institutional order flow suggest a different outcome.
For example, price may create a higher high while a stochastic indicator creates a lower high.
A traditional trader sees bearish divergence.
The trader assumes price has formed a top.
So the trader sells.
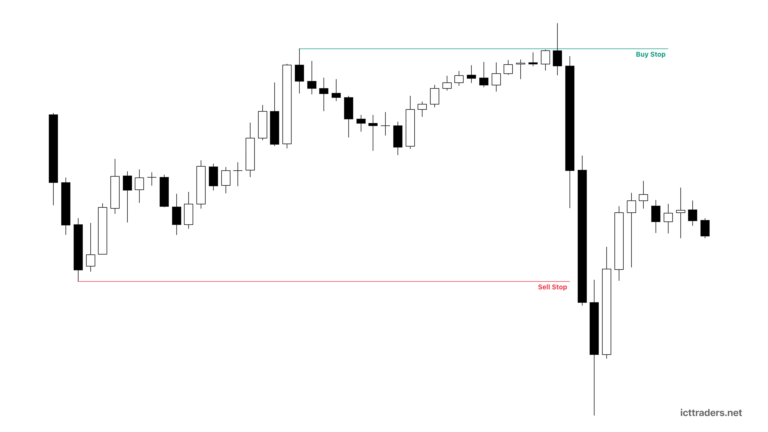
But above the market, an old high may still contain buy-side liquidity.
Price may also be very close to equal highs.
From an ICT perspective, the market may still have a reason to trade higher and run the buy stops above those highs.
Price can retrace lower, attract bearish traders and then aggressively move higher.
The bearish divergence becomes a divergence phantom or market maker trap.
The indicator correctly shows a difference in momentum.
But the trader’s interpretation of what price should do next becomes wrong.
Are ICT Divergence Phantoms and SMT Divergence the Same?
ICT Divergence Phantoms and SMT Divergence should not be treated as exactly the same setup.
The teaching in this specific ICT mentorship lesson focuses mainly on price versus a momentum indicator, particularly stochastic.
The trader compares:
Price high or low
with
Momentum indicator high or low
The purpose is to understand how common divergence signals may influence the retail trader’s expectation.
SMT Divergence is a broader ICT divergence study normally associated with disagreement in price delivery.
Therefore, the important point for this lesson is not simply to call every divergence an SMT Divergence.
The main focus is the divergence phantom—a divergence signal that appears convincing to indicator-based traders while liquidity and price action indicate another objective.
For traders studying ICT Divergence Phantoms/SMT Divergence, understanding this difference is important.
Why ICT Does Not Rely on Indicators for Future Price Direction
Michael J. Huddleston explains that indicators are mathematically derived from past price information.
The indicator receives previous market data.
It mathematically processes that information.
Then it produces an output.
The problem is that this output does not tell the trader where actual liquidity is resting.
A stochastic indicator cannot directly show the buy stops above an old high.
It cannot directly identify sell stops below equal lows.
It does not know where institutional participants may seek liquidity.
Huddleston states:
“The indicators don’t have any reflection whatsoever about what the market is going to do next.”
This does not mean an ICT trader can never look at an indicator.
In the Divergence Phantoms lesson, the indicator is used to understand retail sentiment and retail expectation.
The ICT trader asks:
What are indicator traders seeing?
Are they expecting a top?
Are they expecting a bottom?
Are they being encouraged to sell?
Are they being encouraged to buy?
Then price action and liquidity are studied to determine whether the opposite scenario may occur.
How Retail Traders Read Divergence
According to the lesson, many retail divergence strategies are built around four basic conditions.
The indicator may be overbought.
The indicator may be oversold.
An overbought market may show bearish divergence.
An oversold market may show bullish divergence.
Retail traders then try to use these conditions to pick tops and bottoms.
Bearish divergence means sell the top.
Bullish divergence means buy the bottom.
But ICT adds another important question.
Is this actually a time to be trading?
A market can remain in consolidation.
Price may be building liquidity.
The apparent divergence may not create the large reversal expected by the retail trader.
This is why price action, liquidity and the current market condition are important.
Type 1 Bearish Divergence
Type 1 bearish divergence is the classic bearish divergence commonly shown in trading books.
Price creates a higher high.
But the momentum indicator fails to create a corresponding higher high.
Instead, the indicator creates a lower high.
The basic structure is:
Price = Higher High
Momentum = Lower High
Retail traders normally interpret this as a bearish signal.
They assume upward momentum is becoming weak.
They expect price to reverse lower.
Therefore, many traders begin looking for short positions.
But ICT Divergence Phantoms teach that the trader should first study price.
Is there buy-side liquidity above another nearby high?
Are equal highs present?
Is price too close to an old high to reasonably ignore the liquidity above it?
Has sell-side liquidity already been taken?
These questions can completely change the meaning of the divergence.
A bearish divergence does not automatically mean the market has formed a major top.
Type 1 Bullish Divergence
Type 1 bullish divergence is the opposite condition.
Price creates a lower low.
But the momentum indicator fails to create a corresponding lower low.
The indicator creates a higher low.
The basic structure is:
Price = Lower Low
Momentum = Higher Low
Traditional divergence traders interpret this as a bullish signal.
They may assume downward momentum is weakening.
Therefore, they begin looking for the bottom of the market.
Again, the indicator alone does not explain where price is likely to seek liquidity.
Price may still have a lower sell-side liquidity objective.
Therefore, the ICT trader studies price action before accepting the indicator-based signal.
Type 2 or Hidden Divergence
The Divergence Phantoms lesson also explains Type 2 divergence, commonly called hidden divergence or trend-following divergence.
This form of divergence is different from classic Type 1 divergence.
For a bullish Type 2 divergence:
Price creates a higher low.
The momentum indicator creates a lower low.
The structure is:
Price = Higher Low
Momentum = Lower Low
According to the mentorship lesson, this can create a strong trend-following condition in a bullish market.
The stochastic cycles lower.
Indicator traders may become increasingly bearish.
But price refuses to create a lower low.
Instead, price remains structurally higher.
This is important.
Momentum appears weaker.
But price is being supported at a higher level.
When liquidity and institutional order flow support higher prices, the market may continue upward.
How an ICT Divergence Phantom Forms
An ICT Divergence Phantom can form when traders become committed to a traditional divergence idea.
Consider a bearish example.
Price creates a higher high.
Stochastic creates a lower high.
Retail traders identify bearish divergence.
They sell the market.
Price moves slightly lower.
This small bearish movement gives the traders confirmation.
They believe they have captured the top.
But below the current price, equal lows may be present.
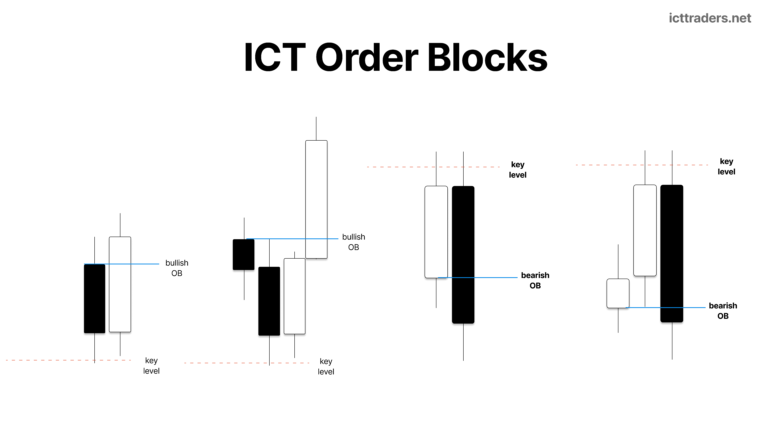
A bullish order block may also be located in the same area.
Price trades lower and clears the sell stops below the equal lows.
The market enters the bullish order block.
Retail short traders see the move lower as confirmation of their bearish divergence.
But from an ICT perspective, sell-side liquidity has now been collected.
Price can quickly reprice higher.
The market then runs toward the old high or buy-side liquidity above the market.
The original bearish divergence signal becomes a phantom.
The retail trader was encouraged to focus on the indicator while price was actually seeking liquidity.
ICT Divergence Phantoms and Liquidity
Liquidity is one of the most important parts of understanding ICT Divergence Phantoms.
Before accepting a divergence signal, the trader should identify nearby liquidity.
Look for:
Old highs
Old lows
Equal highs
Equal lows
Buy stops above highs
Sell stops below lows
Suppose price creates bearish divergence.
A retail trader immediately prepares to sell.
But an old high is only a small distance above current price.
Buy stops are expected above the old high.
From the ICT perspective, price may be too close to that liquidity to ignore it.
The market can first retrace lower.
It may clear sell-side liquidity.
Then price can move higher and attack the buy-side liquidity above the old high.
The divergence signal helps create the bearish expectation.
Liquidity explains the possible price objective.
USDCAD Divergence Phantom Example
In the USDCAD one-hour example from the ICT mentorship lesson, price creates a slightly higher high.
At the same time, momentum is showing a potential bearish divergence.
A traditional trader sees:
Higher high in price
Failure to create a higher high in stochastic
This is a Type 1 bearish divergence.
The retail trader expects lower prices.
But the chart also contains equal lows.
Price moves downward and clears the equal lows.
This removes sell-side liquidity.
Price also trades into a bullish order block.
The bearish divergence traders now believe the move lower confirms their short idea.
However, price action tells another story.
Above the market, equal highs and an old high contain liquidity.
Price is close to these higher levels.
After clearing sell-side liquidity and interacting with the bullish order block, price begins moving higher.
A new relationship develops.
Price creates a higher low.
Stochastic creates a lower low.
This is Type 2 bullish or trend-following divergence.
Price then continues higher and runs the liquidity above the previous high.
The retail traders looking for a major bearish reversal are left on the wrong side of price delivery.
The Role of Equal Lows in Divergence Phantoms
Equal lows can be important when studying a bullish Divergence Phantom setup.
Sell stops may rest below these lows.
When price moves toward the equal lows, a bearish divergence trader may interpret the movement as confirmation that the market is breaking down.
But the ICT trader studies the liquidity below the lows.
Price can trade below the equal lows and collect sell-side liquidity.
Why is this important?
Because willing sellers are entering or being stopped into the market around these levels.
Liquidity becomes available.
After the sell-side liquidity run, price can aggressively move in the opposite direction.
Therefore, a small bearish movement after bearish divergence should not automatically be viewed as confirmation of a major market top.
The trader must study what liquidity price has taken.
The Role of Bullish Order Blocks
In the USDCAD example, price does not simply clear equal lows.
It also trades into a bullish order block.
This creates another part of the ICT price narrative.
Retail traders are focused on bearish divergence.
They expect the market to continue lower.
ICT price action analysis studies the last down candle associated with the previous bullish movement.
Price trades back into this range.
Sell-side liquidity is cleared.
The bullish order block is reached.
Price is now at an area where the trader can study a potential continuation higher.
The order block is not being used because a stochastic indicator gives a buy signal.
The trader is studying price delivery and liquidity.
Divergence Phantom as a Market Maker Trap
The ICT Divergence Phantoms lesson describes the setup as a market maker trap.
The trap develops through trader expectation.
A higher high in price and lower high in stochastic creates a familiar bearish divergence signal.
Many traders have studied this pattern in books, courses and indicator systems.
Therefore, the signal can create a common expectation.
Traders begin selling.
A short-term movement lower may increase their confidence.
They expect the market to continue toward classic support levels.
But price first clears sell-side liquidity and then reverses.
The market attacks liquidity above the previous highs.
The traders who sold the bearish divergence are now trapped.
Some may have stop-loss orders above the high.
When price moves higher, these stops can become part of the liquidity above the market.
This is why the ICT trader studies the thought process behind market participation.
USDCHF Divergence Phantom Example
The second major example in the lesson uses the USDCHF one-hour chart.
Price has already made a strong rally.
Then price creates another higher high.
Stochastic fails to create the same higher high.
Again, a Type 1 bearish divergence is visible.
Retail traders expect the rally to be ending.
They begin identifying lower support levels as targets.
From a classic support and resistance perspective, the trader expects price to move down toward previous lows.
But ICT price analysis identifies the last down candle before the strong bullish price move.
The range of this candle becomes important.
Price is expected to retrace lower.
However, the expectation is not for price to completely break the important low.
The lesson identifies approximately 96.45 to 96.40 as the expected lower price area.
At the same time, the stochastic is expected to cycle below its previous indicator low.
This creates an interesting divergence.
Price remains at a higher low.
Stochastic creates a lower low.
The market reacts from approximately 96.45 and moves aggressively higher.
This creates another Type 2 bullish divergence condition.
Price then trades through higher liquidity levels.
The original bearish divergence traders were expecting a top.
Instead, price continued higher.
Why a Higher Low in Price and Lower Low in Momentum Matters
One of the most important relationships in this lesson is:
Price = Higher Low
Momentum Indicator = Lower Low
The stochastic may show a strong downward momentum cycle.
But price refuses to create a lower low.
This means the indicator and price are giving different visual information.
The indicator-based trader may become bearish.
But the ICT trader studies whether institutional order flow supports higher prices.
If sell-side liquidity has been taken and price remains structurally higher, the lower low in stochastic does not automatically mean price must collapse.
It can instead help show how strongly retail sentiment is being pulled toward the bearish side.
When price then expands higher, bearish traders can become trapped.
How to Identify ICT Divergence Phantoms on a Chart
First, identify a traditional momentum divergence.
Look for a higher high in price and a lower high in momentum.
This creates a potential Type 1 bearish divergence.
Or look for a lower low in price and a higher low in momentum.
This creates a potential Type 1 bullish divergence.
Next, do not immediately enter based on the indicator.
Study the surrounding price action.
Mark old highs and old lows.
Identify equal highs and equal lows.
Determine where buy-side and sell-side liquidity may be resting.
Study whether price is close to an important liquidity level.
Then identify ICT price arrays such as an order block.
Watch where price retraces.
Study which side of liquidity is taken during the retracement.
Finally, compare price with the momentum cycle again.
A higher low in price with a lower low in stochastic may show Type 2 bullish divergence.
The opposite condition may occur during bearish price delivery.
The indicator is used as a contrasting view.
Price and liquidity remain the primary focus.
How ICT Traders Use Momentum Indicators
The lesson does not teach traders to create stochastic-based entries.
This is important.
The stochastic is not used as the primary buy or sell signal.
Instead, it can be used to understand what the retail trader may be seeing.
For example:
Bearish divergence visible
Retail traders may look for a top.
Bullish divergence visible
Retail traders may look for a bottom.
Stochastic cycles aggressively lower
Retail traders may expect price to continue lower.
The ICT trader then compares this expectation with price.
Has price taken sell-side liquidity?
Is price inside a bullish order block?
Is buy-side liquidity still resting above the market?
Is price creating a higher low despite the lower momentum reading?
When price action supports the opposite direction, the divergence can become a phantom.
Important Rules of ICT Divergence Phantoms
Do not trade only because stochastic is overbought or oversold.
Do not automatically sell every Type 1 bearish divergence.
Do not automatically buy every Type 1 bullish divergence.
Always identify nearby buy-side and sell-side liquidity.
Study equal highs and equal lows.
Watch old highs and old lows where stop liquidity may rest.
Determine whether price has cleared one side of liquidity.
Study order blocks and the current price delivery.
Use the indicator to understand the contrasting retail view.
Remember that price does not follow the indicator.
A Type 2 hidden divergence can support trend continuation when price action and institutional order flow agree.
The divergence should be qualified by what price is actually doing.
ICT Divergence Phantoms vs Traditional Divergence Trading
Traditional divergence trading focuses mainly on the relationship between price and momentum.
A higher high in price with a lower high in momentum is bearish.
A lower low in price with a higher low in momentum is bullish.
The trader tries to identify the market top or bottom.
ICT Divergence Phantoms use a different perspective.
The trader first recognizes what the traditional divergence trader is seeing.
Then liquidity is studied.
Where are the stops?
Which side of liquidity has been taken?
Is price entering an order block?
What price level is the market likely to reach for?
Does the current price structure support continuation rather than reversal?
The objective is not to blindly trade against every retail divergence signal.
The objective is to identify when price action and liquidity provide a reason for the traditional divergence expectation to fail.
Final Thoughts on ICT Divergence Phantoms/SMT Divergence
ICT Divergence Phantoms/SMT Divergence study helps traders understand that divergence should not be viewed only through a momentum indicator.
In this specific ICT mentorship lesson, Michael J. Huddleston focuses on momentum divergence phantoms and the market maker trap created when retail traders expect a top or bottom from traditional indicator divergence.
A Type 1 bearish divergence may attract sellers.
Price may initially move lower.
But if that movement clears sell-side liquidity, trades into a bullish order block and leaves buy-side liquidity above the market, the bearish divergence may become a trap.
A higher low in price with a lower low in momentum can then create Type 2 bullish or hidden divergence.
Price may continue higher and attack the liquidity above old highs.
The important lesson is simple.
Do not ask only what the indicator is showing.
Ask what retail traders are likely expecting from that indicator.
Then study liquidity, price action and institutional order flow to determine where price may actually be reaching.
This is the main idea behind ICT Divergence Phantoms and why divergence can sometimes become a powerful market maker trap.