ICT Mitigation Blocks are an important Order Block concept taught by ICT or Inner Circle Trader.
The concept is mainly used when market gives a clear indication that price wants to continue higher or lower in a step-like movement.
In a bearish market–
Price moves lower.
Then rallies higher.
Then moves lower again.
The rallies can provide selling opportunities.
In a bullish market–
Price moves higher.
Then retraces lower.
Then continues higher.
The declines can provide buying opportunities.
ICT Mitigation Blocks help the trader identify a specific candle where price may return before continuing in the expected direction.
But a Mitigation Block should not be marked randomly.
First the market needs a context.
The trader needs a bullish or bearish expectation.
A Market Structure Shift should occur.
Then the correct short-term swing and candle can be selected.
What Are ICT Mitigation Blocks?
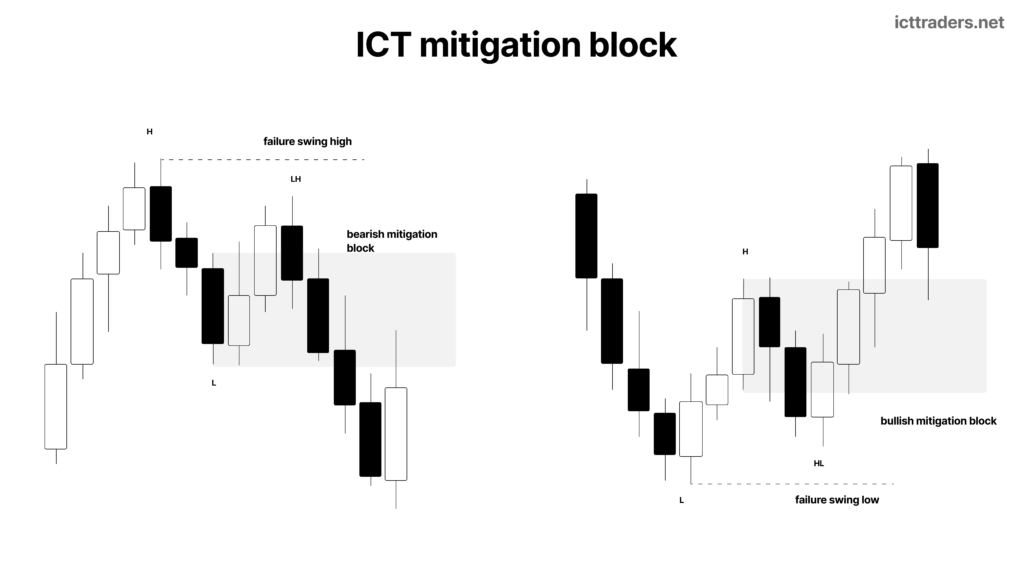
ICT Mitigation Blocks are institutional reference points formed after price breaks an important short-term swing and later returns towards the candle connected with the failed price movement.
Suppose the market is bearish.
Price forms a short-term low.
From this low, price rallies higher.
Buyers entered during this movement.
But instead of continuing higher, price later breaks below the short-term low.
The bullish move has failed.
The buyers who entered around the previous low are now in a losing position.
ICT focuses on the last down-close candle at the short-term low before the rally higher.
When price breaks below the low and later retraces higher, that last down-close candle can become a bearish ICT Mitigation Block.
Price may return into the candle.
The previous buying positions get an opportunity to reduce or mitigate losses.
At the same time, the bearish price narrative can provide a new short opportunity.
The basic bearish ICT Mitigation Block model is–
Short-term Low → Rally Higher → Low Broken → Market Structure Shift → Retracement → Last Down-close Candle → Sell
The bullish model is the opposite–
Short-term High → Move Lower → High Broken → Bullish Market Structure Shift → Retracement → Last Up-close Candle → Buy
Why Do ICT Mitigation Blocks Form?
To understand ICT Mitigation Blocks, first understand what happens to traders inside a failed price swing.
Suppose price forms a short-term low.
Price rallies from the low.
Buyers enter the market.
At first, their trade appears correct.
Price moves from Point A to Point B.
Then the market reverses.
Price moves lower from Point B to Point C.
Finally, price breaks below the original short-term low.
Now the buyers who entered around the A to B price swing are underwater.
Their bullish position is in a loss.
If price later rallies back towards the previous entry area, these buyers may get an opportunity to exit or reduce their losing positions.
This is the mitigation idea.
According to the ICT (Inner Circle Trader) framework, larger participants involved around the previous price movement may also use a return into the area to mitigate positions.
Price returns towards the previous short-term low.
The old support area is revisited.
The last down-close candle inside the low becomes the important reference point.
In a bearish context, this return can provide a selling opportunity.
So ICT Mitigation Blocks form around a failed price swing where previous positions become trapped after a Market Structure Shift.
ICT Mitigation Blocks and Market Context
Market context is compulsory before using ICT Mitigation Blocks.
Do not start by searching every last down-close or up-close candle.
First ask–
Is the market bullish?
Or is the market bearish?
In a bearish market, ICT Mitigation Blocks are used to sell rallies.
In a bullish market, ICT Mitigation Blocks are used to buy declines.
For bearish condition, price may be moving towards a resistance area.
The resistance can be–
An old high.
An old low acting as resistance.
Bearish Order Block.
Breaker.
Another bearish institutional reference point.
The exact level can be different.
The important point is that the trader already has a reason to anticipate selling pressure.
Price reaches the bearish area.
Now the trader waits.
Do sellers actually appear?
Does price show a willingness to move lower?
The trader does not sell only because price touched resistance.
Price must confirm the bearish idea.
This confirmation comes from the failure swing and Market Structure Shift.
Failure Swing in ICT Mitigation Blocks
The bearish example taught by ICT can form an M-type price pattern.
Price rallies towards resistance.
A high is formed.
Price moves lower.
Then price rallies again.
The second rally fails to create a strong continuation higher.
This creates a failure swing.
The price structure may visually look like an M.
But the visual M shape alone is not enough.
The trader focuses on the short-term low between the two higher movements.
This low becomes important.
If price breaks below this low, the market has shown a bearish change in structure.
The failure swing gives the setup context.
The break of the low gives confirmation.
The basic process is–
Resistance → Rally → Short-term Low → Failed Rally → Break Below Low
After the low is broken, the trader starts searching for the ICT Mitigation Block.
Market Structure Shift in ICT Mitigation Blocks
Market Structure Shift or MSS is one of the important conditions in ICT Mitigation Blocks.
Suppose the market was previously moving higher.
Price creates a short-term low.
Then rallies.
If price later breaks below this low, the short-term support has failed.
In the bearish example, this break gives evidence that price has a willingness to move lower.
The trader now has confirmation of bearish price delivery.
Before the Market Structure Shift, the previous down-close candle is not automatically used as a bearish Mitigation Block.
The low first needs to give way.
After the low is broken, the trader looks back towards the old short-term low.
Inside this low, find the last down-close candle before the rally higher.
This candle becomes the important bearish Mitigation Block reference.
The simple process is–
Short-term Low → Rally → Break Below Short-term Low → Bearish MSS → Find Last Down-close Candle
For bullish ICT Mitigation Blocks, reverse the process.
Short-term High → Price Moves Lower → Break Above Short-term High → Bullish MSS → Find Last Up-close Candle
How to Identify a Bearish ICT Mitigation Block
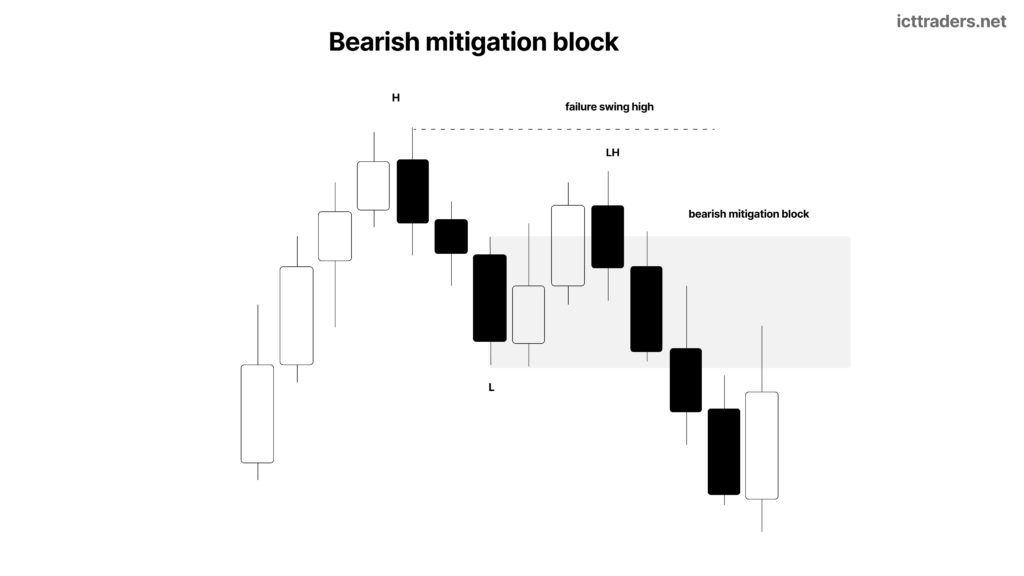
The following process can be used to find a bearish ICT Mitigation Block.
Step 1– Develop a Bearish Market Context
First the trader needs a bearish expectation.
Price may be moving into an anticipated resistance level.
The market may already show bearish price delivery.
The trader expects lower prices.
Do not use a bearish Mitigation Block when the market narrative is strongly bullish.
Step 2– Find the Short-term Low
Watch the price movement around the resistance area.
Price moves lower and creates a short-term low.
Then price rallies from the low.
This short-term rally is important.
Buyers may have entered around the low.
Mark the low.
Step 3– Wait for the Failure Swing
Price rallies.
Then price shows a failure to continue strongly higher.
The market may create an M-type formation.
The trader still waits.
The failure swing itself is not the final confirmation.
Step 4– Wait for Market Structure Shift
Price should move lower and break the marked short-term low.
When the low is broken, short-term support has given way.
In the bearish context, this confirms willingness to deliver lower.
Now the trader starts looking for the ICT Mitigation Block.
Step 5– Find the Last Down-close Candle
Go back to the short-term low that was broken.
Look inside the low.
Find the last down-close candle before the short-term rally higher.
This is important.
For the bearish ICT Mitigation Block shown in the lesson, the trader is looking for the last down-close candle.
This can confuse beginners.
They may think a bearish setup always needs an up-close candle because a Bearish Order Block normally uses an up-close candle.
But a Mitigation Block is a different concept.
The last down-close candle represents the area where buying took place before the failed rally.
After price breaks below the low, those bullish positions are underwater.
This candle becomes the bearish mitigation reference.
Step 6– Wait for Price to Retrace
Price has already moved lower.
Do not think the trade is missed.
Wait for price to rally back.
The trader wants price to return towards the previous short-term low and into the last down-close candle.
This return creates the possible short entry.
Step 7– Sell from the Mitigation Block
When price trades back into the bearish ICT Mitigation Block, the trader can search for a short position.
The expectation is that price will continue lower.
The first objective may be liquidity below the recent short-term low.
A larger objective may be a higher time frame support or bullish institutional reference point below price.
How to Identify a Bullish ICT Mitigation Block
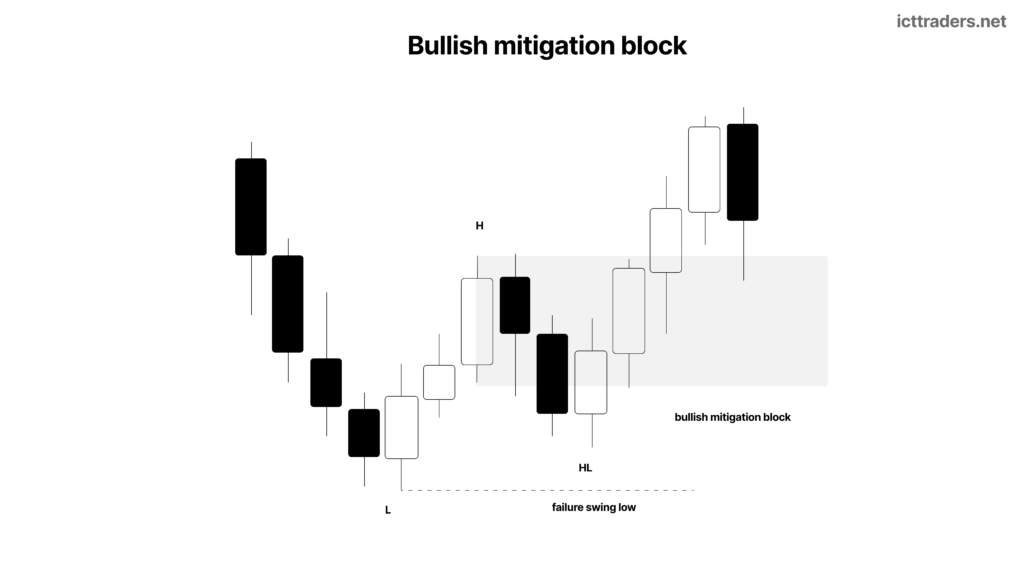
The bullish ICT Mitigation Block is the reverse of the bearish model.
First develop a bullish market context.
Price may be trading towards an anticipated support area.
The trader expects higher prices.
Price forms a short-term high.
Then price moves lower from the high.
Sellers may enter during this move.
Later price reverses higher.
The short-term high is broken.
This creates a bullish Market Structure Shift.
Now look back towards the broken short-term high.
Find the last up-close candle before the short-term move lower.
The sellers associated with the previous decline are now underwater.
If price retraces lower towards the old high and into the last up-close candle, this area can become a bullish ICT Mitigation Block.
The trader can search for a buying opportunity.
The bullish process is–
Bullish Context → Short-term High → Move Lower → High Broken → Bullish MSS → Last Up-close Candle → Retracement → Buy
The A-B-C Logic of ICT Mitigation Blocks
ICT explains Mitigation Blocks with three price reference points–
Point A.
Point B.
Point C.
Suppose the market is bearish.
Point A
Point A is around the short-term low.
Buyers enter around this area.
Point B
Price rallies higher from Point A to Point B.
At this moment, the bullish positions may be profitable.
The buyers believe price may continue higher.
Point C
Price reverses from Point B.
It moves lower.
The market breaks below Point A.
Now the previous buyers are underwater.
The A to B bullish move has failed.
When price later returns towards Point A, the previous long positions may get an opportunity to reduce or mitigate their losses.
This return into the Point A price area creates the mitigation setup.
The bearish A-B-C flow is–
A → Buyers Enter
A to B → Price Rallies
B to C → Price Breaks Lower
C → Buyers Underwater
Return to A → Loss Mitigation and Possible Short Entry
The same concept can be reversed for bullish ICT Mitigation Blocks.
Buyer’s Remorse and ICT Mitigation Blocks
The bearish ICT Mitigation Block also looks similar to a traditional support-broken-becomes-resistance idea.
A short-term low previously acted as support.
Price rallied from this area.
Then the low was broken.
When price returns to the old low, the previous support can act as resistance.
ICT explains this with the idea of buyer’s remorse.
Suppose buyers entered around the old low.
Price initially moved slightly higher.
Then the market collapsed below their entry area.
The buyers now hold losing positions.
When price rallies back towards their entry, they may decide to exit.
They are relieved to get out around the previous buying area.
This selling pressure can support another bearish move.
The ICT Mitigation Block gives a more specific candle reference inside this support-to-resistance process.
Instead of only drawing a horizontal line on the old low, the trader focuses on the last down-close candle associated with the failed bullish swing.
Why the Last Down-close Candle Is Used in a Bearish ICT Mitigation Block
This is one of the most important parts of ICT Mitigation Blocks.
Suppose price forms a short-term low.
The last down-close candle appears.
Then price rallies.
The buying associated with the short-term move higher occurs around this area.
Later price breaks below the low.
The previous bullish positions are now losing.
The down-close candle becomes the price area connected with the failed bullish move.
When price returns, these positions can be mitigated.
So in the bearish Mitigation Block model–
The last down-close candle is used.
Not the last up-close candle.
The Market Structure Shift changes the meaning of the candle.
Before the low breaks, the candle was connected with a bullish rally.
After the low breaks, price has shown bearish willingness.
The same candle can now provide a level to sell when price retraces.
For bullish Mitigation Block–
Use the last up-close candle connected with the failed bearish move before the short-term high is broken.
ICT Mitigation Blocks vs ICT Order Blocks
ICT Mitigation Blocks are an amplification of Order Block theory.
But the candle selection is different.
For a basic Bullish ICT Order Block–
The trader may focus on the lowest important down-close candle near support.
Price trades through its high.
The bullish Order Block is validated.
For a basic Bearish ICT Order Block–
The opposite logic is used with an up-close candle.
ICT Mitigation Blocks focus on positions trapped inside a failed swing after Market Structure Shift.
For bearish mitigation–
A short-term low forms.
The last down-close candle supports a rally.
The low later breaks.
The buyers become underwater.
Price retraces into the same down-close candle.
The trader searches for a sell.
So the easy difference is–
ICT Order Block– Candle supports the directional move.
ICT Mitigation Block– Candle is connected with a failed swing and underwater positions which may be mitigated after Market Structure Shift.
Do not use the same candle-selection rule for both concepts.
How to Mark ICT Mitigation Blocks on the Chart
First mark the broken swing level.
For bearish ICT Mitigation Block–
Find the short-term low that was broken.
Move to the last down-close candle associated with the rally from that low.
Mark the candle.
ICT explains that the whole candle body can be used as the Mitigation Block reference.
Price may slightly overshoot a specific price level.
This does not automatically destroy the setup.
The trader observes how price reacts inside the candle body.
For bullish ICT Mitigation Block–
Find the short-term high that was broken.
Look for the last up-close candle associated with the bearish move from the high.
Mark the candle area.
Wait for price to retrace into it.
The candle should always be selected from the important broken swing.
Do not mark every down-close or up-close candle as a Mitigation Block.
Body of the ICT Mitigation Block Candle
The candle body is important in ICT Mitigation Blocks.
In the bearish example from the lesson, price may trade slightly above the exact lower reference of the candle.
But price remains inside the body.
The body is not completely violated.
ICT describes this type of reaction as an important characteristic of a Mitigation Block.
So do not use only one small line at the bottom of the candle.
Study the entire candle body.
Suppose price returns into a bearish Mitigation Block.
Price trades inside the down-close candle.
It may overshoot the initial level by a small amount.
But price fails to strongly violate the candle structure.
Then price starts moving lower.
This can still support the bearish mitigation narrative.
The bullish condition is reversed.
Is There a Time Limit for an ICT Mitigation Block to Form?
According to the ICT, there is no fixed rule for how long price must take before the short-term low or high is violated.
Suppose a short-term low forms.
Price rallies.
The low may be broken shortly after.
Or price may take more time before the level gives way.
The trader notes the short-term swing.
When the level is broken in the expected market context, it becomes important.
So the focus should not be–
The low must break in three candles.
Or–
The Mitigation Block must form within one session.
The focus is on price structure.
Short-term swing forms.
Price moves away.
The swing fails.
Market Structure Shift occurs.
Then the trader identifies the mitigation candle.
Step-Ladder Price Delivery and ICT Mitigation Blocks
ICT Mitigation Blocks work well with step-ladder price delivery.
In a bearish market–
Price moves lower.
Rallies.
Moves lower.
Rallies again.
Then continues lower.
Each rally which leads to another lower price swing may create a new mitigation opportunity.
The trader follows the broken short-term lows.
After a new low is broken, attention moves to the last down-close candle associated with the previous short-term rally.
If price returns into the candle, another selling opportunity may form.
The bearish process can repeat–
Break Low → Mark Mitigation Block → Rally into Block → Sell → New Lower Low
Then–
Break New Low → Mark New Mitigation Block → Rally into Block → Sell → Lower Price
This creates the step-ladder formation.
For bullish condition–
Break High → Mark Bullish Mitigation Block → Retrace into Block → Buy → New Higher High
The trader is selling rallies in bearish markets and buying declines in bullish markets.
How to Trade Bearish ICT Mitigation Blocks
The following is a simple bearish trading process.
1. Find Bearish Context
First expect lower prices.
Price may be near an anticipated bearish institutional reference point or resistance area.
2. Wait for a Failure Swing
Observe the short-term price structure.
An M-type failure swing may form.
3. Mark the Short-term Low
Identify the low between the price rallies.
This level is the Market Structure Shift reference.
4. Wait for the Low to Break
Price should trade below the short-term low.
Now bearish Market Structure Shift is present.
5. Find the Last Down-close Candle
Look inside the broken short-term low.
Find the last down-close candle before the short-term rally.
This is the bearish ICT Mitigation Block.
6. Wait for the Retracement
Price may already be trading lower.
Do not chase.
Wait for a rally back towards the broken low.
7. Observe Price inside the Mitigation Block
Price trades into the last down-close candle.
The candle body becomes the area of interest.
8. Search for Short Entry
The return into the bearish ICT Mitigation Block can provide a selling opportunity.
9. Place Stop above the Candle
The protective stop should be above the relevant Mitigation Block candle.
The exact level depends on the candle structure.
10. Target Lower Liquidity
The first objective can be liquidity below a recent short-term low.
A larger target may be a higher time frame support level below price.
How to Trade Bullish ICT Mitigation Blocks
The bullish process is the opposite.
1. Find Bullish Context
Expect higher prices.
Price may be near support or another bullish institutional reference point.
2. Wait for a Failure Swing
A W-type price formation may appear.
3. Mark the Short-term High
The high becomes the structural reference.
4. Wait for Price to Break the High
A break above the high creates bullish Market Structure Shift.
5. Find the Last Up-close Candle
Look at the candle connected with the short-term bearish move from the high.
The last up-close candle becomes the bullish ICT Mitigation Block reference.
6. Wait for Price to Retrace
Price moves higher.
Then price returns lower towards the broken short-term high.
7. Observe the Mitigation Block
Price trades into the last up-close candle.
8. Search for Buy Entry
The return can provide a bullish entry.
9. Place Stop below the Block
Use the logical lower invalidation area of the Mitigation Block.
10. Target Higher Liquidity
The objective can be Buy-side Liquidity above a previous high or another higher time frame target.
Stop Loss in ICT Mitigation Block Trading
Risk should be defined by the Mitigation Block candle.
In the bearish example taught by ICT, the protective stop is placed above the down-close candle used as the Mitigation Block.
Suppose the entire candle has a high at 112.89.
The short entry occurs lower inside the candle.
The stop should be placed above the candle high.
Price may create some drawdown after entry.
A small overshoot inside the Mitigation Block does not always mean the trade has failed.
But price should not strongly move above and invalidate the relevant candle structure.
For bullish ICT Mitigation Blocks, reverse the idea.
The stop is placed below the relevant Mitigation Block candle.
Do not place a stop randomly only to create a high risk-to-reward ratio.
The stop should represent failure of the ICT Mitigation Block idea.
Profit Target for ICT Mitigation Blocks
The target should be known before entering the trade.
For a bearish ICT Mitigation Block–
Look below price.
Mark the recent short-term low.
Sell-side Liquidity may be present below the low.
This can become the first objective.
Price may also continue towards a larger higher time frame support level.
This higher time frame objective can be–
Old High acting as support.
Old Low.
Bullish Order Block.
Another anticipated bullish institutional reference point.
Liquidity Void Mean Threshold.
The exact objective depends on the market narrative.
For bullish ICT Mitigation Blocks–
Look for higher Buy-side Liquidity.
Recent High.
Previous High.
Higher time frame resistance.
Another bearish institutional reference point.
The trader uses the Mitigation Block for entry.
The liquidity or higher time frame reference point gives the target.
ICT Mitigation Block and Liquidity Void
The lesson also shows how ICT Mitigation Blocks can overlap with a Liquidity Void.
Suppose price has created a Liquidity Void.
The trader identifies the equilibrium or midpoint of the void.
Price later forms bearish price delivery.
Short-term lows are broken.
Mitigation Blocks form during the decline.
The trader can use the Mitigation Blocks to sell rallies.
The final objective may be the Mean Threshold or equilibrium of the Liquidity Void.
The process can look like–
Bearish MSS → Mitigation Block → Short → Break Low → New Mitigation Block → Short → Liquidity Void Mean Threshold
This shows why an ICT concept should not always be used alone.
ICT Mitigation Blocks can work with–
Higher time frame bias.
Market Structure Shift.
Liquidity.
Liquidity Void.
Mean Threshold.
Institutional reference points.
The Mitigation Block gives the entry area inside the larger price narrative.
Rules of ICT Mitigation Blocks
The following are the important rules of ICT Mitigation Blocks–
Rule 1– Start with Market Context
First decide whether the market condition is bullish or bearish.
Do not mark Mitigation Blocks without directional context.
Rule 2– Use an Institutional Reference Point
For bearish setup, price should have a reason to show selling pressure.
For bullish setup, price should have a reason to show buying pressure.
Rule 3– Find a Failure Swing
A bearish setup may show an M-type failure swing.
A bullish setup can show the opposite structure.
Rule 4– Wait for Market Structure Shift
For bearish mitigation, the short-term low should be broken.
For bullish mitigation, the short-term high should be broken.
Rule 5– Use the Broken Swing
The Mitigation Block is connected with the important short-term swing that failed.
Do not select a random candle.
Rule 6– Bearish Mitigation Uses the Last Down-close Candle
Find the last down-close candle at the broken short-term low before the rally.
Rule 7– Bullish Mitigation Uses the Last Up-close Candle
Reverse the concept for bullish price delivery.
Rule 8– Wait for Price to Return
The trade is not necessarily missed after the Market Structure Shift.
Wait for price to retrace into the Mitigation Block.
Rule 9– Study the Candle Body
The whole candle body can be used as the Mitigation Block reference.
A small overshoot of one price level does not always invalidate the setup.
Rule 10– Trade with the Directional Narrative
Sell rallies in bearish market conditions.
Buy declines in bullish market conditions.
Rule 11– Target Liquidity
Bearish Mitigation Block targets lower Sell-side Liquidity.
Bullish Mitigation Block targets higher Buy-side Liquidity.
Rule 12– Move to the Next Broken Swing
In step-ladder price delivery, a new broken swing may create a new ICT Mitigation Block.
Common Mistakes in ICT Mitigation Block Trading
Marking every candle– Every down-close or up-close candle is not a Mitigation Block.
Confusing Mitigation Block with Order Block– The candle selection is different.
No market context– Trader searches for mitigation without knowing the expected direction.
Entering before MSS– The trader assumes a candle is a Mitigation Block before the important swing breaks.
Using the wrong swing– A random low or high is selected instead of the failed short-term swing.
Chasing price– Trader sees the structure break and immediately sells at the low.
Ignoring the retracement– The main return into the Mitigation Block is missed.
Using only a horizontal support line– The important candle inside the broken low or high is ignored.
Fear of small overshoot– Trader assumes any small movement into the candle means the setup has failed.
No liquidity target– The entry is taken without knowing where price may deliver.
Simple ICT Mitigation Blocks Checklist
Before trading ICT Mitigation Blocks, check–
What is the market context?
Am I bullish or bearish?
Where is the higher time frame support or resistance?
Is there an institutional reference point?
Has a failure swing formed?
Where is the important short-term low or high?
Has Market Structure Shift occurred?
For bearish setup, has the short-term low been broken?
For bullish setup, has the short-term high been broken?
Where is the last down-close or up-close candle?
Is this candle connected with the failed swing?
Has price returned into the Mitigation Block?
Is the candle body being respected?
Where is the stop loss?
Where is the nearby liquidity?
What is the higher time frame objective?
If the market has not confirmed the directional shift, the ICT Mitigation Block should not be forced.
Final Concept
ICT Mitigation Blocks are used after a price swing fails and Market Structure Shift confirms a new directional movement.
For a bearish ICT Mitigation Block–
Start with bearish context.
Price forms a short-term low.
Price rallies higher.
The bullish rally fails.
Price breaks below the short-term low.
Bearish Market Structure Shift occurs.
Go back to the broken low.
Find the last down-close candle before the rally.
This is the bearish ICT Mitigation Block.
Wait for price to rally back into the candle.
Search for a short entry.
Target Sell-side Liquidity below price.
For a bullish ICT Mitigation Block–
Start with bullish context.
Price forms a short-term high.
Price moves lower.
The bearish movement fails.
Price breaks above the short-term high.
Bullish Market Structure Shift occurs.
Find the last up-close candle connected with the failed bearish move.
Wait for price to retrace into the candle.
Search for a buy entry.
Target Buy-side Liquidity above price.
The simple ICT Mitigation Blocks model is–
Context → Failure Swing → Market Structure Shift → Failed Price Swing → Mitigation Block Candle → Retracement → Entry → Liquidity Target
For bearish setup–
Bearish Context → Short-term Low → Rally → Low Broken → Last Down-close Candle → Retracement → Sell → Sell-side Liquidity
For bullish setup–
Bullish Context → Short-term High → Decline → High Broken → Last Up-close Candle → Retracement → Buy → Buy-side Liquidity
Do not chase the Market Structure Shift.
Find the failed swing.
Mark the mitigation candle.
Wait for price to return.
Then trade with the ICT price narrative.