The ICT Open Float concept is a higher timeframe liquidity framework taught by Michael J. Huddleston, the founder of ICT (Inner Circle Trader). This concept is taught in ICT Mentorship Core Content – Month 5 and explains how traders can study standing buy and sell interest above and below current market price to determine which side of liquidity price may be seeking.
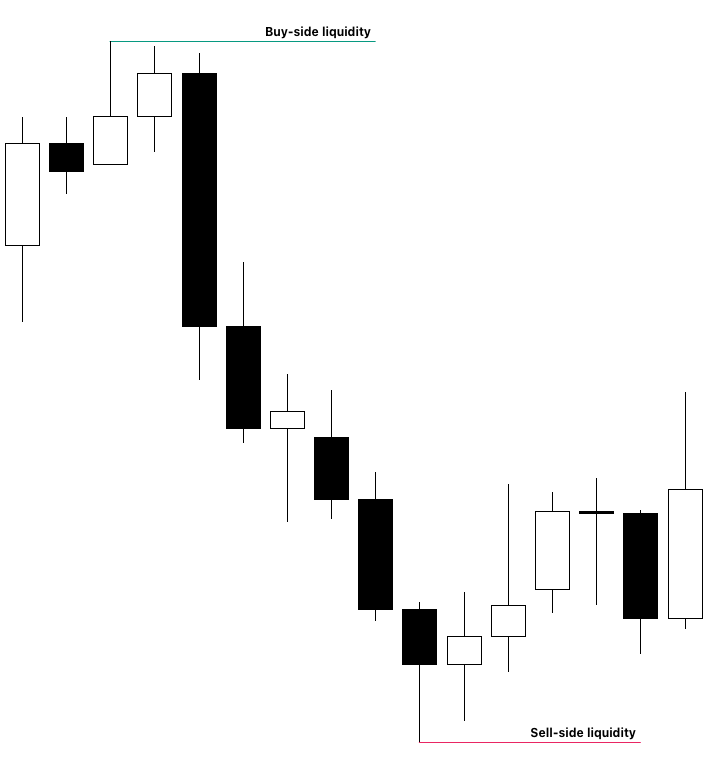
Many traders can identify buy-side liquidity above an old high and sell-side liquidity below an old low.
The difficult question is different.
Which side will price target next?
Will price run the buy stops above the market?
Or will price move lower and attack the sell stops below old lows?
The ICT Open Float concept is designed to provide a framework for answering this question.
Michael J. Huddleston explains:
“Open float is the current open interest above and below current market price.”
The trader studies where orders may be building, how price reacts after each liquidity run, and whether price is gaining new ground on the upside or downside.
This creates a Daily directional bias and helps the trader anticipate the next major draw on liquidity.
What is the ICT Open Float Concept?
The ICT Open Float concept studies open buying and selling interest resting above and below current market price.
This open interest may come from traders already positioned in the market.
It may also come from traders waiting to enter if price reaches a specific level.
According to the ICT framework, Open Float can include:
- Buy stops used to enter long positions
- Buy stops protecting short positions
- Sell stops used to enter short positions
- Sell stops protecting long positions
All of these standing orders create potential liquidity.
Orders above current market price form part of the buy-side Open Float.
Orders below current market price form part of the sell-side Open Float.
The trader studies price action to determine which pool is more likely to be attacked.
Understanding Buy-Side Open Float
Buy-side Open Float refers to pending buying interest above current market price.
Some of these buy orders are protective stop losses.
Suppose a fund is holding a short position.
To protect the position, it may use a buy stop above an important price high.
If price reaches the stop, the short position is closed by buying at the market.
Other buy stops may belong to breakout traders.
These traders may want to buy only after price moves above an old high.
Therefore, buy-side Open Float can accumulate above important highs.
ICT gives attention to buy stops above:
- The last bearish Market Structure Shift
- Short-term highs
- Weekly highs
- Monthly highs
- The highest high of the last three months
- The current six-month high
- The current 12-month high
These levels can become important draws on liquidity.
Understanding Sell-Side Open Float
Sell-side Open Float refers to standing selling interest below current market price.
Suppose a trader or large fund is holding a long position.
The protective stop loss may be placed below an important low.
That protective order is a sell stop.
Other traders may place sell-stop entry orders below old lows because they expect a bearish breakdown.
These orders create selling interest below price.
ICT studies sell stops below:
- The last bullish Market Structure Shift
- Short-term lows
- Weekly lows
- Monthly lows
- The lowest low of the last three months
- The current six-month low
- The current 12-month low
These lower liquidity pools can become important objectives when price begins showing bearish delivery.
Why the Three-Month High and Low Are Important
The ICT Open Float concept is closely connected with Quarterly Shifts.
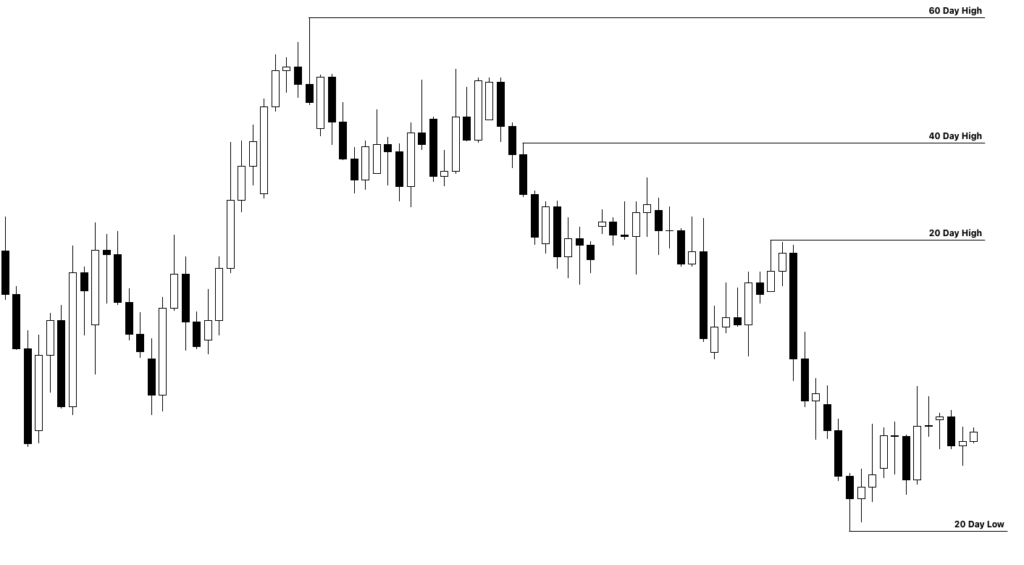
ICT teaches traders to pay particular attention to the highest high and lowest low of approximately the previous three months.
Three months create a quarterly price reference.
Above the three-month high, buy stops may be present.
Below the three-month low, sell stops may be present.
If Market Structure Shifts bullishly, the buy stops above the three-month high can become a logical objective.
If Market Structure Shifts bearishly, the sell stops below the three-month low may become a logical objective.
The concept can be simplified as:
Bullish Market Structure Shift
Then:
Identify buy-side Open Float
Then:
Study the three-month high
Then:
Anticipate a run on buy stops
The bearish model is:
Bearish Market Structure Shift
Then:
Identify sell-side Open Float
Then:
Study the three-month low
Then:
Anticipate a run on sell stops
The Quarterly Shift provides context for the larger liquidity run.
Six-Month and 12-Month Open Float
ICT also studies six-month and 12-month highs and lows.
A common misunderstanding is assuming that a 12-month high must be far away because it took 12 months to form.
That is not necessarily true.
Current price may already be trading close to the 12-month high.
Price may remain near that high for several weeks or months.
Therefore, a 12-month liquidity reference can still become a short-term objective.
The same applies to a six-month high or low.
The importance of the level depends on where current price is relative to it.
A trader should identify:
Current three-month high and low
Current six-month high and low
Current 12-month high and low
Then study which side of the market is receiving stronger price delivery.
Open Float is Relative to the Timeframe
Open Float can become confusing because liquidity is relative to the timeframe being studied.
A 15-minute chart may show buy-side liquidity above a short-term intraday high.
The Daily Chart may simultaneously show a much larger pool of sell-side liquidity below a six-month low.
Both liquidity pools exist.
The question is which one matters for the trading model.
A short-term rally may take the intraday buy stops before the Daily Chart continues moving lower toward larger sell-side liquidity.
This is why ICT places importance on higher timeframe analysis.
The Daily Chart can provide the main directional bias.
Lower timeframe liquidity can then be interpreted inside that larger narrative.
Market Structure Shift and Open Float
Market Structure Shift is an important part of the ICT Open Float concept.
Suppose price has been trading lower.
A short-term low is violated and the bearish move continues.
The trader should identify the significant high from which the bearish move originated.
Why?
Above that high may be a large pool of buy-side Open Float.
Funds that were short from the high may have protective buy stops above it.
If price later creates a bullish Market Structure Shift, the market may begin moving toward that higher liquidity pool.
The sequence becomes:
Bearish price delivery
Then:
Important high forms
Then:
Large decline
Then:
Bullish Market Structure Shift
Then:
Price begins reaching toward the old high
Then:
Buy-side Open Float is targeted
The Market Structure Shift gives the trader a reason to study the opposite side of the marketplace.
Why Large Fund Liquidity Matters
ICT emphasizes that major Daily liquidity runs are not primarily about one small retail trader’s stop loss.
Large funds can hold positions for long periods.
Trend-following funds may remain in positions through large price swings.
Their protective stop orders can remain above or below significant Daily highs and lows.
These larger positions may provide substantial liquidity.
Therefore, a Daily high created before a multi-month decline can remain relevant.
A Daily low created before a major rally can also remain important.
The market may later return to these price levels and attack the standing orders around them.
The larger the price swing from the reference point, the more attention ICT gives to the possible fund-level liquidity around that extreme.
How Price Moves Toward Buy-Side Open Float
Suppose price forms a significant low.
The market then creates a bullish Market Structure Shift.
The trader identifies several short-term highs above current price.
A larger three-month high is also present.
Price begins moving higher.
The first short-term high is violated.
Buy stops above the high are taken.
Does price reverse lower?
Not necessarily.
The trader asks:
Did price make meaningful progress higher?
If price continues expanding and attacks another high, the market may still be working toward larger buy-side Open Float.
The sequence can look like:
Short-term high one taken
Then:
Price retraces
Then:
Short-term high two taken
Then:
Another retracement
Then:
Three-month high targeted
The smaller buy-side liquidity pools may act as stages in a larger bullish price delivery.
Taking Buy Stops Does Not Always Mean Sell
This is one of the most important lessons of the ICT Open Float concept.
A trader may learn Turtle Soup and assume that every move above an old high should be sold.
That is incorrect.
Price may move above a short-term high because it is progressing toward a larger buy-side liquidity objective.
Suppose price runs above an old high.
The trader should ask:
Did price gain meaningful new ground?
Is price creating higher intermediate-term highs?
Are pullbacks failing to take meaningful sell-side liquidity?
Is there a larger buy-side Open Float objective above price?
If price repeatedly creates new highs and lower liquidity remains protected, the market may still be seeking higher Open Float.
Selling every old-high violation would place the trader against the larger liquidity delivery.
How to Know When a Buy-Side Liquidity Run May Reverse
The Open Float concept provides clues that a buy-side liquidity raid may be completing.
Suppose price has rallied for several months.
During the rally, sell-side liquidity has remained largely protected.
Price finally reaches a major three-month or six-month high.
Buy stops above the high are taken.
Price strongly rejects the level.
A short-term low is then violated.
This is important.
The buy-side objective has been reached.
Now price is beginning to attack sell stops below short-term lows.
The first meaningful run on sell-side liquidity becomes a clue that the market may be changing which side of the Open Float it wants to seek.
The sequence is:
Long bullish price delivery
Then:
Major buy-side Open Float targeted
Then:
Strong rejection
Then:
Short-term low violated
Then:
Sell-side liquidity taken
This does not automatically guarantee a long-term bearish market.
But the trader should begin monitoring whether price is gaining more ground on the downside.
The Tug of War Between Buy Stops and Sell Stops
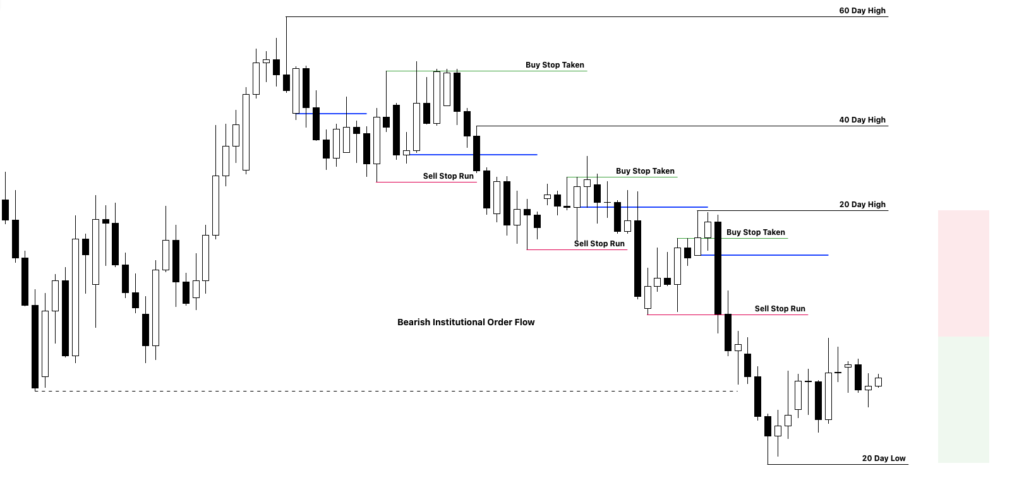
ICT describes Open Float analysis as studying the tug of war between liquidity above and below the marketplace.
Price may take a short-term high.
Then price may take a short-term low.
The trader watches which side produces greater progress.
For example:
Price runs a short-term high by a small amount.
The market rejects immediately.
Price then trades below a previous low and creates a significantly lower low.
Later, price rallies above another short-term high.
Again, the move fails to make meaningful progress.
Price then moves lower and breaks another low.
This behavior reveals an imbalance.
The market can easily create new lower ground.
It cannot create meaningful higher ground.
The sell-side Open Float is becoming the more probable draw.
Gaining New Ground is the Main Clue
A very important part of ICT Open Float analysis is studying whether price is gaining new ground.
Suppose price is bearish.
Every decline moves farther below the previous low.
Price keeps attacking sell-side liquidity and expanding lower.
Every rally takes only a minor short-term high.
The rally cannot challenge the previous important intermediate-term high.
This suggests distribution.
The market is not gaining new ground on the upside.
It is gaining new ground on the downside.
ICT interprets this as evidence that price is seeking sell-side Open Float.
The opposite condition supports bullishness.
Suppose each rally creates meaningful new highs.
Every decline only moves slightly below insignificant short-term lows and quickly rejects.
The market is gaining ground higher.
It is failing to make meaningful bearish progress.
This can suggest that buy-side Open Float remains the draw.
Bearish Open Float Price Delivery
A bearish Open Float condition may show the following characteristics:
- Major buy-side liquidity has already been taken
- Strong rejection appears from the higher level
- Short-term lows begin to break
- Each lower move gains more downside distance
- Intermediate-term highs form progressively lower
- Rallies fail to create meaningful new highs
- Minor old highs may be briefly swept and rejected
- Sell-side liquidity remains below price
The trader should not view every short-term rally as bullish.
A small run above an old high may simply take buy stops before the next bearish expansion.
The important information is that price continues creating new lower ground.
Bullish Open Float Price Delivery
The bullish condition is the opposite.
Price may show:
- Major sell-side liquidity has already been taken
- Strong rejection develops from the lower price
- Short-term highs begin to break
- Each bullish expansion gains greater upside distance
- Intermediate-term lows form progressively higher
- Declines fail to create meaningful new lows
- Minor old lows may be briefly swept and rejected
- Buy-side liquidity remains above the market
The trader focuses on the market’s willingness to create new higher ground.
Sell-side sweeps may only provide buying opportunities inside the larger bullish Open Float delivery.
Intermediate-Term Highs and Open Float
ICT uses intermediate-term highs to read the developing market structure.
An intermediate-term high can be understood as a high with a short-term high to its left and another short-term high to its right.
When successive intermediate-term highs become lower, the market is showing bearish structure.
Suppose price creates a major high.
Later, another intermediate-term high forms below it.
Another high forms even lower.
At the same time, short-term and intermediate-term lows keep moving lower.
This is a strong clue that price is seeking sell-side Open Float.
The lower highs show that rallies are being distributed.
The lower lows show that bearish price delivery is gaining ground.
Intermediate-Term Lows and Open Float
The opposite process can be studied with intermediate-term lows.
An intermediate-term low has a short-term low on the left and another short-term low on the right.
If intermediate-term lows continue forming higher, the market is showing bullish structure.
At the same time, highs may continue being violated.
Each rally creates new upside progress.
The market is showing willingness to attack liquidity above price.
This can support the expectation that buy-side Open Float remains the main objective.
Open Float and Daily Directional Bias
One of the main benefits of the ICT Open Float concept is Daily directional bias.
The trader studies which side of liquidity price is attacking more efficiently.
If price repeatedly violates lows and gains downside ground, while rallies fail to create new meaningful highs, the Daily bias may be bearish.
If price repeatedly violates highs and gains upside ground, while declines fail to make meaningful new lows, the Daily bias may be bullish.
Michael J. Huddleston explains:
“You’re watching for the tug of war that takes place between each new run on stops below the market and above the market.”
This observation can help answer the common question:
Will price run the buy stops or the sell stops next?
The answer is developed by studying price delivery, not by guessing.
Open Float and Quarterly Shifts
Open Float works closely with ICT Quarterly Shift analysis.
Approximately every three to four months, the market may experience a change in condition.
This may be a reversal, correction, or consolidation.
The trader studies where major Open Float exists around the quarterly range.
Suppose the market has moved higher for several months.
The three-month high contains buy-side liquidity.
Price reaches the high and takes the buy stops.
A bearish Market Structure Shift then appears.
Price begins violating short-term lows.
The trader may anticipate that the new Quarterly Shift will seek sell-side Open Float.
The same process works in reverse.
After a multi-month decline, price may attack the three-month low.
Sell-side liquidity is taken.
A bullish Market Structure Shift forms.
The market may then begin working toward buy-side Open Float.
Open Float and Turtle Soup
The ICT Open Float concept also helps answer an important Turtle Soup question.
How do you know whether price will move slightly above an old high and reverse or continue higher?
The answer begins with observing which side of Open Float price has been seeking.
Suppose price has already completed a long bullish move.
A major buy-side liquidity objective is reached.
Price rejects.
Short-term lows begin breaking.
Rallies fail to create new higher ground.
Now price trades slightly above a minor old high.
The move is immediately rejected.
This short-term buy-side raid may have a higher probability of becoming a Turtle Soup Sell.
Why?
The larger buy-side Open Float has already been attacked.
Current price delivery is gaining ground lower.
The minor old-high violation is not creating real bullish progress.
It may simply be another opportunity to collect buy stops before moving lower.
The bullish Turtle Soup model works in reverse.
Open Float and Liquidity Voids
Liquidity voids can provide additional price objectives inside an Open Float framework.
Suppose price has begun seeking sell-side Open Float.
A liquidity void remains below current market price.
Short-term lows are being violated.
Rallies fail to create higher highs.
The liquidity void may become an additional bearish objective.
Price can move lower to rebalance the range while also progressing toward a larger sell-side liquidity pool.
In a bullish condition, a liquidity void above price may provide an upside objective.
The Open Float tells the trader which side of the market is attracting price.
The liquidity void provides another institutional reference inside that directional delivery.
Open Float and Fair Value Gaps
Fair Value Gaps can also be combined with Open Float.
Suppose the Daily Chart is bearish.
Price has already taken major buy-side liquidity.
Sell-side Open Float remains below.
A bearish Fair Value Gap is present above current price.
Price retraces into the imbalance.
The rally does not create meaningful new higher ground.
The market rejects and moves lower.
The trader can interpret the Fair Value Gap as a retracement area inside the larger sell-side Open Float narrative.
The bullish model is reversed.
A bullish Fair Value Gap may provide support while price continues working toward buy-side Open Float.
Open Float and Order Blocks
Order blocks help refine the price area from which the Open Float objective may be attacked.
Suppose price is seeking buy-side liquidity.
A bullish order block exists below current price.
Price retraces into the order block.
The lower price is rejected.
Short-term highs begin breaking.
The bullish order block may provide an entry area aligned with buy-side Open Float.
In a bearish setup, price may retrace into a bearish order block.
If rallies continue failing to create new ground and lower liquidity remains the draw, the order block may provide a selling area.
Open Float tells you where price may be going.
The order block can help identify where the trade may begin.
Open Float and Institutional Sponsorship
Institutional Sponsorship can help confirm the Open Float narrative.
Suppose sell-side liquidity has been taken.
The market shows a bullish Market Structure Shift.
Buy-side Open Float exists above.
Price retraces into a bullish order block.
A strong bullish reaction occurs.
The immediate dynamic response suggests sponsorship.
Price then attacks the next short-term high.
The market continues gaining new upside ground.
This supports the idea that buy-side Open Float remains the objective.
If price becomes lethargic and fails to create higher highs, the bullish narrative may need to be reconsidered.
Open Float should be combined with price response.
How to Identify Which Open Float Price Wants
A practical process can be followed.
Step 1. Start With the Daily Chart
Open Float is especially useful for higher timeframe directional analysis.
Step 2. Mark Major Liquidity Above Price
Identify:
- Short-term highs
- Weekly highs
- Monthly highs
- Three-month high
- Six-month high
- 12-month high
Step 3. Mark Major Liquidity Below Price
Identify:
- Short-term lows
- Weekly lows
- Monthly lows
- Three-month low
- Six-month low
- 12-month low
Step 4. Identify the Recent Market Structure Shift
Has price shifted bullishly or bearishly?
Step 5. Study Which Side Was Already Taken
Has major buy-side liquidity already been cleared?
Has major sell-side liquidity already been taken?
Step 6. Compare Each New Stop Run
When price takes a high, does it gain meaningful new ground?
When price takes a low, does it create a meaningful lower low?
Step 7. Study Intermediate-Term Structure
Are intermediate-term highs getting lower?
Or are intermediate-term lows getting higher?
Step 8. Determine the Dominant Side
Repeated downside expansion with failed rallies suggests sell-side Open Float.
Repeated upside expansion with failed declines suggests buy-side Open Float.
Step 9. Identify the Larger Liquidity Objective
Mark the three-month, six-month, or 12-month high or low that may become the ultimate draw.
Step 10. Use Lower Timeframes for Execution
Once the Daily directional bias is defined, use your ICT setup model to enter.
A Simple Bearish Open Float Model
Suppose price has rallied for approximately six months.
A major old high exists above the market.
Price reaches the high and takes buy-side liquidity.
The market strongly rejects.
A short-term low is violated.
Another rally develops.
Price trades slightly above a minor short-term high.
But the rally cannot reach the previous major high.
Price rejects again.
A new lower low forms.
Another rally takes minor buy-side liquidity.
Again, no meaningful new high develops.
Price moves lower and attacks another low.
The trader can now see:
Major buy-side liquidity already taken
Rallies fail to gain new ground
Intermediate-term highs are declining
Each bearish move gains downside distance
Sell-side liquidity remains below
The Daily Open Float narrative is bearish.
The trader should focus on sell-side objectives.
A Simple Bullish Open Float Model
Suppose price has declined for several months.
A major old low exists below the market.
Price trades below the low and takes sell-side liquidity.
Strong bullish rejection appears.
A short-term high is violated.
Price retraces lower.
A minor old low is taken.
But price cannot create a meaningful new lower low.
The market rejects and rallies.
A new higher high forms.
Another pullback takes a small amount of sell-side liquidity.
Again, price quickly rejects.
The market attacks another high.
The trader sees:
Major sell-side liquidity already taken
Declines fail to gain new ground
Intermediate-term lows are rising
Bullish moves gain upside distance
Buy-side Open Float remains above
The Daily Open Float narrative is bullish.
The trader can focus on higher liquidity objectives.
Common Mistakes With the ICT Open Float Concept
The first mistake is assuming every old high must reverse price.
An old high can be one stage on the way to a larger buy-side Open Float objective.
The second mistake is assuming every old low is a buying opportunity.
Price may continue lower if sell-side Open Float remains the dominant draw.
The third mistake is ignoring the Daily Chart.
Lower timeframe liquidity should be interpreted inside higher timeframe price delivery.
The fourth mistake is looking only at the latest stop run.
Study the sequence of stop runs.
Which side is gaining more ground?
The fifth mistake is ignoring major three-month, six-month, and 12-month highs and lows.
These can contain important fund-level liquidity.
The sixth mistake is confusing a small liquidity raid with genuine directional expansion.
Ask whether price has created new meaningful ground.
The seventh mistake is using Open Float as a direct entry signal.
Open Float provides directional context and liquidity objectives.
A separate ICT entry model can be used for execution.
Final Thoughts
The ICT Open Float concept teaches traders how to study the standing buying and selling interest above and below current market price.
Buy-side Open Float can exist above short-term highs, Weekly highs, Monthly highs, the three-month high, six-month high, and 12-month high.
Sell-side Open Float can exist below short-term lows, Weekly lows, Monthly lows, the three-month low, six-month low, and 12-month low.
However, simply identifying liquidity on both sides is not enough.
The trader must determine which side price is actively seeking.
Study each run on buy stops and sell stops.
Ask whether the move gains new ground.
If price repeatedly violates lows and expands farther lower while rallies fail to create meaningful higher highs, the market may be seeking sell-side Open Float.
If price repeatedly violates highs and expands farther higher while declines fail to create meaningful lower lows, the market may be seeking buy-side Open Float.
Michael J. Huddleston explains the purpose clearly:
“Knowing where orders will be building and stacking above old highs and below old lows, that will give you the framework to map out which side of the marketplace the market makers and smart money are seeking to make a run on.”
This is the real purpose of the ICT Open Float concept.
It gives the trader a framework for Daily directional bias.
It helps distinguish a genuine expansion from a minor stop raid.
It provides context for Turtle Soup setups.
It identifies larger liquidity objectives.
Most importantly, it teaches the trader to stop asking only where liquidity exists.
The better question is:
Which side of the Open Float is price proving that it wants to seek?