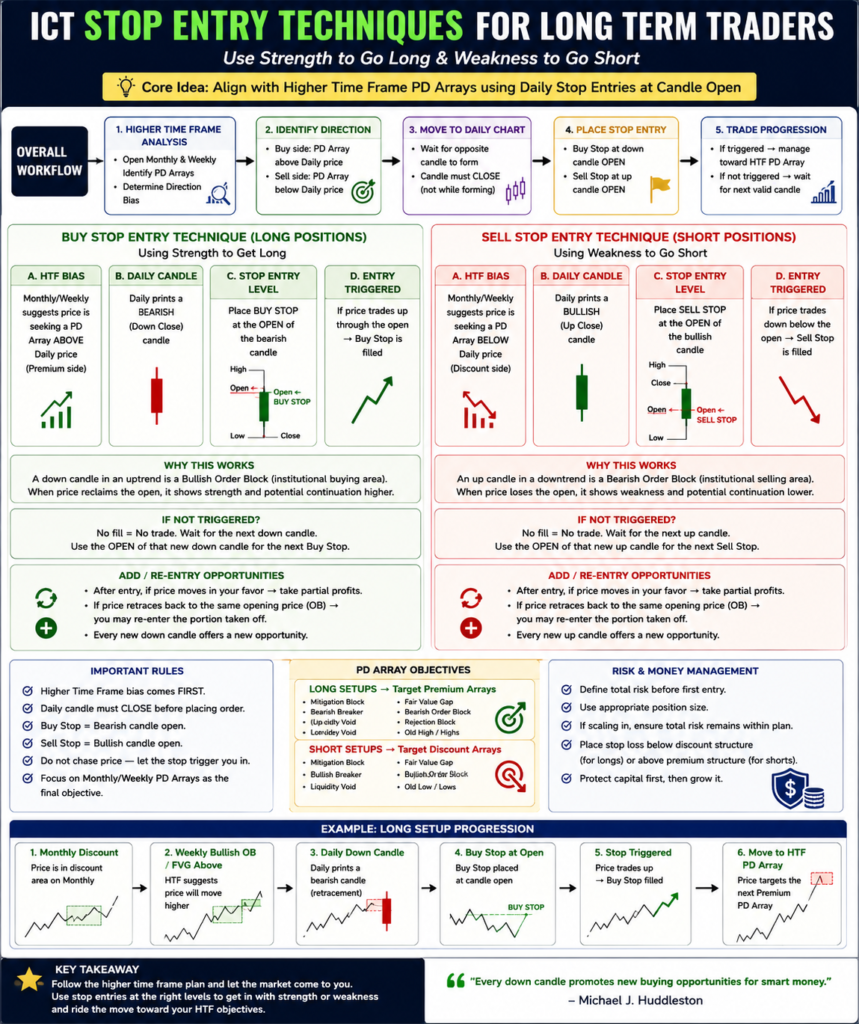
Stop Entry Techniques For Long Term Traders provide an ICT trader with a structured way to enter higher time frame positions by using strength to enter longs and weakness to enter shorts.
This concept is taught by Michael J. Huddleston, founder of ICT (Inner Circle Trader), in the ICT Mentorship Core Content – Month 5.
The technique combines:
Monthly and Weekly PD Arrays for directional bias
↓
Daily candles for entry setup
↓
Buy Stop or Sell Stop at the candle opening price
The trader is not randomly placing stop orders above highs or below lows.
The higher time frame must first suggest that price is being drawn toward a specific Premium or Discount PD Array.
Only then is the Daily chart used to execute the position.
What Is the ICT Stop Entry Technique?
The ICT Stop Entry Technique is a higher time frame execution model designed mainly for long-term and position traders.
The framework is:
Monthly/Weekly narrative
↓
Identify the HTF draw on price
↓
Wait for an opposite Daily candle
↓
Place a stop-entry order at the Daily candle open
For bullish trades:
Wait for a bearish Daily candle → Buy Stop at its opening price
For bearish trades:
Wait for a bullish Daily candle → Sell Stop at its opening price
Michael J. Huddleston explains the bullish concept as:
“The concept is you’re going to be using strength to get you long in the marketplace.”
For bearish setups, the trader uses weakness to enter the short position.
Higher Time Frame Bias Comes First
The Daily candle is not the reason for the trade.
Before using a stop entry, the Monthly or Weekly chart should indicate where price is expected to move.
For a bullish setup, there should preferably be a Premium PD Array above current Daily price.
Possible higher time frame objectives include:
- Mitigation Block
- Bearish Breaker
- Liquidity Void
- Fair Value Gap
- Bearish Order Block
- Rejection Block
- Old High
The idea is:
Monthly or Weekly analysis suggests higher prices
↓
A Premium PD Array is the draw on price
↓
Daily chart is used for execution
For a bearish setup, the Monthly or Weekly chart should suggest lower prices.
A Discount PD Array below current price becomes the objective.
Without the higher time frame narrative, the stop-entry technique becomes nothing more than buying and selling random candles.
Buy Stop Entry Technique for Long Positions
For a bullish long-term trade, the Monthly or Weekly chart should suggest that Institutional Order Flow is seeking a PD Array above Daily market price.
The Daily chart must then form a bearish candle or Down Close candle.
The candle must be completely closed.
ICT specifically warns that the setup is not valid while the Daily candle is still forming.
The process is:
HTF bullish narrative
↓
Premium PD Array above price
↓
Wait for bearish Daily candle to close
↓
Mark the opening price of the bearish candle
↓
Place Buy Stop at the opening price
The Buy Stop is not placed at the candle high.
It is placed at the opening price of the Down Close candle.
If price trades back above the opening price, the Buy Stop is triggered.
The trader is effectively entering when price begins showing strength again.
Why Buy at the Opening of a Down Candle?
The logic connects directly with ICT Order Block Theory.
A Down Close candle can become a Bullish Order Block when price delivers higher from it.
Suppose a bearish Daily candle forms.
The next session begins trading higher.
Price trades through the opening price of the bearish candle.
This suggests that the market may be turning higher again in alignment with the Monthly or Weekly bullish narrative.
The entry model becomes:
Daily retracement against HTF bullish direction
↓
Down Close candle forms
↓
Price recovers the candle open
↓
Buy Stop triggered
↓
Potential bullish continuation
The opening price therefore acts as the entry trigger.
Michael J. Huddleston explains:
“Should price trade back up to that opening price and through it, we should be turning the corner and should be trading higher.”
If price never reaches the candle opening price, the trader does not enter.
What Happens If the Buy Stop Is Not Triggered?
The trader simply waits.
Suppose a bearish Daily candle closes.
You place a Buy Stop at its opening price.
Price continues lower and never trades back to the opening.
The order does not trigger.
If another Down Close Daily candle forms, the trader can move forward to the new candle.
The process becomes:
Bearish Daily Candle 1
↓
Buy Stop at Candle 1 Open
↓
No fill
↓
New bearish Daily Candle 2 forms
↓
Use Candle 2 Open for the new Buy Stop setup
ICT explains:
“If you don’t get a fill, you just got to wait for another new down candle.”
The trader continues following Daily price while the higher time frame bullish narrative remains valid.
Missing an entry is acceptable.
The trader does not chase price.
Every Down Candle Can Promote a New Buying Opportunity
During a long-term bullish move, ICT focuses on Down Close candles.
The reason is that institutional buying may occur during bearish candles inside an uptrend.
The concept is:
Long-term bullish Institutional Order Flow
↓
Temporary Daily decline
↓
Down Close candle
↓
Potential institutional accumulation
↓
Price resumes higher
This means new Down Close candles can provide additional stop-entry opportunities.
However, the trader must remember the higher time frame context.
Michael J. Huddleston states:
“Every down candle promotes new buying opportunity for smart money.”
This principle is applied while price remains aligned with the larger bullish narrative.
It should not be interpreted as buying every bearish candle in every market condition.
Stop Buying Aggressively Near Deep Premium
The Buy Stop Technique becomes less attractive as price reaches deep higher time frame Premium.
Suppose the Monthly range is bullish.
Price starts in Discount and moves through Equilibrium.
Daily Down Close candles can provide buying opportunities during the expansion.
However, price eventually approaches a major Monthly or Weekly Premium PD Array.
The conditions change.
The progression is:
Discount → Strong buying opportunities
↓
Equilibrium → Bullish continuation may remain valid
↓
Approaching deep Premium → Become more cautious
The closer price gets to the higher time frame objective, the less likely every Down Close candle is to produce strong continuation.
ICT recommends buying preferably around Equilibrium or below within the identified higher time frame range.
Sell Stop Entry Technique for Short Positions
The bearish stop-entry technique reverses the bullish model.
The Monthly or Weekly chart should suggest that Institutional Order Flow is seeking a PD Array below Daily market price.
The Daily chart must form a bullish candle or Up Close candle.
The candle must close completely.
The process is:
HTF bearish narrative
↓
Discount PD Array below price
↓
Wait for bullish Daily candle to close
↓
Mark the bullish candle opening price
↓
Place Sell Stop at the opening price
When price trades down through the opening price, the Sell Stop is triggered.
The trader uses weakness to enter the bearish position.
Why Sell at the Opening of an Up Candle?
The opening price of the bullish Daily candle connects with Bearish Order Block Theory.
An Up Close candle before bearish delivery can become a Bearish Order Block.
The setup progression is:
Monthly/Weekly charts suggest lower prices
↓
Daily price temporarily retraces higher
↓
Up Close candle forms
↓
Price trades below the bullish candle open
↓
Sell Stop triggered
↓
Bearish delivery may resume
The bullish Daily candle represents a short-term movement opposite the long-term bearish narrative.
When price breaks back below its opening price, the trader enters with weakness.
Michael J. Huddleston explains:
“We’re waiting for a move that’s opposite the direction by having an up candle or a bullish candle.”
The trader waits for the short-term bullish retracement and then looks for the bearish stop-entry trigger.
Buy Stop and Sell Stop Rules
The rules can be simplified as follows.
Bullish Stop Entry
Monthly/Weekly bias = Bullish
HTF Premium PD Array = Above price
Daily candle required = Bearish / Down Close
Entry order = Buy Stop
Entry price = Bearish Daily candle open
Bearish Stop Entry
Monthly/Weekly bias = Bearish
HTF Discount PD Array = Below price
Daily candle required = Bullish / Up Close
Entry order = Sell Stop
Entry price = Bullish Daily candle open
The Daily candle must be closed before the setup is considered valid.
Stop Entry Technique and Order Block Theory
One advantage of this method is that the stop-entry technique naturally aligns with ICT Order Block Theory.
For a bullish setup:
Down Close candle
↓
Buy Stop at candle open
↓
Bullish expansion
↓
The same candle may later act as a Bullish Order Block
For a bearish setup:
Up Close candle
↓
Sell Stop at candle open
↓
Bearish expansion
↓
The same candle may later act as a Bearish Order Block
The initial stop-entry price can therefore become important again during a future retracement.
Re-Entering at the Same Opening Price
Suppose a trader enters long using a Buy Stop at the opening of a bearish Daily candle.
The trade moves several hundred pips into profit.
The trader takes partial profits.
Later, price retraces back toward the original candle opening.
That same opening price may provide another buying opportunity.
The progression becomes:
Initial Buy Stop entry
↓
Price expands higher
↓
Take partial profit
↓
Price retraces to original Down Close candle open
↓
Bullish Order Block revisited
↓
Re-enter the position
ICT discusses the possibility of putting the portion previously removed back into the market.
This can allow the trader to maintain a similar average entry price while banking profits during the larger move.
The same logic applies to bearish positions.
Building a Position With Multiple Daily Setups
Long-term trends can produce several stop-entry opportunities.
Suppose the Monthly and Weekly narrative remains bullish.
During the move, several bearish Daily candles form.
Each valid Down Close candle can create a potential Buy Stop setup.
The sequence may look like:
Down Candle 1 → Buy Stop triggered
↓
Bullish expansion
↓
Down Candle 2 → New Buy Stop opportunity
↓
Bullish expansion
↓
Down Candle 3 → Another Buy Stop opportunity
This allows the long-term trader to build a position gradually.
ICT also discusses beginning with a smaller allocation.
For example:
Initial position = Half normal position size
The trader may then add exposure as additional valid setups form.
This approach can provide more flexibility than entering the entire planned position at one price.
Do Not Confuse Scaling With Overleveraging
The ability to add positions does not mean a trader should ignore risk.
The higher time frame position still requires proper Money Management.
Before the first entry, define:
- Maximum account risk
- Total planned trade exposure
- Position size
- Stop-loss location
- Number of potential additions
Suppose the trader’s total maximum risk is 1%.
That does not mean every stop entry should risk 1%.
If multiple positions are planned, the total exposure should remain inside the trader’s maximum risk framework.
For example:
Entry 1 risk = 0.25%
Entry 2 risk = 0.25%
Entry 3 risk = 0.25%
Entry 4 risk = 0.25%
Total maximum exposure = 1%
The exact allocation model may differ, but the principle remains:
Build the position without losing control of total risk.
Example of a Bullish Stop Entry
Suppose GBP/USD is in Monthly Discount.
The Weekly chart shows a bullish Institutional Order Flow narrative.
A Weekly Fair Value Gap above Daily price is the expected draw.
The Daily chart forms a bearish candle.
Assume:
Daily bearish candle open = 1.2500
The trader places:
Buy Stop = 1.2500
Price continues lower.
The Buy Stop remains unfilled.
The next Daily candle is also bearish and opens at 1.2470.
The trader may now use the new Down Close candle’s opening price as the next stop-entry reference.
Later, price trades higher through 1.2470.
The Buy Stop triggers.
The setup becomes:
HTF Premium objective above
↓
Daily retracement
↓
Down Close candle
↓
Opening price recovered
↓
Long entry
↓
Monitor price toward HTF PD Array
The stop-entry technique confirms strength before placing the trader into the long position.
Example of a Bearish Stop Entry
Suppose USD/JPY is trading near higher time frame Premium.
Monthly and Weekly analysis suggest price is seeking lower Discount PD Arrays.
The Daily chart forms an Up Close candle.
Assume:
Bullish Daily candle open = 150.50
The trader places:
Sell Stop = 150.50
Price trades below 150.50.
The order triggers.
The sequence becomes:
HTF bearish draw below price
↓
Short-term Daily bullish retracement
↓
Up Close candle forms
↓
Price loses bullish candle opening
↓
Sell Stop triggered
↓
Bearish price delivery resumes
The trader uses Daily weakness to enter in alignment with the Monthly and Weekly bearish narrative.
How to Use Stop Entry Techniques For Long Term Traders
A practical ICT workflow is:
Step 1: Open the Monthly chart
Determine the larger market condition.
↓
Step 2: Map Monthly PD Arrays
Identify the expected higher time frame price objective.
↓
Step 3: Open the Weekly chart
Confirm Institutional Order Flow and refine the PD Array draw.
↓
Step 4: Determine direction
Premium objective above price → Look for longs.
Discount objective below price → Look for shorts.
↓
Step 5: Move to the Daily chart
Wait for a candle opposite the expected direction.
↓
Step 6: Allow the Daily candle to close
Do not use a candle that is still forming.
↓
Step 7: Mark the candle open
Bearish candle open for Buy Stops.
Bullish candle open for Sell Stops.
↓
Step 8: Place the stop-entry order
Buy Stop for bullish conditions.
Sell Stop for bearish conditions.
↓
Step 9: If no fill occurs, wait
Use the next valid opposite Daily candle.
↓
Step 10: Manage the position toward the HTF PD Array
Consider partial profits and logical re-entry opportunities.
Final Thoughts
Stop Entry Techniques For Long Term Traders provide ICT traders with a systematic method for executing higher time frame trade ideas from the Daily chart.
The higher time frame narrative always comes first.
Monthly and Weekly charts define the draw on price.
The Daily chart provides the entry mechanism.
For bullish conditions:
HTF Premium objective → Down Close Daily candle → Buy Stop at candle open
For bearish conditions:
HTF Discount objective → Up Close Daily candle → Sell Stop at candle open
The trader is using strength to enter long positions and weakness to enter short positions.
If the order is not triggered, there is no need to chase the market.
Wait for the next valid Daily candle.
As price progresses toward the Monthly or Weekly PD Array objective, new Daily candles may create additional entry or re-entry opportunities.
The simplicity of the model comes from combining higher time frame context with a precise Daily execution rule.
That is the practical purpose of Stop Entry Techniques For Long Term Traders in ICT trading.