Using 10 Year Notes In HTF Analysis is an important intermarket concept in the ICT (Inner Circle Trader) methodology developed by Michael J. Huddleston. This concept is taught in ICT Mentorship Core Content – Month 5 and explains how 10-Year Treasury Note price action can provide higher-timeframe context for the U.S. Dollar Index and foreign currency markets.
The main idea is to study the relationship between Treasury Note prices, Treasury yields and the Dollar Index. This can help traders understand whether the market is more likely to develop a long-term directional trend or remain inside a larger consolidation.
Why ICT Studies the 10-Year Treasury Note
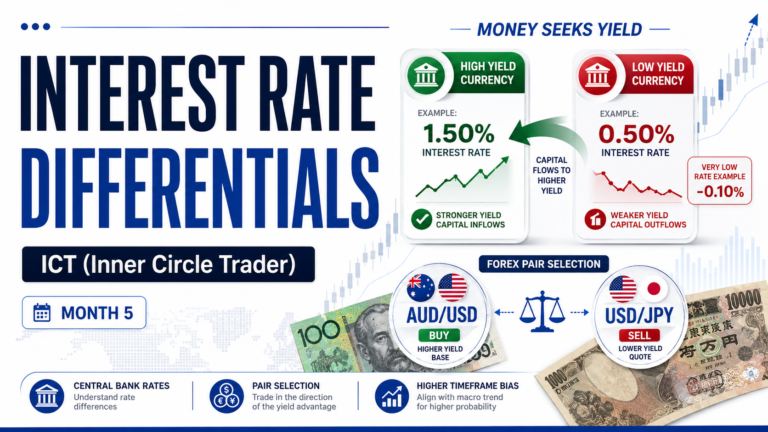
Long-term investment funds generally seek yield.
Money tends to move toward markets and assets where investors expect a more attractive return.
Because interest rates influence the attractiveness of dollar-based assets, ICT studies the 10-Year Treasury Note as part of higher-timeframe currency analysis.
Michael J. Huddleston explains:
“As a general rule of thumb, long-term funds seek yield.”
Therefore, changes in Treasury prices and yields can provide important clues about long-term institutional capital flow.
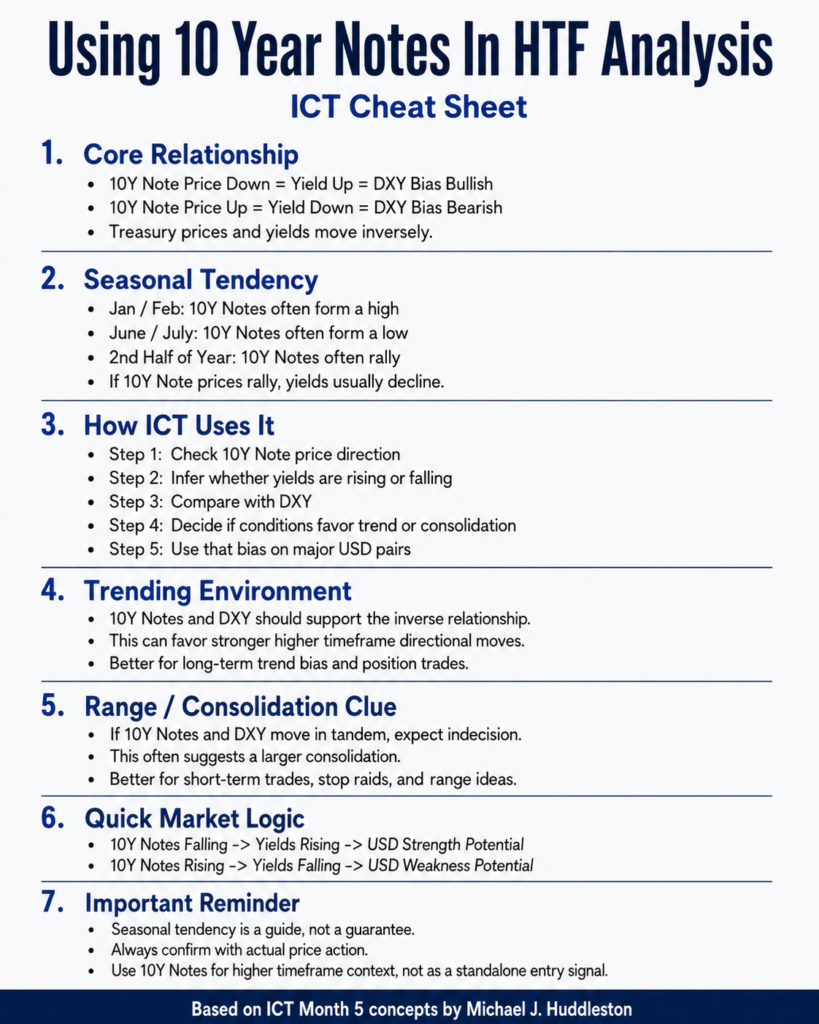
Treasury Note Price and Yield Relationship
The first thing traders must understand is that Treasury Note prices and Treasury yields move inversely.
Treasury Note Price Falls → Yield Rises
Treasury Note Price Rises → Yield Falls
For example, when the 10-Year Treasury Note futures contract moves lower, the yield generally moves higher.
When Treasury Note prices rally, yields generally decline.
This relationship is extremely important when applying Using 10 Year Notes In HTF Analysis.
10-Year Yield and the Dollar Index
In ICT analysis, rising yields can create a more supportive environment for the U.S. Dollar.
10-Year Note Price Falls → Yield Rises → Dollar May Find Support
When yields decline, the Dollar Index may have a more favorable environment for weakness.
10-Year Note Price Rises → Yield Falls → Dollar May Weaken
Michael J. Huddleston explains:
“The dollar has its easiest or most opportune time to decline when yields decrease.”
This does not mean the Dollar Index must immediately move in the expected direction every time yields change.
The relationship is used to build higher-timeframe market context.
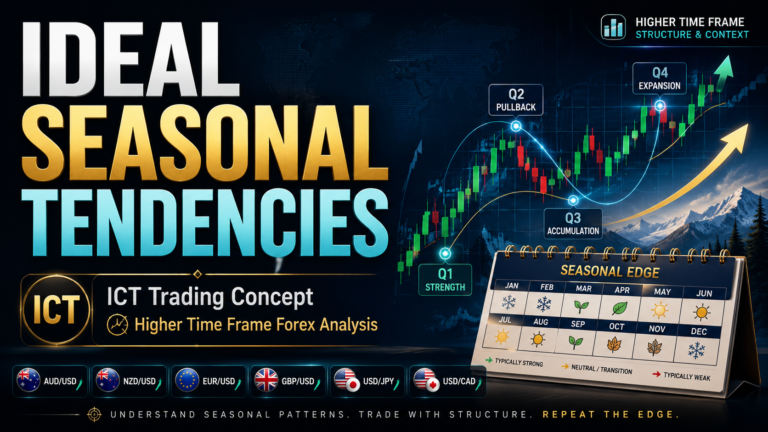
Seasonal Tendency of the 10-Year Treasury Note
ICT also studies the seasonal tendency of the 10-Year Treasury Note.
According to Michael’s teaching, two major seasonal phases can commonly be observed.
First Half of the Year
The 10-Year Treasury Note may form a significant high around January or February.
From there, Treasury Note prices may decline toward the middle of the year.
January/February High → Treasury Note Decline → June/July Low
Because Treasury Note prices are declining, yields may be rising during this phase.
Second Half of the Year
Around late May, June or early July, the 10-Year Treasury Note may form a seasonal low.
Treasury prices may then rally during the second half of the year.
June/July Low → Treasury Note Rally → Higher Prices Toward Year-End
When Treasury prices rally, yields are generally declining.
This can create a bearish higher-timeframe influence for the Dollar Index.
Seasonal Relationship Between 10-Year Notes and DXY
The seasonal tendencies of Treasury Notes and the Dollar Index can provide a broader intermarket framework.
When 10-Year Treasury Note prices rally:
Treasury Prices Higher → Yields Lower → Potential Dollar Weakness
When 10-Year Treasury Note prices decline:
Treasury Prices Lower → Yields Higher → Potential Dollar Strength
The trader should compare the actual price action of the 10-Year Treasury Note and Dollar Index.
The relationship between these markets can help identify whether a directional higher-timeframe trend is likely.
How to Identify a Trending Environment
A stronger directional condition may develop when Treasury price action and Dollar Index price action support the expected inverse relationship.
For example:
10-Year Treasury Notes Declining → Yields Rising → Dollar Index Trending Higher
Or:
10-Year Treasury Notes Rallying → Yields Declining → Dollar Index Trending Lower
When this relationship is clearly visible, the market may provide a better environment for long-term directional price delivery.
Michael J. Huddleston states:
“That’s where the large funds place their money.”
These conditions may support trends lasting several weeks or even months.
How to Identify a Large Consolidation
One of the most useful ideas in Using 10 Year Notes In HTF Analysis is identifying when the Dollar Index and Treasury Notes are moving in tandem.
Suppose Treasury Note prices are rallying.
Normally, declining yields may create bearish pressure on the Dollar Index.
But the Dollar Index is also rallying.
10-Year Notes Higher + Dollar Index Higher → Intermarket Conflict
According to ICT, this can indicate long-term indecisiveness.
The likelihood of a clean directional trend may decrease.
The market may instead develop a larger consolidation.
In these conditions, traders can focus more on:
- Previous highs
- Previous lows
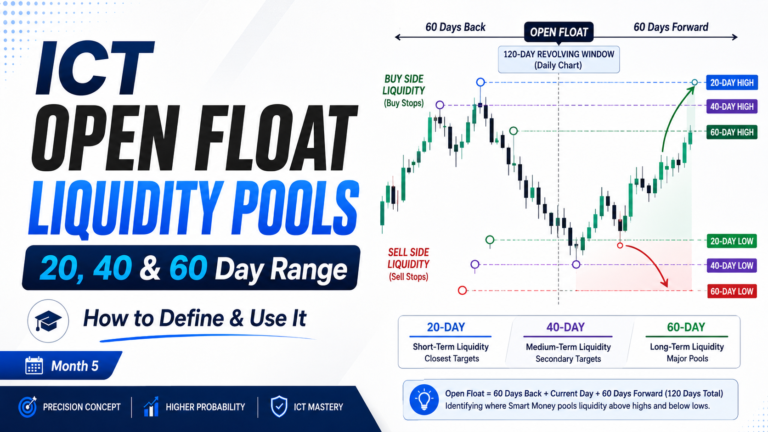
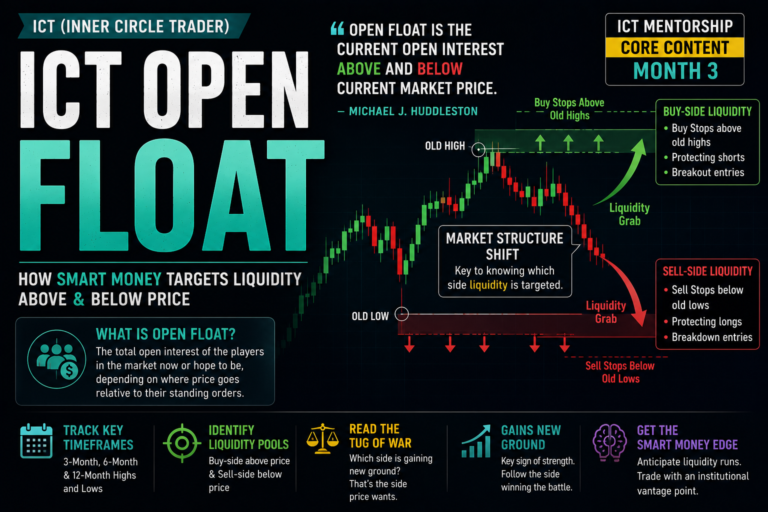
- Buy-side liquidity
- Sell-side liquidity
- Stop raids
- Returns toward the middle of the range
Price may raid one side of the range and then return toward equilibrium instead of continuing in a long-term trend.
Effect on Foreign Currency Pairs
The Dollar Index has an important influence on major foreign currencies.
If DXY and the Treasury market suggest a large consolidation, major currency pairs may also become range-bound.
This may affect pairs such as:
- EUR/USD
- GBP/USD
- Other major USD currency pairs
In a consolidating higher-timeframe environment, long-term position trades may become less attractive.
Short-term trades and day trades may provide better opportunities.
HTF Consolidation → Focus on Short-Term Moves and Liquidity Raids
When the Treasury and Dollar relationship supports a strong directional environment:
HTF Directional Condition → Focus on Long-Term Trend Opportunities
This helps traders select a trading style that matches the broader market condition.
How to Use 10-Year Notes in HTF Analysis
Start by studying the 10-Year Treasury Note futures chart.
Determine whether Treasury prices are:
- Trending higher
- Trending lower
- Consolidating
Next, remember the inverse yield relationship.
Treasury Price Higher → Yield Lower
Treasury Price Lower → Yield Higher
Now compare this information with the Dollar Index.
Ask:
Is DXY responding in the expected opposite direction?
If Treasury Notes are clearly declining and DXY is trending higher, the markets may support a bullish Dollar environment.
If Treasury Notes are rallying and DXY is trending lower, the markets may support a bearish Dollar environment.
If both markets are moving in the same direction, prepare for possible consolidation.
Practical ICT Analysis Model
A simple higher-timeframe process can be followed.
Step 1 → Study 10-Year Treasury Note price action
Step 2 → Determine whether yields are likely rising or falling
Step 3 → Compare the move with DXY
Step 4 → Check the seasonal tendency
Step 5 → Decide whether the market is trending or consolidating
Step 6 → Apply the condition to major currency pairs
For example:
Treasury Notes Falling → Yields Rising → DXY Bullish → Look for USD Strength
Or:
Treasury Notes Rising → Yields Falling → DXY Bearish → Look for USD Weakness
When the relationship conflicts:
Treasury Notes and DXY Moving Together → Possible Consolidation → Focus on Liquidity Raids
Seasonal Tendency is Not a Guaranteed Signal
A common mistake is assuming that the 10-Year Treasury Note must follow its seasonal tendency every year.
Seasonality provides a tendency, not a guaranteed outcome.
ICT teaches traders to study whether the seasonal move is actually appearing in price action.
If the expected June or July Treasury rally does not develop, traders should not blindly buy Treasury Notes based only on the seasonal chart.
Instead, study the actual market condition and other seasonal reference points.
Seasonality Expected → Confirm with Price Action
Do not force the market to follow the seasonal tendency.
Position Trading vs Day Trading
The 10-Year Treasury Note relationship can also help determine which type of trading may be more favorable.
Trending Treasury and Dollar Environment
When the intermarket relationship supports a directional trend:
Better Condition → Long-Term Position Trading
The market may provide sustained directional moves lasting several weeks or months.
Conflicting or Consolidating Environment
When Treasury Notes and the Dollar move in tandem:
Better Condition → Short-Term Trading and Day Trading
Look for shorter price moves, stop raids and liquidity objectives.
This prevents the trader from expecting a long-term trend inside a higher-timeframe range.
Common Mistakes When Using 10-Year Notes
Confusing Treasury price with yield: Treasury Note prices and yields move inversely.
Using seasonal tendency as a guaranteed signal: Price action should confirm the seasonal expectation.
Ignoring the Dollar Index: The purpose is to compare Treasury conditions with DXY.
Expecting a trend during intermarket conflict: Treasury Notes and DXY moving together may indicate consolidation.
Forcing long-term position trades: Range-bound conditions may favor short-term or intraday trading.
Final Thoughts
Using 10 Year Notes In HTF Analysis helps ICT traders understand the relationship between interest rates, institutional capital flow and the U.S. Dollar.
The core relationship is:
Treasury Note Price Falls → Yield Rises → Potential Dollar Strength
Treasury Note Price Rises → Yield Falls → Potential Dollar Weakness
When the 10-Year Treasury Note and Dollar Index support the expected inverse relationship, the market may provide a stronger directional higher-timeframe trend.
When Treasury Notes and DXY move in tandem, it can indicate long-term indecisiveness and a larger consolidation.
By combining 10-Year Treasury Notes, yields, DXY and seasonal tendency, ICT traders can develop a clearer higher-timeframe framework before selecting trades in the foreign exchange market.