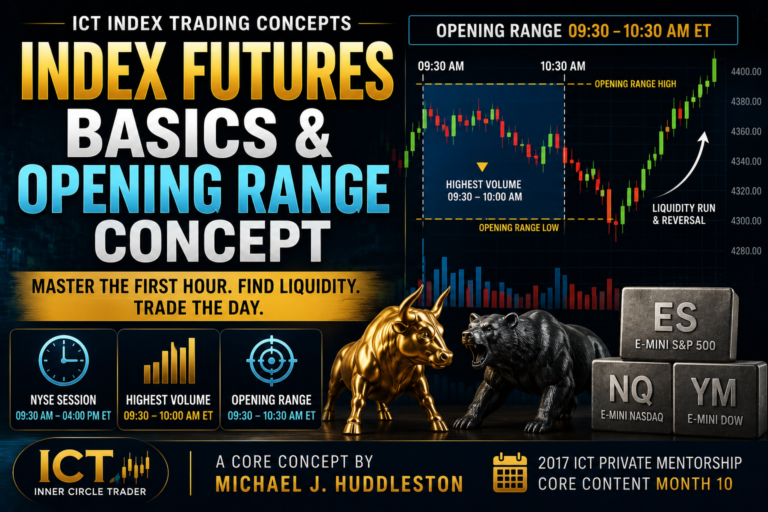
Bond Trading – Basics & Opening Range Concept is an ICT framework for analysing the 30-year US Treasury Bond futures market during the New York session.
This concept was taught by Michael J. Huddleston, the founder of ICT (Inner Circle Trader), in the 2017 ICT Private Mentorship Core Content Month 10.
The method focuses on the bond market’s most active morning period, particularly the price range formed between 08:00 and 09:00 New York time. This opening range can help traders identify the day’s probable high or low, liquidity pools, order blocks and potential stop runs.
Michael J. Huddleston explains the importance of this time window:
“The opening range between 8 A.M. and 9 A.M. tends to create the bond market high or low of the day.”
The concept is simple, but it becomes more powerful when combined with ICT liquidity, volume divergence, fair value gaps and institutional order flow.
What Is the Treasury Bond Futures Market?
When ICT refers to the Treasury Bond market in this lesson, he is specifically discussing the 30-year US Treasury Bond futures contract.
The trading symbol is:
ZB
The contract trades on the Chicago Board of Trade.
The main delivery months are:
- March
- June
- September
- December
Each delivery month has a letter code:
- March: H
- June: M
- September: U
- December: Z
A complete futures symbol combines:
- The instrument symbol
- The delivery month code
- The final two digits of the year
For example:
ZBU17
This represents the September 2017 30-year Treasury Bond futures contract.
Bond Market Trading Session
The primary New York trading session discussed in the ICT bond trading framework runs from:
08:20 to 15:00 New York time
However, ICT treats the broader bond trading day as:
08:00 to 15:00 New York time
The highest volume commonly appears during the morning, especially between:
08:00 and 09:30 New York time
The opening range itself is defined using the price action between:
08:00 and 09:00 New York time
This one-hour period becomes the foundation for intraday bond analysis.
Treasury Bond Tick Value
Bond futures are quoted differently from forex or stock indices.
The minimum price fluctuation is one tick.
For the 30-year Treasury Bond futures contract:
- One tick is worth $31.25 per contract
- Thirty-two ticks equal one full point
- One full point is often called a full handle
- A full 32-tick move equals $1,000 per contract
A trader does not need to capture a full handle every day.
ICT explains that the bond market often has a relatively modest daily range.
A realistic intraday objective may be:
- Five ticks
- Eight ticks
- Sixteen ticks
A sixteen-tick move equals half a point, which is approximately:
$500 per contract
The focus should be on repeatable, well-framed opportunities rather than expecting a large move every session.
What Is the Bond Opening Range?
The Bond Opening Range Concept refers to the high and low formed between 08:00 and 09:00 New York time.
The trader marks:
- Opening Range High
- Opening Range Low
- Important candle bodies
- Significant candle wicks
- Nearby previous highs and lows
- Order blocks formed inside the range
This area often becomes a reference point for the remainder of the session.
Price may:
- Run above the Opening Range High
- Run below the Opening Range Low
- Reverse from an order block inside the range
- Return to the range after an expansion
- Build liquidity above or below the range
- Use the range as support or resistance
The opening range is not simply a box placed on the chart. It represents a period of concentrated institutional activity.
Why the 08:00–09:00 Range Matters
The bond market receives significant participation during the New York morning.
This includes:
- US institutional traders
- London traders still active
- European traders
- Commercial hedgers
- Large speculators
- Interest-rate traders
The Chicago futures opening around 08:20 New York time can bring an additional increase in activity.
This is why ICT prefers to see many setups form around or after 08:20.
Signals can appear as early as 08:00, but the preferred area is generally:
08:00 to 08:30 New York time
This time-based focus helps traders avoid analysing every candle with equal importance.
Opening Range High and Low
The first step is to identify the highest and lowest price traded between 08:00 and 09:00.
These levels may later act as:
- Buy-side liquidity
- Sell-side liquidity
- Reversal points
- Breakout levels
- Stop-run objectives
- Intraday support
- Intraday resistance
The high and low should not always be defined using only candle bodies.
ICT also considers:
- Candle wicks inside the opening range
- Equal highs or lows near the range
- Important highs or lows immediately before 08:00
- Nearby liquidity pools to the left of the range
This is similar to how the Asian range may be framed in forex analysis.
Opening Range Stop Runs
One of the most common patterns is a run above or below the opening range followed by a reversal.
Sell-Side Stop Run
Price trades below the Opening Range Low.
This movement may trigger:
- Stops below the range
- Stops below short-term lows
- Stops from traders who entered long too early
If the move below the range occurs without strong selling pressure, it may be a liquidity raid rather than a genuine bearish expansion.
Price can then reverse and trade higher.
Buy-Side Stop Run
Price trades above the Opening Range High.
This may trigger:
- Stops above the range
- Stops above equal highs
- Buy orders from breakout traders
If the rally lacks supporting volume or institutional sponsorship, price may reverse lower after collecting the liquidity.
The opening range therefore provides clear reference points for identifying intraday stop raids.
Volume Divergence in Bond Trading
Unlike the decentralised forex market, futures provide real exchange-traded volume.
This gives bond traders a more accurate view of buying and selling activity.
ICT uses volume divergence to evaluate whether a new price high or low is supported by genuine participation.
Bullish Volume Divergence
Bullish volume divergence occurs when:
- Price makes a lower low
- Volume is lower than it was on the previous low
- The lower low occurs below the Opening Range Low
- Selling pressure fails to increase
A genuine bearish continuation would normally be expected to attract stronger volume.
When price makes a lower low on weaker volume, the decline may only be running sell stops.
This can signal that the bearish move is weakening.
Bearish Volume Divergence
Bearish volume divergence occurs when:
- Price makes a higher high
- Volume is lower than it was on the previous high
- The high forms above the Opening Range High
- Buying pressure fails to increase
A genuine bullish continuation should normally be supported by expanding volume.
If the new high forms on weaker volume, the rally may be running buy stops rather than beginning a sustained expansion.
Michael J. Huddleston states:
“Volume precedes price.”
The volume profile can therefore reveal weakness before the price reversal becomes obvious.
Bullish Opening Range Setup
A bullish bond setup may develop through the following sequence:
- Price forms the 08:00–09:00 opening range.
- A bullish order block forms inside the range.
- Price trades below the Opening Range Low.
- Sell-side liquidity is taken.
- The lower low forms on reduced volume.
- Price returns into the opening range.
- The bullish order block supports price.
- Price expands toward the Opening Range High or external buy-side liquidity.
This setup combines:
- Time
- Liquidity
- Volume divergence
- Order blocks
- Institutional order flow
The lower low is not automatically bullish. The trader must observe whether volume and price action confirm that the decline lacks genuine selling pressure.
Bearish Opening Range Setup
A bearish setup may develop in the opposite manner:
- Price forms the opening range.
- A bearish order block forms inside or near the range.
- Price trades above the Opening Range High.
- Buy-side liquidity is taken.
- The higher high forms on reduced volume.
- Price fails to continue higher.
- Price returns below the Opening Range High.
- The market trades toward the Opening Range Low or lower sell-side liquidity.
The weak-volume high suggests that price may have moved above the range only to collect stops.
Using Order Blocks Inside the Opening Range
Order blocks formed between 08:00 and 09:00 may become important reference points later in the session.
A bullish order block may be identified as the final down-close candle before a bullish expansion.
A bearish order block may be identified as the final up-close candle before a bearish expansion.
Price can revisit these candles after leaving the opening range.
A bullish setup may involve:
- Price returning to a down-close candle
- The candle sitting near the Opening Range Low
- Sell-side liquidity already taken
- Volume confirming reduced selling pressure
A bearish setup may involve:
- Price returning to an up-close candle
- The candle sitting near the Opening Range High
- Buy-side liquidity already taken
- Volume confirming reduced buying pressure
The opening range adds time-based significance to the order block.
Fair Value Gaps and Liquidity Voids
The bond market respects the same ICT price-delivery concepts used in forex.
These include:
- Fair value gaps
- Liquidity voids
- Order blocks
- Equilibrium
- Premium and discount
- Turtle Soup setups
- Buy-side liquidity
- Sell-side liquidity
An opening range stop run may deliver price into a fair value gap or order block.
Price may then reverse and seek an opposing liquidity pool.
For example:
- Price trades below the Opening Range Low.
- It enters a bullish fair value gap.
- Volume declines on the lower low.
- Price displaces higher.
- The Opening Range High becomes the target.
The opening range does not replace ICT concepts. It provides the session framework in which those concepts are applied.
Returning to the Opening Range
Price may leave the opening range and later return to it.
The range can then act as:
- Support
- Resistance
- Equilibrium
- A consolidation area
- A re-entry location
A common pattern is:
- Price expands above the range.
- Volume fails to confirm the higher high.
- Price returns inside the range.
- The market consolidates or trades toward the opposite side.
Another possibility is:
- Price runs below the range.
- Reverses higher.
- Returns to the Opening Range High.
- Uses the range high as support.
- Continues toward external liquidity.
The range remains relevant even after the initial breakout.
Bond Market Liquidity Pools
Liquidity commonly forms around:
- Opening Range High
- Opening Range Low
- Equal highs
- Equal lows
- Previous session highs
- Previous session lows
- Short-term intraday swings
These levels may become targets for institutional price delivery.
The stock market opening can also interact with liquidity created during the bond opening range.
This is one reason the range can continue influencing price after 09:00 and into the equity market open.
Bonds and Institutional Order Flow
The bond market is highly liquid and closely connected to interest rates.
Its price action can provide valuable information about:
- Interest-rate expectations
- Dollar direction
- Currency strength
- Gold
- Risk sentiment
- Broader institutional positioning
ICT considers the bond market one of the less manipulated major markets.
That does not mean manipulation never occurs.
It means the bond market generally displays fewer extreme or erratic price spikes than some other asset classes.
When the market is trending, it can maintain direction efficiently.
When it is consolidating, it may become choppy and require more selective trading.
When to Avoid Bond Trading
The bond market can become unstable around major economic announcements.
Traders should be cautious around:
- FOMC decisions
- Interest-rate announcements
- Central bank statements
- Non-Farm Payrolls
- Major inflation reports
- Interest-rate-sensitive economic releases
During these events, liquidity may temporarily disappear.
Price can gap or rapidly move toward distant liquidity.
Michael J. Huddleston warns that the safest approach is often to avoid trading before major interest-rate or employment releases.
The bond market may normally be orderly, but major news can significantly change its behaviour.
Reasonable Intraday Expectations
The 30-year Treasury Bond does not always produce a large daily range.
A trader should avoid expecting a full 32-tick move every session.
Practical intraday objectives may include:
- Five ticks
- Eight ticks
- Ten ticks
- Sixteen ticks
A full handle may occur during a strong directional session, but it is not the normal expectation.
Lower expectations can help traders:
- Avoid overtrading
- Secure realistic profits
- Reduce emotional pressure
- Focus on high-quality setups
- Respect the market’s normal range
Capturing a consistent portion of the move is more important than trying to predict the entire daily range.
How to Mark the Opening Range
Use a 15-minute chart and follow this process:
- Set the chart to New York time.
- Locate the candles from 08:00 to 09:00.
- Mark the highest wick during that hour.
- Mark the lowest wick during that hour.
- Note significant candle bodies.
- Identify equal highs or lows near the range.
- Mark bullish and bearish order blocks inside the range.
- Observe volume during the range.
- Compare later highs and lows with the opening-range volume.
- Watch for a liquidity run after 09:00.
The process should be repeated daily to develop familiarity with bond price delivery.
Bond Opening Range Trading Checklist
Before considering a trade, review the following:
- Is the correct ZB contract loaded?
- Is the chart using New York time?
- Has the 08:00–09:00 range been marked?
- Where are the Opening Range High and Low?
- Is there an order block inside the range?
- Are equal highs or lows nearby?
- Has price taken buy-side or sell-side liquidity?
- Did the new high or low form on stronger or weaker volume?
- Is price trading into a fair value gap or liquidity void?
- Is there clear displacement away from the setup?
- What is the opposing liquidity target?
- Is a major economic release scheduled?
A setup becomes stronger when time, price, liquidity and volume support the same narrative.
Common Mistakes
Treating Every Opening Range Break as a Breakout
Price often trades beyond the range to collect stops.
Wait for confirmation before assuming continuation.
Ignoring Volume
A higher high or lower low should be evaluated against the volume that created it.
Weak volume may reveal that the move is unsustainable.
Marking Only Candle Bodies
Wicks and nearby highs or lows may contain important liquidity.
The full context should be considered.
Expecting a Full Handle Every Day
The bond market often produces smaller daily ranges.
Unrealistic targets can cause traders to hold winning trades too long.
Trading During Major News
FOMC, NFP and rate-sensitive releases can make the market temporarily disorderly.
Avoid forcing a setup during unstable conditions.
Ignoring the Contract Month
Futures contracts expire.
Always confirm that the chart is using the correct active delivery contract.
Why Traders Should Study Bonds
A trader does not need to actively trade bond futures to benefit from studying them.
Daily bond analysis can improve understanding of:
- Price action
- Institutional order flow
- Interest rates
- Volume
- Liquidity
- Currency relationships
- Gold and dollar behaviour
The bond market can also be traded across different holding periods.
It may be used for:
- Intraday trading
- Short-term trading
- Swing trading
- Longer-term positioning
Studying bonds can therefore strengthen a trader’s broader macro and technical understanding.
Final Thoughts
Bond Trading – Basics & Opening Range Concept gives ICT traders a structured way to analyse the 30-year Treasury Bond futures market.
The core framework is built around the price range formed from 08:00 to 09:00 New York time.
This range frequently creates or contributes to:
- The high of the day
- The low of the day
- Liquidity pools
- Stop runs
- Order block reactions
- Fair value setups
- Intraday support and resistance
The most effective analysis combines the opening range with real futures volume.
A lower low on weak volume may indicate a sell-side liquidity run.
A higher high on weak volume may indicate a buy-side liquidity run.
By combining time, volume, liquidity and ICT PD Arrays, traders can build a clearer intraday narrative for the bond market.
The central principle is to narrow the focus. Mark the opening range, observe how price trades around its high and low, and use volume to determine whether the move is supported by genuine institutional pressure or merely collecting liquidity.