

The ICT Unicorn Model is a trade execution model built around the overlap of two ICT PD Arrays: a Breaker Block and a Fair Value Gap. These concepts come from the trading methodology taught by Michael J. Huddleston, the founder of ICT, or Inner Circle Trader.
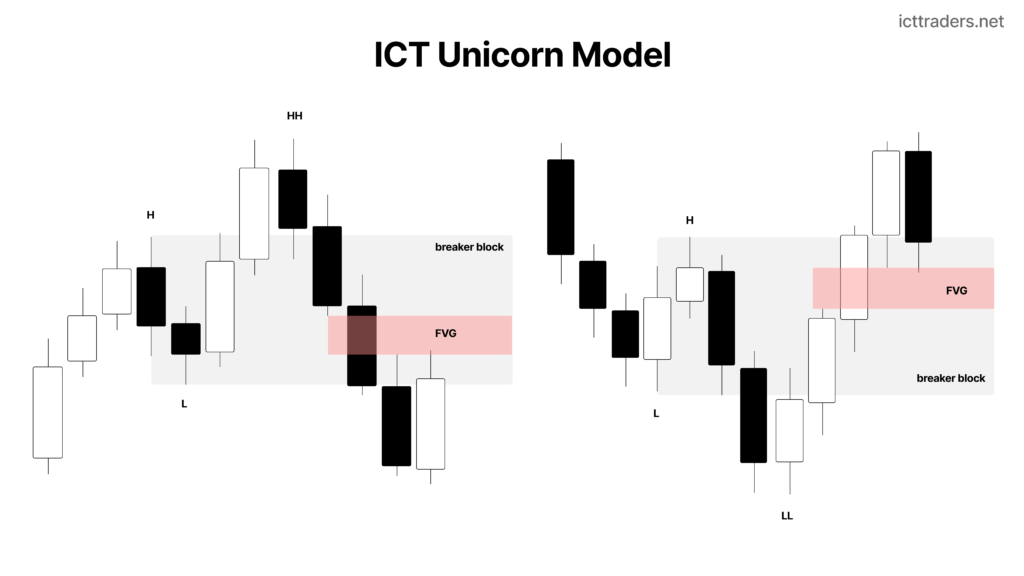
The model usually appears after price takes liquidity and shifts its short-term direction. During that shift, an existing Order Block fails and becomes a Breaker Block, while the displacement move creates a Fair Value Gap. When the Fair Value Gap overlaps the Breaker Block, the shared portion becomes the Unicorn zone.
This overlap gives the trader a more refined entry area. The Breaker Block provides structural importance, while the Fair Value Gap represents inefficient price delivery. Instead of entering from the entire Breaker Block or the entire Fair Value Gap, the trader can focus on the smaller area where both PD Arrays meet.
The Unicorn Model is not a complete trading strategy by itself. It does not establish the daily bias, identify the main liquidity target or tell the trader when market conditions are suitable. It is mainly an execution model used after the directional narrative has already been established.
What Is the ICT Unicorn Model?
The ICT Unicorn Model is the price range where a valid Breaker Block overlaps a Fair Value Gap.
The entire Breaker Block is not automatically the Unicorn zone. The complete Fair Value Gap is not automatically the Unicorn zone either. Only the shared price range between them should be treated as the actual Unicorn entry area.
For example, imagine a bullish Breaker Block covering the price range from 19,980 to 20,000. A bullish Fair Value Gap covers the range from 19,990 to 20,010. The overlap between the two zones is from 19,990 to 20,000.
That smaller overlapping section is the bullish Unicorn zone.
The model combines two different forms of confirmation. The Breaker Block shows that an earlier Order Block failed after price changed direction. The Fair Value Gap shows that the new directional move contained displacement and inefficient price delivery.
When price retraces into the overlap, traders watch for the Breaker Block and Fair Value Gap to support the same directional idea.
The Two Components of the Unicorn Model
A trader cannot identify the Unicorn Model correctly without first understanding the Breaker Block and Fair Value Gap separately.
What Is an ICT Breaker Block?
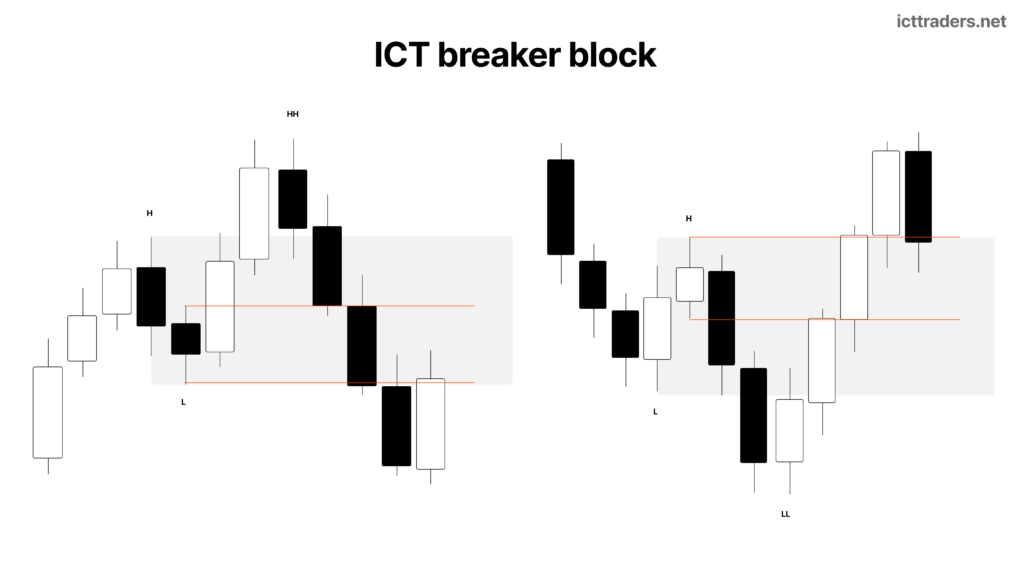
An ICT Breaker Block is a failed Order Block that changes its function after price trades through it.
A bearish Order Block that is broken to the upside can become a bullish Breaker Block. When price later retraces into that area, the former bearish zone may act as support.
A bullish Order Block that is broken to the downside can become a bearish Breaker Block. When price later returns to that area, the former bullish zone may act as resistance.
A proper Breaker Block usually appears after liquidity has been taken and price has shifted its short-term structure. It should not be identified simply because a random candle was broken. The failed Order Block must be connected to a meaningful swing, liquidity event and directional shift.
The easiest way to understand a Breaker Block is to think of it as a failed price level that becomes useful from the opposite side.
In a bullish situation, sellers expected a bearish Order Block to hold. Price instead trades above it, invalidates the bearish idea and later uses that same area as support.
In a bearish situation, buyers expected a bullish Order Block to hold. Price breaks below it, invalidates the bullish idea and later uses the area as resistance.
What Is an ICT Fair Value Gap?
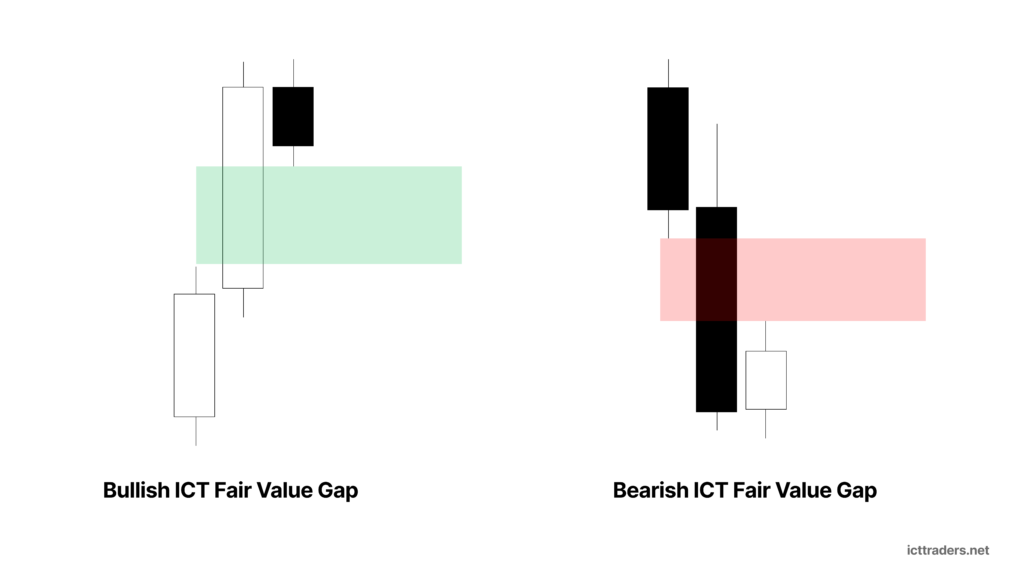
An ICT Fair Value Gap, commonly called an FVG, is a three-candle price imbalance.
A bullish Fair Value Gap forms when the high of the first candle remains below the low of the third candle. The price range between those two wicks was not efficiently traded during the bullish displacement.
A bearish Fair Value Gap forms when the low of the first candle remains above the high of the third candle. This leaves an inefficiently delivered range during bearish displacement.
The second candle is usually the displacement candle. Its strong movement creates separation between the first and third candles.
Price may later return to the Fair Value Gap to rebalance part or all of the inefficient range. However, not every FVG should be traded. Its importance depends on the liquidity event, market structure, directional bias and location within the larger dealing range.
How the Breaker Block and FVG Create the Unicorn Model
The Unicorn Model forms when a displacement move does two things at the same time.
First, it breaks through an earlier Order Block and changes that Order Block into a Breaker Block.
Second, the same displacement creates a Fair Value Gap that overlaps the newly formed Breaker Block.
The Breaker Block and FVG must share the same price range. It is not enough for them to sit close to each other. There must be an actual overlap.
This gives the trader one zone supported by two separate ICT concepts.
The Breaker Block represents a structural shift and failed Order Block.
The Fair Value Gap represents displacement and inefficient price delivery.
The overlapping portion becomes the area where the trader expects price to react during a retracement.
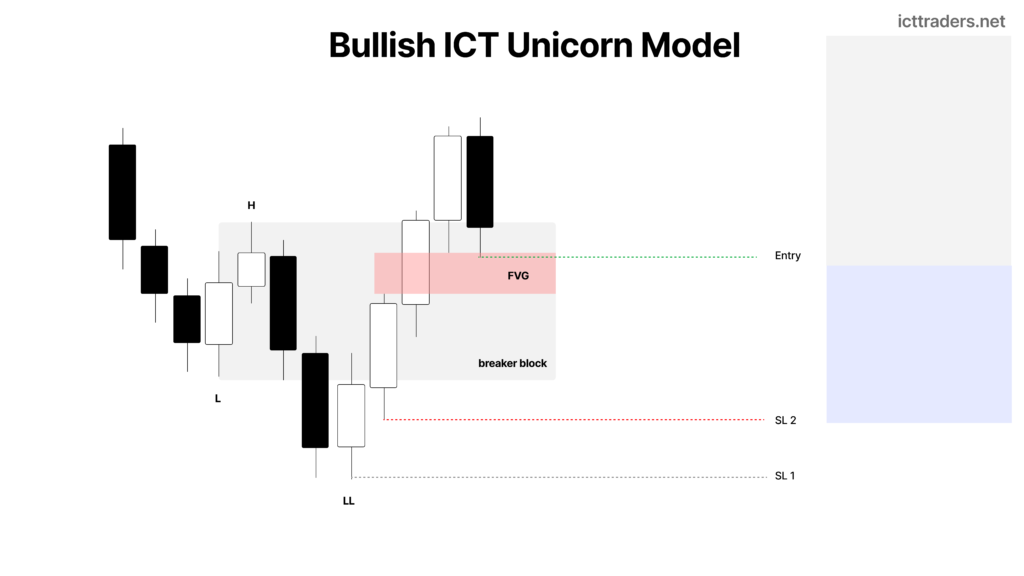
Bullish ICT Unicorn Model
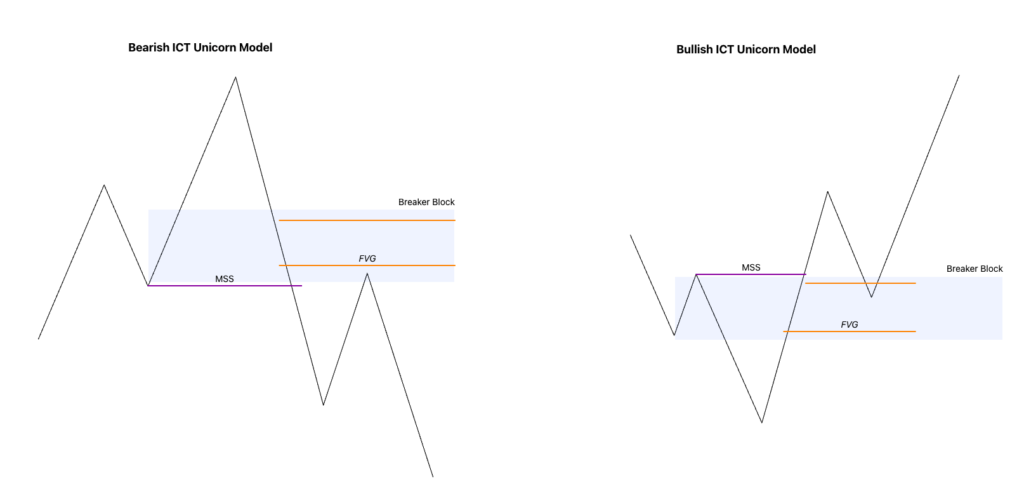
A bullish Unicorn Model normally appears after price has been moving lower or after a short-term bearish phase inside a larger bullish narrative.
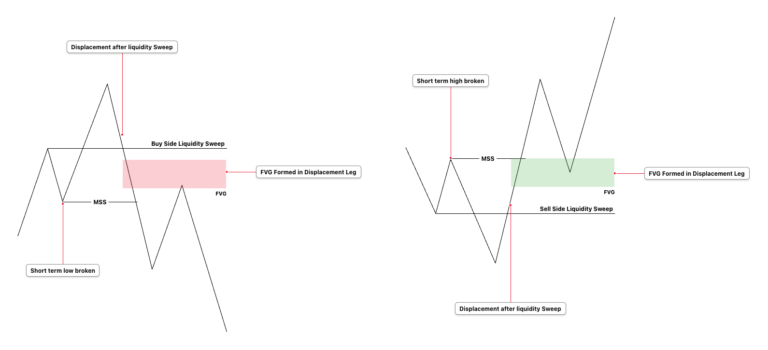
Price first trades below an important low or takes sell-side liquidity. This may involve a previous swing low, equal lows, an Asian session low, a previous day’s low or another visible sell-side liquidity pool.
After taking liquidity, price begins to move higher with displacement. The bullish move breaks above a meaningful short-term swing high, creating a Market Structure Shift.
The move through the swing high also breaks a previous bearish Order Block. Once price closes above that bearish Order Block, it can be treated as a bullish Breaker Block.
If the bullish displacement creates a bullish Fair Value Gap that overlaps the bullish Breaker Block, the shared range becomes a bullish Unicorn zone.
The bullish formation therefore contains several important elements:
- Sell-side liquidity is taken
- Price rejects the lower prices
- Bullish displacement appears
- A meaningful short-term high is broken
- A bearish Order Block fails and becomes a bullish Breaker Block
- A bullish Fair Value Gap overlaps the Breaker Block
- Price retraces into the overlap
The trader looks for a buying opportunity when price returns to the Unicorn zone, provided that the higher-timeframe narrative still supports higher prices.
Bearish ICT Unicorn Model
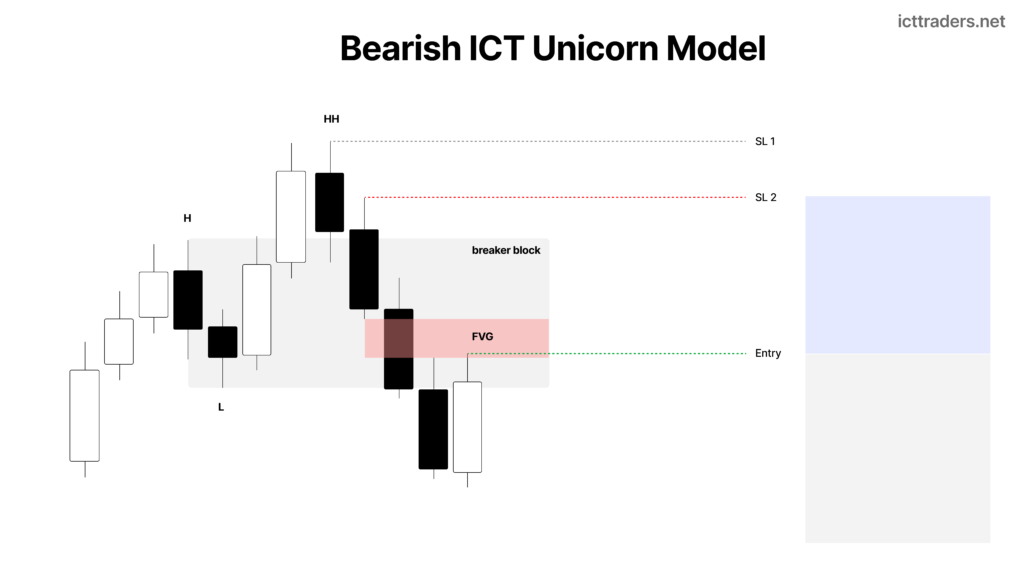
A bearish Unicorn Model is the opposite formation.
It usually appears after price has been moving higher or after a short-term bullish phase inside a larger bearish narrative.
Price first trades above an important high and takes buy-side liquidity. This could be a previous swing high, equal highs, the Asian session high, the previous day’s high or another visible pool of resting liquidity.
After taking that liquidity, price moves lower with strong bearish displacement. The move breaks a meaningful short-term low and confirms a bearish Market Structure Shift.
The bearish displacement breaks through a previous bullish Order Block. Once the bullish Order Block fails, it can become a bearish Breaker Block.
If the displacement also creates a bearish Fair Value Gap that overlaps the bearish Breaker Block, the shared range becomes a bearish Unicorn zone.
A valid bearish formation normally contains:
- Buy-side liquidity is taken
- Price rejects the higher prices
- Bearish displacement appears
- A meaningful short-term low is broken
- A bullish Order Block fails and becomes a bearish Breaker Block
- A bearish Fair Value Gap overlaps the Breaker Block
- Price retraces into the overlap
The trader watches for a selling opportunity when price returns to the Unicorn zone and the larger market narrative continues to support lower prices.
How to Identify the Unicorn Model on a Chart
The easiest way to find a Unicorn Model is to begin with market structure rather than searching for random overlapping rectangles.
Start by identifying the current directional narrative. Determine whether price is expected to seek buy-side liquidity or sell-side liquidity.
Next, wait for price to approach a meaningful higher-timeframe area. This may be a Fair Value Gap, Order Block, Breaker Block, liquidity pool, premium area or discount area.
Watch how price behaves when it reaches that location. A strong Unicorn setup usually begins with a liquidity sweep followed by displacement in the expected direction.
After displacement occurs, mark the short-term swing that was broken. Then identify the Order Block associated with that swing and determine whether it has failed.
Once the Breaker Block has been identified, mark the Fair Value Gap created by the displacement move.
Finally, compare the boundaries of the two zones. If part of the FVG sits inside the Breaker Block, mark only the shared portion as the Unicorn zone.
A simple visual overlap is not enough. The complete sequence should make sense within the market narrative.
How to Draw the ICT Unicorn Model
Begin by drawing the Breaker Block.
For a bullish setup, locate the bearish Order Block that was broken during the bullish displacement. Mark the candle range according to the Breaker Block method you use consistently.
For a bearish setup, locate the bullish Order Block that was broken during bearish displacement and mark its range.
Next, draw the Fair Value Gap created during the same structural shift.
For a bullish FVG, draw the range between the high of the first candle and the low of the third candle.
For a bearish FVG, draw the range between the low of the first candle and the high of the third candle.
The Breaker Block and FVG will often have different upper and lower boundaries. Highlight only the price range present inside both zones.
That shared range is the Unicorn zone.
If the FVG merely touches the Breaker Block but does not meaningfully overlap it, the setup is weak or may not qualify as a proper Unicorn Model. The most useful formations normally show a clear, visible intersection.
Extend the overlap zone to the right so you can monitor the first retracement.
You may also mark the midpoint of the Unicorn zone. This 50 percent level can be used as a refined entry reference, although price does not need to reach the midpoint in every setup.
Why the Overlapping Area Matters
A Fair Value Gap can appear anywhere during displacement. Many FVGs are later ignored or traded through because they are not supported by meaningful market structure.
A Breaker Block can also fail. A broken Order Block does not guarantee that price will react when it returns.
The Unicorn Model filters both concepts by requiring them to exist at the same price.
The Breaker Block gives the zone structural importance. It represents an area where the previous directional expectation failed.
The Fair Value Gap gives the zone evidence of displacement. It shows that price moved away with enough urgency to leave an imbalance.
The overlap therefore creates a more precise area than either PD Array might provide on its own. This is confluence, not certainty. The zone can still fail when the larger narrative is wrong or the market is seeking liquidity in the opposite direction.
How to Trade a Bullish Unicorn Model
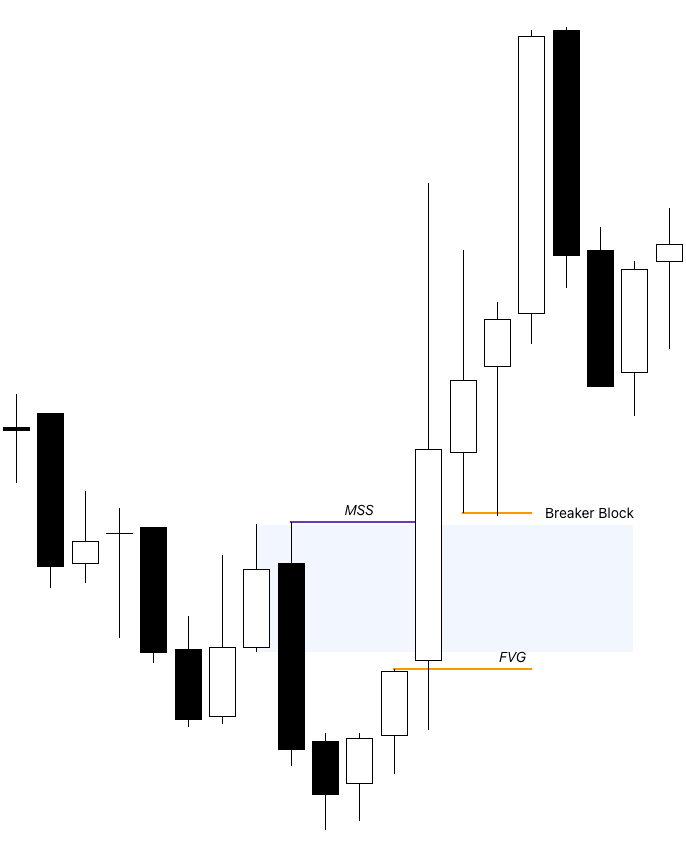
A bullish Unicorn setup should begin with a reason to expect higher prices.
The higher-timeframe chart may show price trading in discount, reacting from a bullish PD Array or targeting buy-side liquidity above the market.
On the execution timeframe, wait for price to take sell-side liquidity. Avoid buying before the liquidity event simply because price has reached a support area.
After the sweep, look for bullish displacement that breaks a meaningful short-term high. The move should be clear and decisive. A minor candle close above an insignificant high does not provide the same confirmation.
Identify the bearish Order Block that failed during the move. Mark it as the bullish Breaker Block.
Then mark the bullish Fair Value Gap created during displacement and isolate the overlapping range.
Do not chase the initial rally. Wait for price to retrace into the bullish Unicorn zone.
An aggressive trader may place a limit order inside the overlap. A more conservative trader may wait for a lower-timeframe reaction before entering.
Useful lower-timeframe confirmation may include a small sell-side liquidity sweep, bullish rejection, bullish Change in State of Delivery, Market Structure Shift or fresh bullish Fair Value Gap.
The stop should be placed below a price level that proves the bullish idea is wrong. This may be below the Breaker Block, below the liquidity-sweep low or below the structural low supporting the setup.
The target should be based on buy-side liquidity. Common objectives include an old high, equal highs, a previous session high, the previous day’s high or a higher-timeframe bearish PD Array above price.
How to Trade a Bearish Unicorn Model
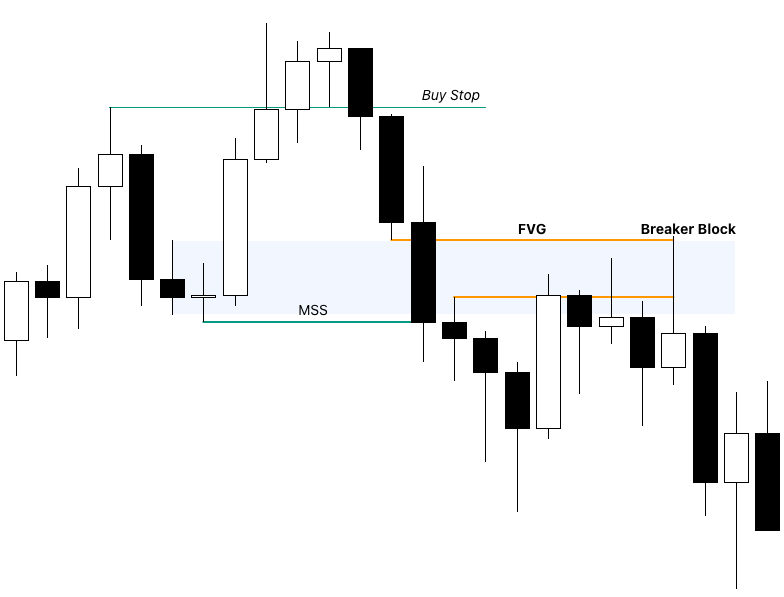
A bearish Unicorn setup begins with a reason to expect lower prices.
The higher-timeframe chart may show price trading in premium, reacting from a bearish PD Array or seeking sell-side liquidity below the market.
Wait for price to take buy-side liquidity on the execution timeframe. This gives the market a reason to reverse rather than continue moving higher.
After the liquidity sweep, look for bearish displacement that breaks a meaningful short-term low.
Identify the bullish Order Block broken by that displacement. Once it fails, mark it as the bearish Breaker Block.
Mark the bearish FVG created during the same move and identify the section that overlaps the Breaker Block.
Allow price to retrace from below into the bearish Unicorn zone.
An aggressive entry may be taken directly from the overlap. A conservative entry waits for lower-timeframe bearish confirmation.
Confirmation can include a buy-side liquidity sweep, bearish rejection, bearish CISD, bearish Market Structure Shift or a new bearish Fair Value Gap.
The stop should be placed above the price level that invalidates the bearish setup. This may be above the Breaker Block, above the liquidity-sweep high or above the structural high responsible for the reversal.
Targets should be selected from sell-side liquidity below price, such as old lows, equal lows, a previous session low, the previous day’s low or a higher-timeframe bullish PD Array.
Aggressive Entry and Confirmation Entry
There are two common ways to execute the Unicorn Model.
An aggressive trader enters when price first trades into the overlapping zone. The entry may be placed at the beginning of the overlap, its midpoint or another refined level inside it.
This approach can provide a small stop and attractive reward relative to risk. However, price may trade deeper through the Breaker Block before reacting.
A confirmation trader waits for price to enter the Unicorn zone and then moves to a lower timeframe.
The trader enters only after price produces a clear reaction, such as a liquidity sweep followed by displacement or a lower-timeframe Market Structure Shift.
This method sacrifices some entry precision, but it helps confirm that the Unicorn zone is actually influencing price.
The correct approach depends on the quality of the setup. Direct entries are more reasonable when the higher-timeframe narrative, liquidity event and displacement are clear. Lower-quality conditions require more confirmation.
Stop-Loss Placement
The stop loss should not be placed at an arbitrary number of points beyond the FVG.
A stop belongs where the original trade idea becomes invalid.
For a bullish Unicorn, the stop may be placed:
- Below the Unicorn overlap
- Below the complete bullish Breaker Block
- Below the low that took sell-side liquidity
- Below the structural low supporting the bullish shift
For a bearish Unicorn, the stop may be placed:
- Above the Unicorn overlap
- Above the complete bearish Breaker Block
- Above the high that took buy-side liquidity
- Above the structural high supporting the bearish shift
Placing the stop just outside the overlap can provide better reward relative to risk, but the position is more vulnerable to normal mitigation.
Placing the stop beyond the complete structural extreme provides more room, but it increases the stop distance.
The trader should choose the stop placement before entering and adjust the position size so that the total risk remains controlled.
Target Selection
The Unicorn Model identifies the entry location. It does not automatically provide the profit target.
Targets should come from liquidity and opposing PD Arrays.
A bullish trade may target:
- Short-term buy-side liquidity
- Equal highs
- A previous swing high
- The London or New York session high
- The previous day’s high
- A bearish higher-timeframe Fair Value Gap
- External range liquidity
A bearish trade may target:
- Short-term sell-side liquidity
- Equal lows
- A previous swing low
- The London or New York session low
- The previous day’s low
- A bullish higher-timeframe Fair Value Gap
- External range liquidity
The first target should be realistic for the timeframe being traded. A one-minute Unicorn setup should not automatically be held for a weekly objective unless the trade is supported by a much larger narrative.
Higher-Timeframe Context
The Unicorn Model becomes more useful when it forms inside or near a higher-timeframe point of interest.
For a bullish setup, price may be reacting from:
- A daily or four-hour discount area
- A bullish Order Block
- A bullish Fair Value Gap
- A higher-timeframe Breaker Block
- Sell-side liquidity below a major low
For a bearish setup, price may be reacting from:
- A daily or four-hour premium area
- A bearish Order Block
- A bearish Fair Value Gap
- A higher-timeframe Breaker Block
- Buy-side liquidity above a major high
A lower-timeframe Unicorn can then be used as an entry model in the direction of the higher-timeframe idea.
This is usually more useful than trading every Unicorn pattern that appears on a chart.
Best Timeframes for the ICT Unicorn Model
The Unicorn Model can appear on any timeframe, but it is commonly used as a lower-timeframe execution model.
The 15-minute and 5-minute charts can provide clear structure without producing too much noise.
The 3-minute and 1-minute charts can offer more refined entries, but they also produce more false structure shifts and insignificant FVGs.
A trader might use the daily, four-hour or one-hour chart to establish direction, then use the 15-minute or 5-minute chart to find the Unicorn setup.
Very low timeframes should be used only when the trader understands the larger price narrative. Otherwise, almost every small movement can look like a liquidity sweep, Breaker Block or Market Structure Shift.
The model is described across trading education sources as an execution setup rather than a replacement for higher-timeframe analysis.
Using the Unicorn Model During Trading Sessions
Time is important because displacement is more likely to occur when the market has sufficient liquidity and participation.
Forex traders commonly watch for setups around the London and New York sessions.
Index futures traders often focus on the New York morning session, especially around the opening range and scheduled economic releases.
A technically correct Unicorn Model that forms during an inactive period may not produce the same expansion as one that forms during an active session.
The trader should also consider whether important news is scheduled. A setup forming immediately before a major release may be traded through before the expected reaction occurs.
Unicorn Model as a Reversal Entry
The Unicorn Model is often used after a liquidity sweep and Market Structure Shift.
In this context, it helps the trader enter a reversal after the market has already provided evidence that the previous direction is weakening.
A bullish reversal model takes sell-side liquidity before shifting higher.
A bearish reversal model takes buy-side liquidity before shifting lower.
The trader is not trying to predict the exact top or bottom. The entry is taken after displacement confirms the change in short-term delivery.
Unicorn Model Inside a Larger Trend
The model can also appear during a continuation move.
Suppose the higher-timeframe trend is bullish, but price enters a short-term bearish retracement. That retracement may take sell-side liquidity before producing a bullish structure shift and Unicorn zone.
On the lower timeframe, the formation looks like a reversal. Within the higher-timeframe chart, however, it is simply an entry back into the main bullish direction.
The same principle applies to bearish continuation setups.
This is one reason higher-timeframe context matters. A lower-timeframe reversal can be a higher-timeframe continuation.
ICT Unicorn Model vs Breaker Block
A Breaker Block can be traded without an overlapping FVG.
However, it is not a Unicorn Model unless a Fair Value Gap overlaps the Breaker.
The Breaker Block may cover a wide price range. When an FVG overlaps only part of that range, the Unicorn provides a smaller and more refined entry area.
Every Unicorn contains a Breaker Block, but not every Breaker Block creates a Unicorn.
ICT Unicorn Model vs Fair Value Gap
A Fair Value Gap can form without breaking an Order Block.
In that situation, the trader only has an imbalance. It may still provide a valid entry, but it does not qualify as a Unicorn Model.
The Unicorn requires the FVG to overlap a Breaker Block created during the relevant structural shift.
Every Unicorn contains an FVG, but most FVGs are not Unicorns.
ICT Unicorn Model vs Inversion Fair Value Gap
An Inversion Fair Value Gap forms when price trades through an FVG and later uses it from the opposite side.
The original FVG changes its function.
A Unicorn Model does not require the Fair Value Gap itself to fail. It requires a normal FVG to overlap a failed Order Block, which is the Breaker Block.
The two concepts may sometimes appear close together, but their formation rules are different.
ICT Unicorn Model vs Balanced Price Range
A Balanced Price Range forms from the overlap of two opposing Fair Value Gaps.
A Unicorn Model forms from the overlap of one Fair Value Gap and one Breaker Block.
The BPR combines two imbalances moving in opposite directions.
The Unicorn combines an imbalance with a structural price block.
What Makes a Strong Unicorn Setup?
A technically valid overlap is not always a good trade.
The stronger setups normally contain several supporting conditions:
- The higher-timeframe bias is clear
- Price is positioned correctly in premium or discount
- A meaningful liquidity pool has been taken
- The structural shift breaks an important swing
- The displacement candle is strong
- The Fair Value Gap is fresh
- The FVG was created during the same move that formed the Breaker Block
- The overlap is clear rather than forced
- The first retracement occurs during an active trading session
- A logical liquidity target remains available
The setup becomes weaker when the trader has to search too hard to make the two zones overlap.
When to Avoid the ICT Unicorn Model
Avoid the setup when the Breaker Block is not connected to a valid liquidity sweep or Market Structure Shift.
Avoid using an old FVG simply because it happens to overlap a recent Breaker Block. The most relevant FVG is generally the one created during the displacement that changed the structure.
Do not trade a bullish Unicorn directly below a major buy-side liquidity target that has already been reached.
Do not trade a bearish Unicorn directly above a major sell-side objective that has already been taken.
Avoid formations created inside tight, directionless consolidation. These areas can produce many small Breaker Blocks and FVGs without meaningful directional intention.
Be careful when price has already returned to the overlap several times. The first clean retracement is generally more useful because the inefficiency is still fresh.
The setup should also be avoided when the stop distance is too large relative to the available target.
Common Mistakes When Trading the Unicorn Model
One common mistake is marking any Order Block and nearby FVG as a Unicorn. The Order Block must first fail and become a Breaker Block.
Another mistake is drawing the entire Breaker Block as the entry zone. The Unicorn is only the portion shared by the Breaker Block and FVG.
Some traders ignore the liquidity sweep. Without liquidity being taken, the structural shift may simply be a temporary retracement.
Another problem is using an insignificant break of structure. The broken swing should be meaningful enough to show a change in short-term price delivery.
Traders also enter before the Unicorn is fully formed. The Breaker Block and FVG must first be confirmed before waiting for the retracement.
Entering during the displacement move is another common error. The model is designed around the return to the overlapping zone, not chasing the initial expansion.
A final mistake is treating the model as guaranteed. The Unicorn provides confluence, but it can still fail when the directional bias or liquidity narrative is wrong.
ICT Unicorn Model Checklist
Before marking a Unicorn Model, confirm the following:
- A meaningful liquidity pool has been taken
- Price has produced clear displacement
- A valid swing high or swing low has been broken
- An earlier Order Block has failed
- The failed Order Block qualifies as a Breaker Block
- A fresh Fair Value Gap formed during the structural shift
- The FVG overlaps the Breaker Block
- The overlapping price range is clearly marked
Before entering a trade, confirm the following:
- The setup agrees with the higher-timeframe narrative
- Price is positioned correctly in premium or discount
- The expected direction has a clear liquidity target
- Price is making its first clean retracement into the zone
- The setup is forming during a suitable trading session
- The invalidation level is clear
- The stop loss is placed outside the normal mitigation area
- The potential reward justifies the risk
- Position size follows the trader’s risk-management rules
Final Thoughts
The ICT Unicorn Model is a refined entry concept based on the overlap between a Breaker Block and a Fair Value Gap.
The Breaker Block shows that an earlier Order Block failed after price took liquidity and changed its short-term structure. The Fair Value Gap shows that the new directional move was delivered with displacement.
Where these two PD Arrays overlap, the trader gets a smaller and more precise area to monitor for entry.
The model should not be used by searching for random overlaps. Start with the higher-timeframe narrative, identify the draw on liquidity, wait for a meaningful sweep and confirm the structural shift.
After those conditions are present, mark the Breaker Block, mark the fresh Fair Value Gap and isolate the shared price range.
A bullish Unicorn Model is used after sell-side liquidity is taken and price shifts higher.
A bearish Unicorn Model is used after buy-side liquidity is taken and price shifts lower.
The Unicorn zone can improve entry precision, but it does not replace proper market analysis or risk management. The quality of the setup still depends on liquidity, time, displacement, market structure and the location where the model forms.


![Change In State Of Delivery [CISD] Concept – Complete ICT Guide](https://icttraders.net/wp-content/uploads/2026/07/Change-In-State-Of-Delivery-CISD-Concept-–-Complete-ICT-Guide-768x432.png "Change In State Of Delivery (CISD) Concept – Complete ICT Guide 10")