
The Weekly Profile for Daily Bias – Classic Expansion is a useful framework for understanding how price may deliver throughout a trading week. The concept is rooted in ICT (Inner Circle Trader) methodology developed by Michael J. Huddleston, where traders study higher-timeframe objectives, liquidity, and price delivery to anticipate directional expansion.
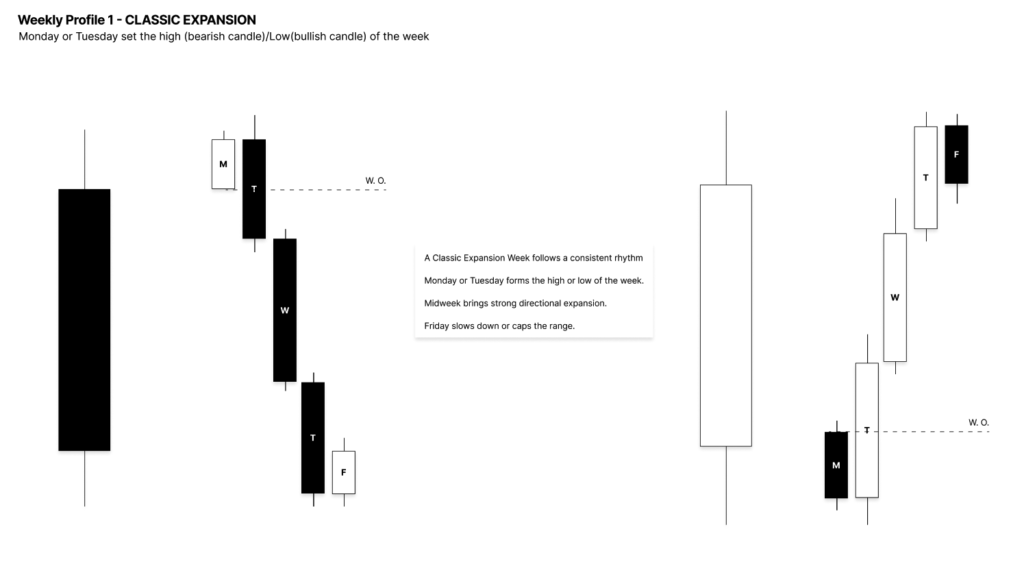
A Classic Expansion week is exactly what the name suggests: a directional weekly candle that expands primarily in one direction.
Instead of trying to predict every daily candle before the week begins, the objective is to identify when the high or low of the week has likely formed. Once that point is confirmed, traders can look for continuation during the following trading days.
What Is the ICT Classic Expansion Weekly Profile?
A Classic Expansion weekly profile occurs when price establishes one side of the weekly range early in the week and then expands directionally toward a higher-timeframe objective.
The basic structure is:
Monday or Tuesday forms the weekly high/low → Price confirms the turning point → Multiple days of directional expansion → Price reaches an objective → Weekly range is capped
In a bullish Classic Expansion:
Monday or Tuesday forms the low of the week → Price expands higher
In a bearish Classic Expansion:
Monday or Tuesday forms the high of the week → Price expands lower
The expansion commonly continues for two or three trading days before price reaches a higher-timeframe objective or completes a significant portion of its expected range.
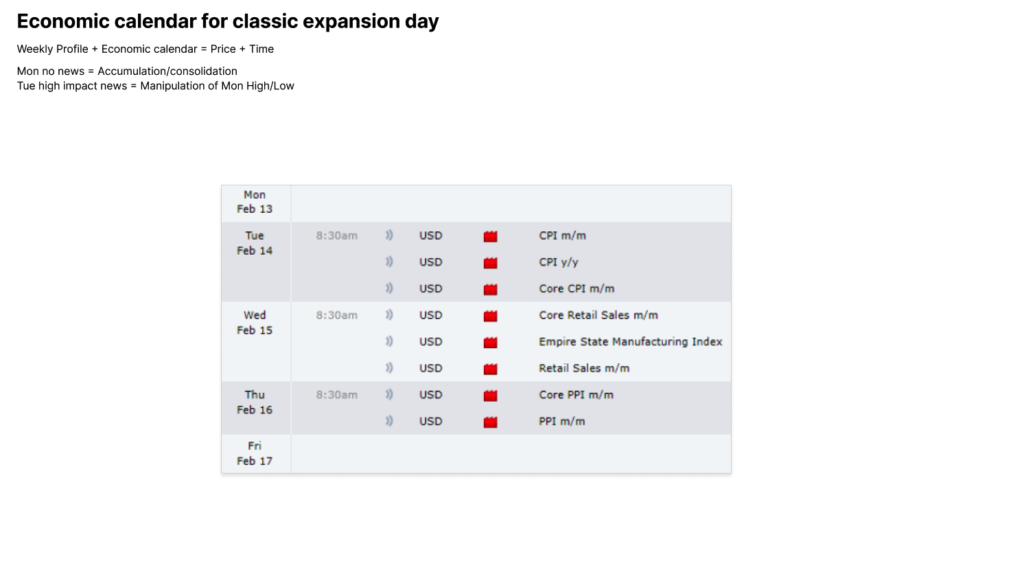
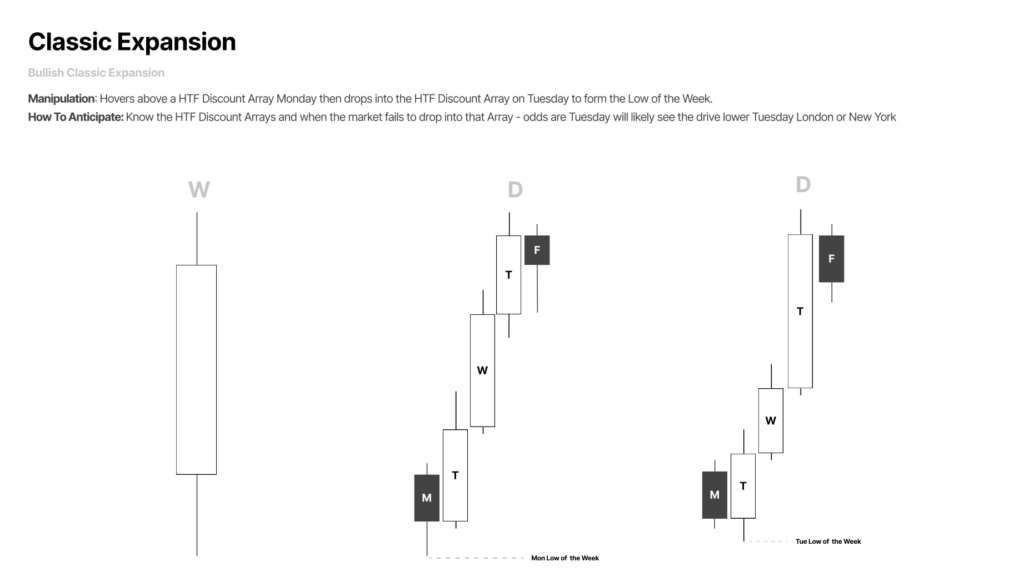
Bullish Classic Expansion Weekly Profile
In a bullish scenario, the trader first needs a bullish higher-timeframe bias.
The weekly structure may look like:
Monday retracement → Tuesday low of the week → Wednesday expansion higher → Thursday continuation → Friday range completion or retracement
Another possible structure is:
Monday low of the week → Tuesday expansion → Wednesday continuation → Thursday/Friday range completion
The important element is not whether the low forms specifically on Monday or Tuesday.
The real objective is to allow the weekly low to form and confirm it before seeking bullish continuation.
For example, Monday may initially move lower against the anticipated bullish weekly direction. This can create the lower wick of the weekly candle.
If Tuesday forms a strong bullish closure and confirms the low, traders can begin anticipating expansion during Wednesday and potentially Thursday.
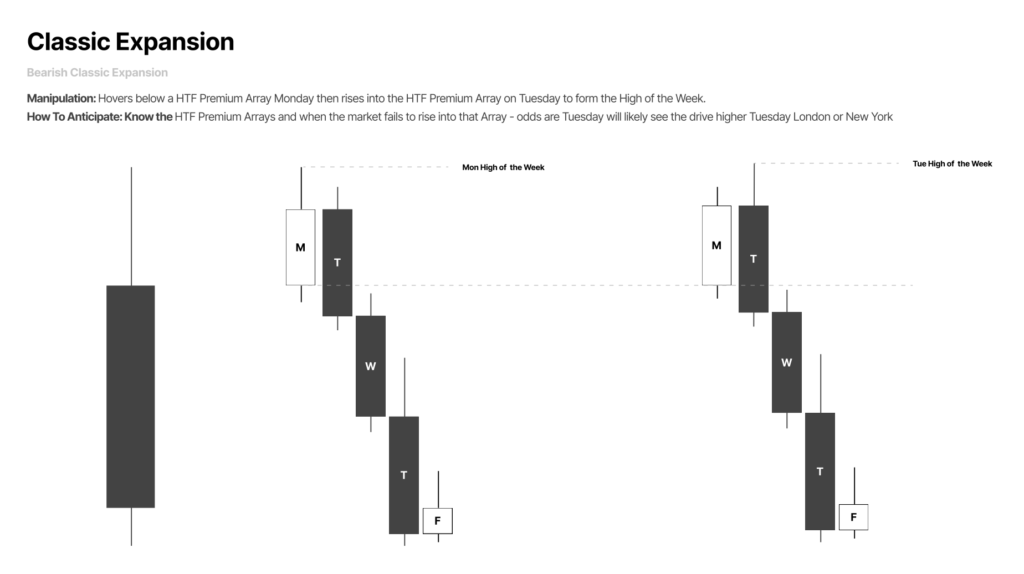
Bearish Classic Expansion Weekly Profile
The bearish Classic Expansion is the opposite.
The structure may appear as:
Monday retracement higher → Tuesday high of the week → Wednesday expansion lower → Thursday continuation → Friday range completion
Price initially trades higher and forms the upper portion of the weekly range.
Once the potential weekly high is confirmed, traders look for continuation lower during the following trading days.
The basic bearish sequence is:
Weekly high forms → Bearish delivery is confirmed → Trade away from the high → Target lower-timeframe or higher-timeframe objectives
The key is to avoid automatically assuming that Monday or Tuesday has formed the weekly high.
Confirmation is still required.
Start With the Higher-Timeframe Bias
The first step in using the Weekly Profile for Daily Bias – Classic Expansion is establishing directional context.
Ask:
Is price likely to expand higher or lower?
Higher-timeframe price action should provide the reason for the bias.
For example, price may have:
- Swept previous highs or lows.
- Reached a higher-timeframe Fair Value Gap.
- Reacted from an Order Block.
- Formed a higher-timeframe reversal.
- Created a protected swing.
- Left liquidity as a future objective.
Suppose price retraces into a bullish higher-timeframe area and forms a strong reversal structure.
If significant swing highs remain above price, these highs may become potential objectives.
The weekly bias may therefore be bullish.
The trader can now study Monday and Tuesday to determine whether the low of the week is forming.
Do Not Predict the Exact Day the Weekly High or Low Will Form
One of the most important principles of this weekly profile is that traders should not force price into a predetermined template.
The goal is not to say:
“Tuesday must form the low of the week.”
Instead, allow price to develop.
Monday closes.
Ask:
Has the weekly low been confirmed?
If the answer is no, allow Tuesday to form.
After Tuesday closes, evaluate the market again.
The process is:
Let price form the high or low → Look for confirmation → Trade the continuation
This approach prevents traders from entering simply because a particular day of the week has arrived.
A weekly profile should provide context, not become a rigid prediction model.
Use the Daily Candle Closure for Confirmation
Daily candle behavior is important when identifying the likely weekly high or low.
One confirmation discussed within this framework is a strong Candle 2 closure.
For example, during a bullish week, price may retrace lower before producing an aggressive bullish daily closure.
The bullish candle may close through a series of previous down-close candles.
This suggests that bearish delivery is being challenged and price may be transitioning toward bullish expansion.
The same principle applies in a bearish scenario.
A strong bearish daily closure after the potential weekly high may provide evidence that price is preparing to deliver lower.
However, the daily closure alone should not be the only confirmation.
The next step is to examine the hourly chart.
Confirm the Weekly High or Low With an Hourly Change in the State of Delivery
After identifying a potential weekly high or low on the daily chart, move to the 1-hour timeframe.
The objective is to find a change in the state of delivery.
Consider a bullish scenario.
Price creates a low.
Now study the series of bearish candles responsible for delivering price into that low.
If bullish price action closes through that bearish delivery, the market may have changed its state of delivery.
This helps confirm the low.
The logic is:
Potential weekly low → Daily confirmation → Hourly bullish change in state of delivery → Seek continuation higher
For a bearish scenario:
Potential weekly high → Daily confirmation → Hourly bearish change in state of delivery → Seek continuation lower
The hourly confirmation provides additional evidence that the wick or turning point has formed and price may trade away from it.
Trade the Days Following the Confirmed Weekly High or Low
Once the high or low of the week is confirmed, the next objective is to trade the continuation.
Within the fractal structure described in the Classic Expansion model, the turning candle can be viewed as Candle 2.
The trader then seeks opportunities during:
Candle 3 and Candle 4
On the weekly profile, these frequently correspond to the trading days following the confirmed high or low.
For example:
Tuesday low of the week → Wednesday continuation → Thursday continuation
Or:
Monday low of the week → Tuesday continuation → Wednesday continuation
In a bearish scenario:
Tuesday high of the week → Wednesday continuation lower → Thursday continuation lower
This is where the Weekly Profile for Daily Bias – Classic Expansion becomes useful.
Instead of entering randomly throughout the week, the trader knows which days have a stronger contextual reason to deliver in the anticipated direction.
Use Daily Closures to Determine Whether Continuation Is Still Likely
Every expansion day should be evaluated at its close.
Suppose Wednesday expands strongly higher and closes near the upper portion of its range.
The strong closure may support another continuation on Thursday.
The process becomes:
Confirmed weekly low → Wednesday expands higher → Wednesday closes strongly → Thursday continuation may be anticipated
However, suppose Thursday expands but closes poorly.
At the same time, price has already made a significant weekly range.
In this situation, anticipating another aggressive expansion on Friday becomes more difficult.
Each daily candle provides new information.
The trader should continuously ask:
Did price close in a manner that supports another day of directional delivery?
Know When the Expansion Has Already Occurred
A major mistake is continuing to chase price after the expected weekly move has already happened.
Imagine the following bullish structure:
Tuesday expands higher
Wednesday expands higher
Thursday expands higher
Price has now produced three days of directional movement.
At the same time, the market reaches the higher-timeframe target identified before the expansion.
Why aggressively anticipate another continuation on Friday?
The weekly objective may already be complete.
After two or three significant expansion days, price may:
- Consolidate.
- Retrace.
- Enter a new phase of delivery.
- Cap the weekly range.
This is why traders must consider how much expansion has already occurred.
The best opportunity may have been trading Wednesday and Thursday after the weekly low was confirmed, rather than chasing Friday’s price action.
Higher-Timeframe Objectives Help Define the End of Expansion
Classic Expansion should always be studied in relation to a target.
Potential objectives may include:
- Previous swing highs.
- Previous swing lows.
- Equal highs.
- Equal lows.
- Fair Value Gaps.
- Higher-timeframe points of interest.
- Other liquidity objectives.
Suppose Tuesday forms the low of the week.
Wednesday expands higher.
Thursday expands higher and takes the targeted swing highs.
The market has now reached the anticipated objective.
Even if price technically moves higher again, the original expansion thesis has largely delivered.
The trader should become more cautious.
The sequence is:
Identify bias → Identify target → Confirm weekly high/low → Trade expansion toward target → Reduce expectations after target delivery
Without a clear objective, traders may continue chasing directional movement after the best part of the expansion has finished.
Friday Can Cap the Weekly Range
After several days of expansion, Friday may behave differently.
Price may reach a key level and then partially retrace.
This can help cap the weekly range and complete the appearance of the weekly candle.
For example:
Tuesday low → Wednesday expansion → Thursday expansion into target → Friday retracement
The Friday retracement does not necessarily mean the higher-timeframe trend has reversed.
It may simply be the market completing the weekly range after several days of directional delivery.
This is closely related to the concept commonly referred to as TGIF within ICT-style price analysis.
The trader should therefore be cautious about expecting unlimited Friday continuation after a large weekly expansion.
Classic Expansion Is a Framework, Not a Fixed Template
Not every week will form a perfect textbook structure.
Monday may form the extreme.
Tuesday may form the extreme.
Sometimes Monday creates one side of the range before Tuesday produces a clearer reversal signal.
Price may even show slightly imperfect candle sequencing.
The purpose of the weekly profile is not to match every candle with a picture.
The real logic is:
Find the likely high or low of the week → Confirm the change in delivery → Seek continuation during the following days
Weekly profiles provide a method for reading price delivery.
They should not force the trader to ignore what price is actually doing.
How to Use Weekly Profile for Daily Bias – Classic Expansion
A simple trading process is:
Step 1: Determine the higher-timeframe bias
Decide whether price has a valid reason to expand higher or lower.
Step 2: Mark the higher-timeframe objective
Identify the liquidity or key level price may seek.
Step 3: Observe Monday and Tuesday
Allow the potential weekly high or low to develop.
Step 4: Evaluate the daily candle closure
Look for strong closure behavior supporting the anticipated direction.
Step 5: Move to the 1-hour timeframe
Confirm a change in the state of delivery around the potential weekly extreme.
Step 6: Seek continuation
Look for opportunities during the next trading day.
Step 7: Reassess the daily close
A strong continuation close may support another expansion day.
Step 8: Monitor completed range and objectives
After two or three expansion days or after price reaches the higher-timeframe target, reduce expectations for further continuation.
The complete model can be simplified as:
HTF Bias → HTF Objective → Monday/Tuesday Weekly Extreme → Daily Confirmation → Hourly Change in Delivery → Wednesday/Thursday Expansion → Target Reached → Weekly Range Completion
Final Thoughts
The Weekly Profile for Daily Bias – Classic Expansion helps ICT traders understand when a week may transition from an early-week retracement or reversal into directional price delivery.
The most important idea is not predicting whether Monday or Tuesday must form the high or low.
Instead, allow the weekly extreme to develop, confirm it through daily candle behavior and an hourly change in the state of delivery, and then seek continuation during the following days.
In a bullish Classic Expansion, the Monday or Tuesday low can create the foundation for multiple days of expansion higher.
In a bearish Classic Expansion, the Monday or Tuesday high can establish the foundation for directional movement lower.
By combining ICT higher-timeframe bias, objectives, daily closures, and hourly delivery confirmation, traders can use the Classic Expansion weekly profile to build a more structured daily bias and avoid chasing price after the weekly move has already completed.
