ICT Fair Value Gaps/FVG is an important price delivery concept taught by Michael J. Huddleston, the founder of ICT (Inner Circle Trader) concepts. A Fair Value Gap helps a trader identify an area where price has moved with an imbalance in liquidity delivery. In these areas, one side of the market has been offered, but the opposite side has not been delivered in the same price range.
In simple words, price moves very fast through an area and leaves a portion of price inefficiently traded. The market may later return into this area to deliver price more efficiently.
Michael J. Huddleston describes a Fair Value Gap as:
“It is a range in price delivery where one side of the market liquidity is offered.”
This liquidity imbalance is the main idea behind the ICT Fair Value Gap or FVG.
What Is an ICT Fair Value Gap/FVG?
An ICT Fair Value Gap/FVG is a range of price where only one side of liquidity has been offered during price delivery.
Price may move strongly upward or downward through a specific range. During this fast movement, the market does not provide balanced price delivery in both directions.
This creates an open or porous area in price.
For example, during a strong bearish movement, price may move quickly downward. Sell-side price delivery occurs through the range, but there is no proper upward delivery through a portion of the same price range.
That open range becomes a Fair Value Gap.
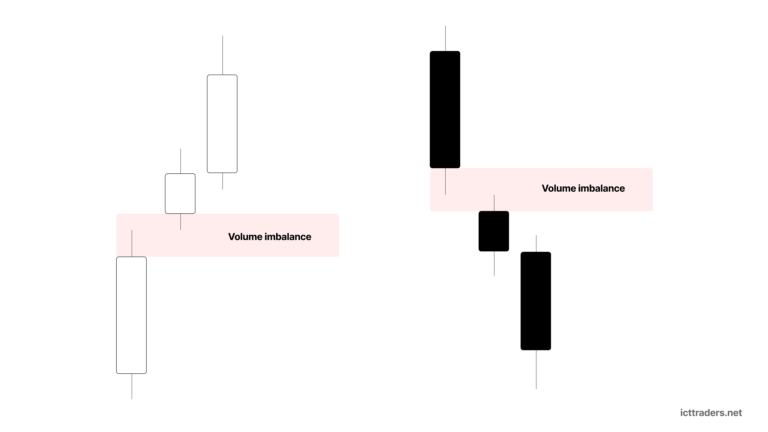
On the chart, the FVG is normally identified by studying three candles. The middle candle creates the strong price movement, while the candles before and after it frame the open range.
Why Does an ICT Fair Value Gap Form?
An ICT Fair Value Gap forms because price moves aggressively through a range.
The market does not always deliver price in a perfectly balanced manner. Sometimes a strong movement creates a situation where price is mainly delivered in only one direction.
Imagine price moving strongly downward.
The candle before the large bearish candle may trade upward from its low to its close. This means buy-side liquidity has already been offered in that portion of price.
The candle after the large bearish candle may also trade from its open toward its high. Again, buy-side liquidity is offered in that portion.
However, between the low of the first candle and the high of the third candle, a range may remain where the main delivery was only downward.
This open range is the bearish ICT Fair Value Gap/FVG.
The opposite idea applies to a bullish price movement.
The Three-Candle Structure of ICT Fair Value Gaps/FVG
The easiest way to identify an ICT FVG is by studying a three-candle price sequence.
The structure contains:
First candle – The candle before the aggressive price movement.
Second candle – The large displacement candle that moves strongly upward or downward.
Third candle – The candle formed after the displacement candle.
The Fair Value Gap is identified between the price ranges of the first and third candles.
For a bearish Fair Value Gap, study the low of the first candle and the high of the third candle.
When a price range exists between these two points, the range has not received proper upward price delivery on that timeframe.
For a bullish Fair Value Gap, the concept is reversed. Study the high of the first candle and the low of the third candle.
The open range between them may represent a bullish FVG.
Bearish ICT Fair Value Gap
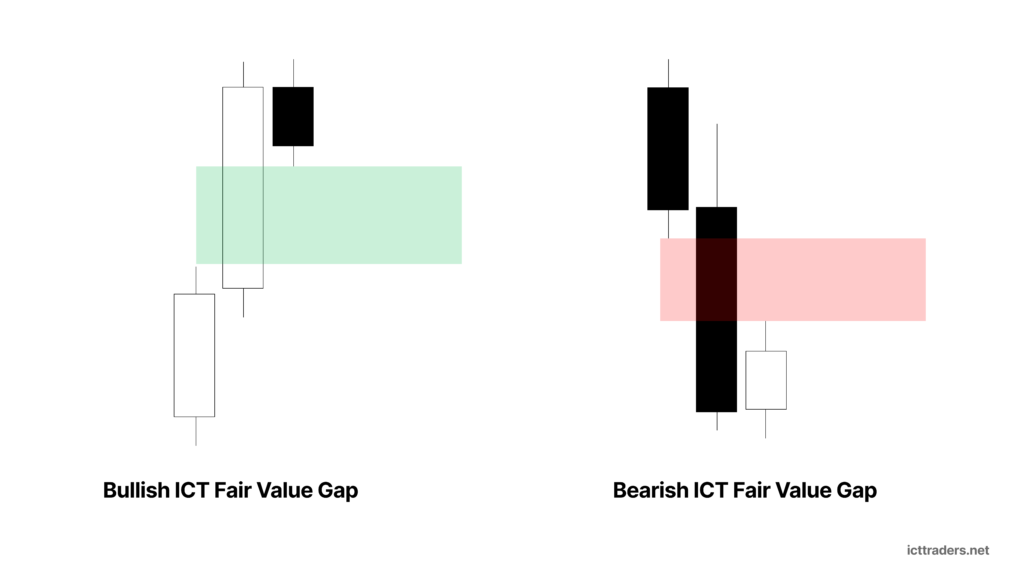
A bearish ICT Fair Value Gap/FVG forms during a strong downward price movement.
Suppose a large bearish candle moves price aggressively lower.
The previous candle has a specific low. The candle after the bearish displacement candle has a specific high.
When the high of the third candle remains below the low of the first candle, an open price range is present between them.
This range is the bearish Fair Value Gap.
In the ICT example, Michael J. Huddleston explains a daily EUR/USD price range where only sell-side liquidity was offered through the exposed area.
Because no proper upward movement had occurred through the range, ICT expected price could eventually trade back upward into the gap.
As Huddleston explains:
“We’re going to expect price to eventually want to trade back up into that little gapped area.”
The FVG becomes an area where traders watch for future price delivery.
Bullish ICT Fair Value Gap
A bullish ICT Fair Value Gap is the opposite of a bearish FVG.
It forms when price moves aggressively upward.
During the movement, buy-side price delivery occurs strongly through a range. However, proper downward or sell-side delivery may be absent from a portion of that range.
The trader studies the high of the first candle and the low of the third candle.
When an open price range remains between these candles, a bullish Fair Value Gap may be present.
Price may later trade downward into the FVG to fill the area and provide sell-side price delivery.
The complete concept is simply reversed from the bearish example.
Types of ICT Fair Value Gaps/FVG
There are two main directional types of ICT Fair Value Gaps/FVG. These are BISI and SIBI.
The type of FVG depends on the direction of price delivery and which side of the market becomes inefficient.
The two types are:
BISI – Buy-Side Imbalance, Sell-Side Inefficiency
SIBI – Sell-Side Imbalance, Buy-Side Inefficiency
Both are Fair Value Gaps, but they form in opposite price directions.
BISI – Buy-Side Imbalance, Sell-Side Inefficiency
BISI stands for Buy-Side Imbalance, Sell-Side Inefficiency.
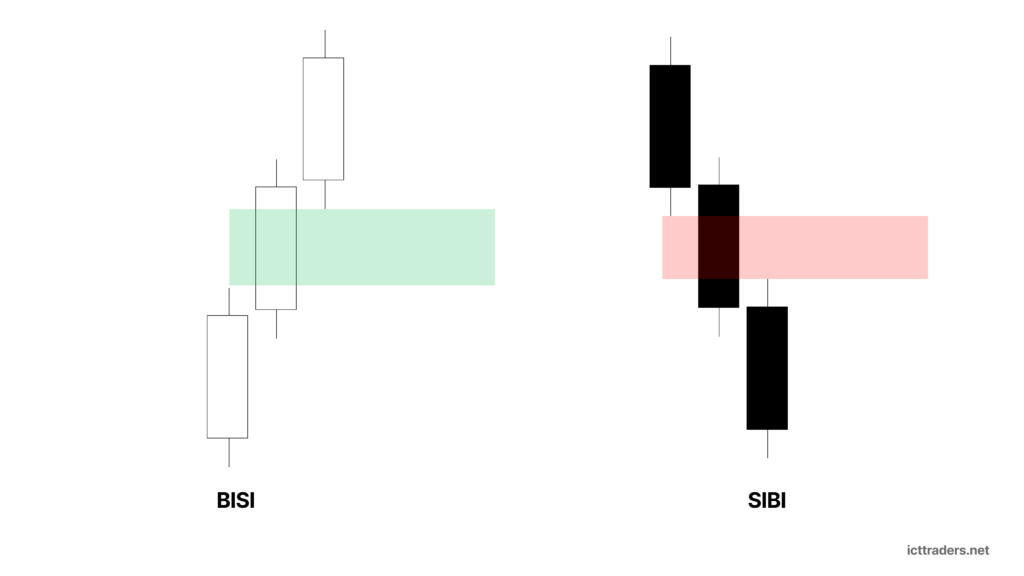
It is the bullish ICT Fair Value Gap.
A BISI forms when price moves aggressively upward. During this movement, strong buy-side price delivery occurs, but the same price range does not receive proper sell-side delivery.
In simple words, price is efficiently delivered upward but inefficiently delivered downward.
This leaves a bullish Fair Value Gap in the price range.
The BISI is identified by using three candles.
The first candle forms before the bullish displacement.
The second candle creates the strong bullish movement.
The third candle forms after the displacement.
To identify the BISI, mark the high of the first candle and the low of the third candle.
When the low of the third candle remains above the high of the first candle, an open range is present between them.
This open range is the BISI or bullish ICT Fair Value Gap.
BISI structure:
First candle high → Open price range → Third candle low
The price range between these two points has mainly received buy-side price delivery.
Sell-side price delivery remains inefficient.
Therefore, price may later trade downward into the BISI and deliver the missing sell-side liquidity through the range.
Michael J. Huddleston explains the general idea of an FVG as:
“It is a range in price delivery where one side of the market liquidity is offered.”
The BISI represents this condition during bullish price delivery.
SIBI – Sell-Side Imbalance, Buy-Side Inefficiency
SIBI stands for Sell-Side Imbalance, Buy-Side Inefficiency.
It is the bearish ICT Fair Value Gap.
A SIBI forms when price moves aggressively downward.
Strong sell-side price delivery occurs through the range. But proper upward or buy-side price delivery does not occur through a portion of the same range.
In simple words, price is delivered downward but remains inefficient on the buy side.
This creates a bearish Fair Value Gap.
The SIBI also has a three-candle structure.
The first candle forms before the bearish displacement.
The second candle creates the aggressive bearish movement.
The third candle forms after the displacement.
To identify the SIBI, mark the low of the first candle and the high of the third candle.
When the high of the third candle remains below the low of the first candle, an open range remains between them.
This range is the SIBI or bearish ICT Fair Value Gap.
SIBI structure:
First candle low → Open price range → Third candle high
Only sell-side price delivery has mainly occurred through this exposed price range.
Buy-side price delivery remains inefficient.
Therefore, price may later trade upward into the SIBI.
As Michael J. Huddleston explains in the mentorship lesson:
“We’re going to expect price to eventually want to trade back up into that little gapped area.”
In the EUR/USD example from the ICT video, the exposed bearish price range was a SIBI-type Fair Value Gap. Price later moved upward and closed the open range.
Difference Between BISI and SIBI
BISI forms from bullish price displacement.
It means Buy-Side Imbalance and Sell-Side Inefficiency.
It is a bullish Fair Value Gap.
Price may later retrace downward into the BISI.
SIBI forms from bearish price displacement.
It means Sell-Side Imbalance and Buy-Side Inefficiency.
It is a bearish Fair Value Gap.
Price may later retrace upward into the SIBI.
The easiest way to remember the difference is:
Bullish FVG = BISI
Bearish FVG = SIBI
However, an ICT trader should not automatically buy every BISI or sell every SIBI.
The Fair Value Gap should be studied with liquidity, market structure and the overall price delivery narrative.
Key Levels of ICT Fair Value Gap and Their Importance
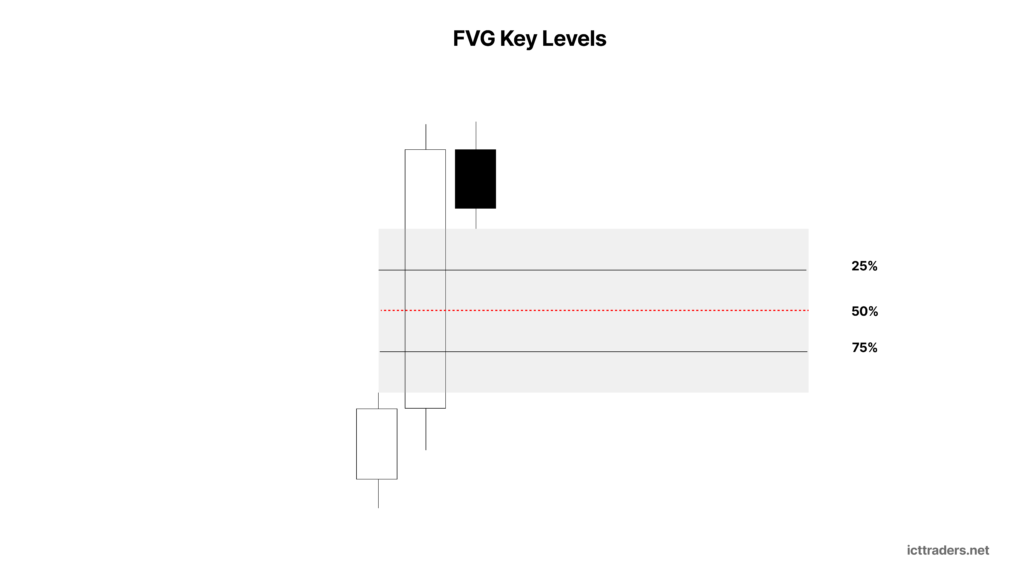
An ICT Fair Value Gap/FVG is a price range, not only a single price level. Inside this range, some important levels can be marked and used to study how price reacts when it returns to the imbalance.
The main key levels of a Fair Value Gap are the FVG High, Consequent Encroachment or 50% level, and FVG Low.
These levels help the ICT (Inner Circle Trader) understand how deeply price has traded into the imbalance and whether the FVG is being respected or completely delivered through.
FVG High
The FVG High is the highest price of the Fair Value Gap range.
It forms the upper boundary of the imbalance.
In a SIBI or bearish Fair Value Gap, the FVG High is the far side or deeper portion of the gap when price retraces upward into it.
Price moving toward the FVG High means a larger portion of the bearish imbalance has been filled.
In a BISI or bullish Fair Value Gap, the FVG High forms the upper boundary of the bullish imbalance.
The importance of the FVG High depends on the direction from which price is entering the gap.
It can be used to understand whether price is only partially filling the FVG or delivering through the complete imbalance.
Consequent Encroachment – 50% of FVG
Consequent Encroachment, commonly called CE, is the 50% or midpoint level of an ICT Fair Value Gap.
It is calculated by finding the middle price between the FVG High and FVG Low.
CE = (FVG High + FVG Low) ÷ 2
For example, if an FVG extends from 100 to 110, its Consequent Encroachment level is 105.
CE is an important level because it represents the midpoint of the inefficient price range.
Price does not always need to trade through the complete FVG before reacting. Sometimes price retraces into the gap, reaches Consequent Encroachment and then continues in the original direction of price delivery.
For a bullish BISI, price may retrace downward into the FVG and react around the CE level.
For a bearish SIBI, price may retrace upward into the FVG and react around the CE level.
Therefore, many ICT traders watch Consequent Encroachment as a more refined price level inside the Fair Value Gap.
However, CE should not be treated as an automatic entry.
The liquidity narrative, higher timeframe bias and price delivery should also support the trading idea.
FVG Low
The FVG Low is the lowest price of the Fair Value Gap range.
It forms the lower boundary of the imbalance.
In a BISI or bullish Fair Value Gap, the FVG Low represents the deeper portion of the gap when price retraces downward.
The deeper price moves into the BISI, the more of the previous bullish imbalance is being delivered through.
In a SIBI or bearish Fair Value Gap, the FVG Low forms the lower boundary of the bearish imbalance.
Just like the FVG High, its importance depends on the direction in which price enters the gap.
The FVG Low helps the trader determine whether price has only entered the imbalance, reached its midpoint or completely traded through the Fair Value Gap.
Near Boundary of the FVG
The near boundary is the first FVG level price reaches when it retraces into the Fair Value Gap.
For a bullish BISI being approached from above, the near boundary is normally the FVG High.
For a bearish SIBI being approached from below, the near boundary is normally the FVG Low.
This is the first point where price enters the inefficient range.
A reaction from the near boundary shows that price has only made a shallow retracement into the Fair Value Gap.
Price may touch this level and immediately move away from the FVG.
Therefore, the near boundary is important for identifying the first interaction between price and the imbalance.
Far Boundary of the FVG
The far boundary is the opposite side of the Fair Value Gap.
For a bullish BISI approached from above, the far boundary is the FVG Low.
For a bearish SIBI approached from below, the far boundary is the FVG High.
When price reaches the far boundary, it has delivered through almost the entire FVG range.
A complete trade through the gap shows that the original inefficient price range has received much deeper opposing price delivery.
Michael J. Huddleston explains the importance of efficient delivery when discussing gaps:
“This is exactly what I’m referring to as efficiency in terms of the price delivery.”
Therefore, traders should study how much of the Fair Value Gap has been traded through, rather than simply marking the FVG as a box.
Why FVG Key Levels Are Important
The key levels of an ICT Fair Value Gap/FVG show the depth of price retracement into the imbalance.
A reaction at the near boundary shows a shallow FVG fill.
A move toward Consequent Encroachment shows price has reached the midpoint of the imbalance.
A move beyond CE shows deeper delivery into the FVG.
A move toward the far boundary shows that most of the imbalance has been traded through.
These levels can help traders refine their analysis of price delivery.
The basic sequence can be understood as:
FVG Entry → Near Boundary → Consequent Encroachment (50%) → Far Boundary
The deeper price moves through these levels, the more of the Fair Value Gap is being delivered.
An ICT trader should combine these FVG key levels with buy-side liquidity, sell-side liquidity, market structure and higher timeframe bias.
The level alone does not create the complete trading setup.
Its importance comes from where the Fair Value Gap is located and why price is being drawn into that range.
Why Does Price Return to a Fair Value Gap?
According to the ICT price delivery concept, the market may return to a Fair Value Gap because the range was not efficiently delivered in both directions.
One side of liquidity has already been offered.
The other side remains missing.
The market can later revisit the open range and deliver price through it.
Michael J. Huddleston refers to this as efficiency in price delivery.
In the ICT video, he studies candle bodies, openings, closes, highs and lows to determine where buy-side and sell-side price delivery has already occurred.
When both sides have traded through a range, the price range becomes more efficiently delivered.
When only one side is present, a Fair Value Gap may remain.
As Huddleston says after explaining the open price range:
“That’s the nature of a fair value gap.”
However, this does not mean every FVG must immediately fill. The surrounding liquidity and market structure are also important.
ICT Fair Value Gaps and Liquidity
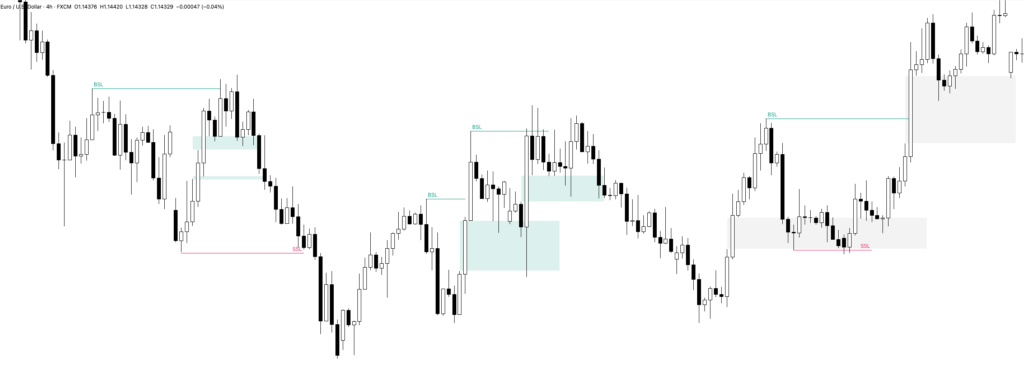
Liquidity is an important part of understanding ICT Fair Value Gaps/FVG.
In the ICT video, Michael J. Huddleston combines Fair Value Gaps with old highs, old lows, equal highs and stop liquidity.
For example, price may first trade below an old low.
Sell stops resting below the low are taken.
This is a sell-side liquidity run.
After sell-side liquidity has been removed, the trader may study a Fair Value Gap located above current price.
Price can then move upward toward equal highs or into the higher Fair Value Gap.
In the example explained in the mentorship lesson, price trades below an old low before moving higher and eventually closing the Fair Value Gap.
This creates a logical price delivery idea:
Sell-side liquidity taken → Price moves higher → Fair Value Gap is filled
The opposite can occur after a buy-side liquidity run.
Buy-side liquidity taken → Price moves lower → Lower Fair Value Gap is filled
This is why an ICT trader should not study FVGs as isolated boxes on the chart.
The location of liquidity around the FVG is important.
ICT Fair Value Gap and Liquidity Void
A Fair Value Gap and a liquidity void can overlap.
The difference may become more visible when changing chart timeframes.
Michael J. Huddleston explains that the Fair Value Gap occurs on the timeframe being studied.
A gap visible on the daily chart is a daily Fair Value Gap.
When the same price range is studied on a lower timeframe, the trader may see multiple candles moving rapidly through the area.
Instead of a simple three-candle gap, the lower timeframe may show a liquidity void.
Huddleston explains:
“The gap occurs on the time frame you’re looking at.”
Therefore, a higher timeframe Fair Value Gap may appear as a fast one-sided liquidity void on a lower timeframe.
This is one reason ICT traders use multiple timeframe analysis.

How to Identify ICT Fair Value Gaps/FVG on a Chart
To identify an ICT Fair Value Gap, first select the timeframe you are studying.
Look for a strong directional price movement.
This can be a large bearish or bullish candle.
Now study the candle immediately before and immediately after the strong movement.
For a bearish FVG:
Step 1: Find a strong bearish displacement candle.
Step 2: Mark the low of the candle before the displacement.
Step 3: Mark the high of the candle after the displacement.
Step 4: Check whether an open range exists between these two prices.
Step 5: The open range is the bearish Fair Value Gap.
For a bullish FVG, reverse the process.
Mark the high of the first candle and the low of the third candle.
The open price range between them becomes the bullish Fair Value Gap.
How to Use ICT Fair Value Gaps in Trading
The ICT video shows that an ICT Fair Value Gap should be combined with liquidity.
First identify the FVG on the selected timeframe.
Next, identify nearby old highs, old lows or equal highs where stop liquidity may be resting.
Watch how price interacts with those liquidity levels.
For example, price may run below an old low and take sell-side liquidity.
If a Fair Value Gap is located above price, the gap may become a logical area for price to trade toward.
Similarly, price may run above an old high or equal highs.
After taking buy-side liquidity, a Fair Value Gap below the market may become an area of interest.
The basic model is:
Identify liquidity → Wait for liquidity run → Locate FVG → Watch price delivery toward or into the FVG
In the mentorship example, the combination of a false break below an old low, equal highs and a Fair Value Gap created the basis for a price move of more than 100 pips.
The important point is not to trade every visible gap.
The FVG should make sense within the liquidity narrative.
Fair Value Gap Closure and Price Efficiency
A Fair Value Gap is considered filled or closed when price trades back through the open price range.
The ICT lecture video also gives a more refined explanation using candle bodies.
Michael J. Huddleston studies where candles open, close and create their highs or lows.
If a previous downward movement left a gap in buy-side delivery, price can move upward into the area.
When the candle bodies deliver price through the missing range, the previous price delivery becomes more efficient.
Huddleston describes this as:
“Efficiency in terms of the price delivery.”
After a price range has been efficiently delivered on both the buy side and sell side, the market may continue seeking liquidity somewhere else.
This is why traders should study not only candle wicks, but also candle openings and closes when examining detailed price delivery.
ICT Fair Value Gaps in Range-Bound Markets
The ICT lecture video specifically discusses using Fair Value Gaps during range-bound market conditions.
When price is consolidating, liquidity commonly forms above old highs and below old lows.
Buy stops may rest above equal highs.
Sell stops may rest below old lows.
Price may run one side of the range and then move toward an unfilled Fair Value Gap on the opposite side.
Michael J. Huddleston explains that in a range-bound or consolidation profile, traders can focus on stops and Fair Value Gaps.
This creates an important relationship:
Range liquidity + Stop run + Fair Value Gap
For example:
Price trades below an old low.
Sell-side liquidity is taken.
Price reverses back into the range.
Equal highs remain above.
A Fair Value Gap is also located near or above those highs.
The FVG can become part of the price delivery objective.
Relationship Between FVG, Liquidity Pools and Liquidity Voids
ICT concepts should not always be studied separately.
The ICT lecture video clearly shows that Fair Value Gaps, liquidity voids, liquidity pools and price delivery can overlap.
A price level may represent a previous high where buy stops are resting.
This creates a liquidity pool.
The same price range may also contain a higher timeframe Fair Value Gap.
When price trades through the old high, it can take buy-side liquidity and simultaneously trade into the Fair Value Gap.
On a lower timeframe, the same range may display a liquidity void.
Therefore, one movement can involve several ICT concepts at the same time.
A liquidity pool explains where stop liquidity is resting.
A Fair Value Gap explains where one-sided price delivery occurred.
A liquidity void shows rapid price movement through a range, commonly visible on a lower timeframe.
Studying how these concepts overlap provides a better understanding of ICT price delivery.
Important Rules for ICT Fair Value Gaps/FVG
Always identify the FVG on a specific timeframe.
Do not assume that the gap will look identical on every timeframe.
A higher timeframe FVG may appear as a liquidity void on a lower timeframe.
Study the first and third candles around the strong price movement.
Understand which side of liquidity has already been offered.
Look for old highs, old lows and equal highs around the FVG.
Study whether buy-side or sell-side liquidity has already been taken.
Do not treat every Fair Value Gap as an automatic trade entry.
Use the surrounding liquidity narrative to understand why price may seek the gap.
Remember that the bullish concept is the reverse of the bearish concept.
Final Thoughts on ICT Fair Value Gaps/FVG
ICT Fair Value Gaps/FVG is a concept based on one-sided price delivery. When price moves aggressively through a range, one side of market liquidity may be offered while the opposite side remains inefficiently delivered.
This creates an open range known as a Fair Value Gap.
According to the ICT (Inner Circle Trader) concepts taught by Michael J. Huddleston, price may later return into this range and provide more efficient price delivery.
The most important lesson is to avoid looking at the FVG alone.
Study the surrounding old highs, old lows, equal highs, liquidity pools and lower timeframe liquidity voids. A Fair Value Gap becomes more meaningful when it is connected with a clear liquidity event.
When these concepts are studied together, ICT Fair Value Gaps can help a trader understand where price has been inefficiently delivered and why the market may later return to a specific price range.