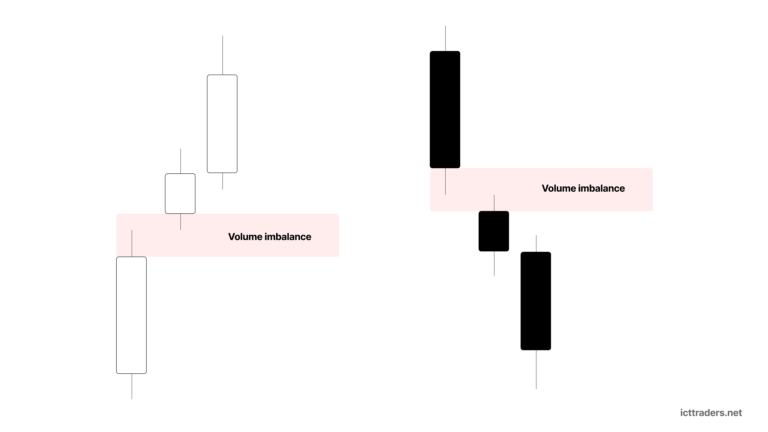
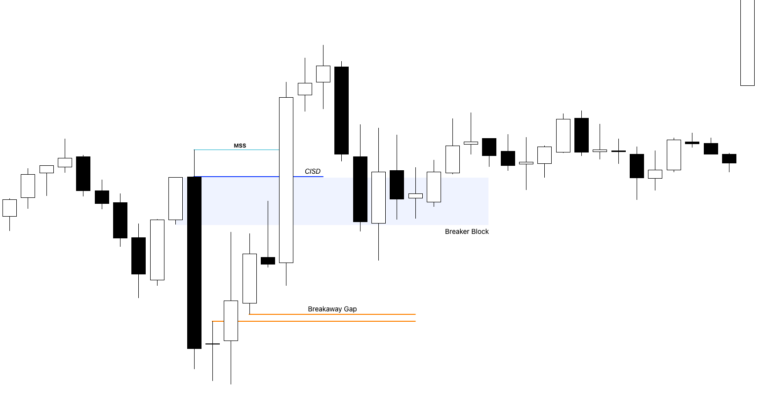
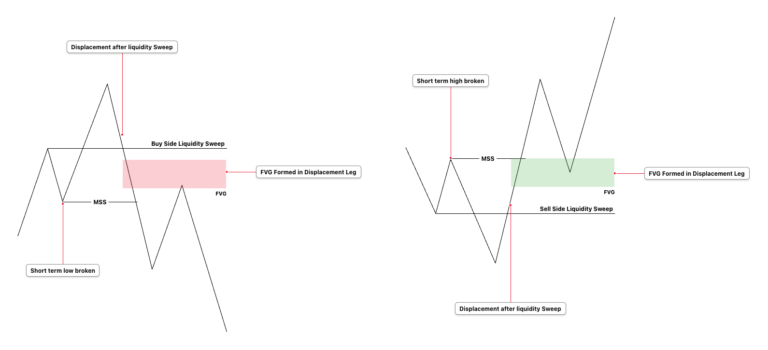
The ICT Balanced Price Range (BPR) is an important price delivery concept used in ICT (Inner Circle Trader) analysis. It is based on Fair Value Gaps and the interaction between two opposite price imbalances. The concept comes from the price action teachings associated with Michael J. Huddleston, the Inner Circle Trader.
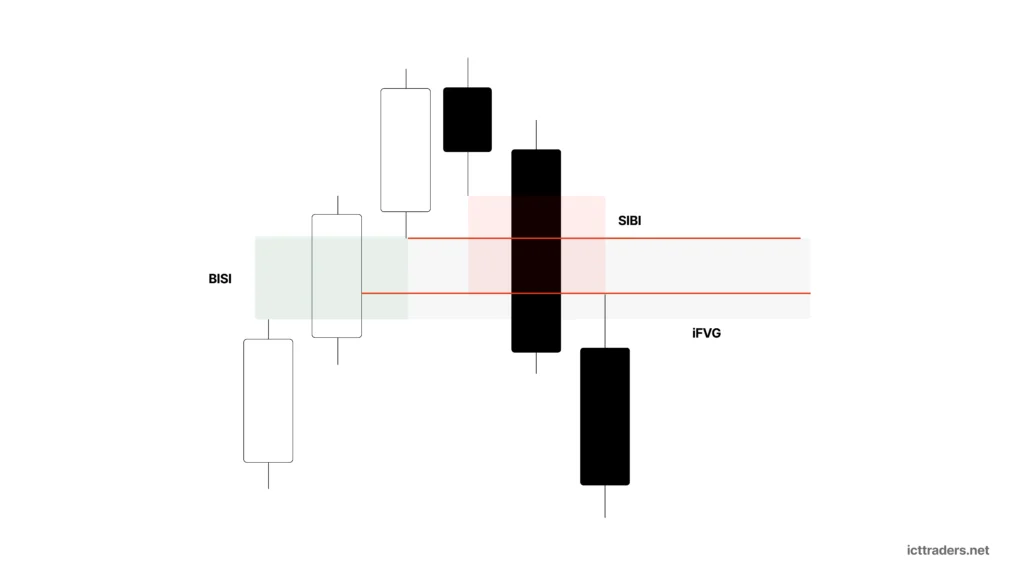
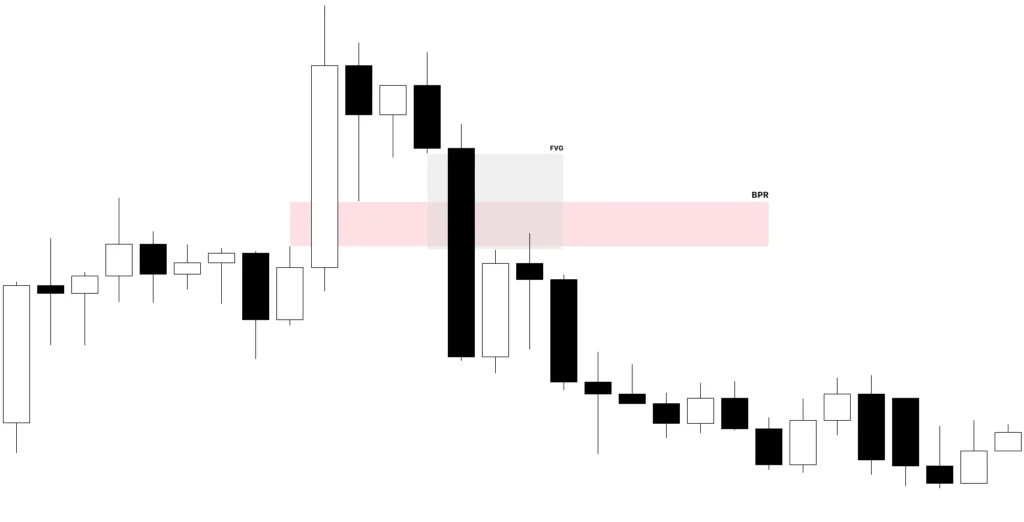
A Balanced Price Range forms when a bullish Fair Value Gap and bearish Fair Value Gap overlap each other in the same price range. The overlapping portion of these two opposite FVGs becomes the BPR.
In simple words, price aggressively moves in one direction and creates an imbalance.
Then price aggressively moves back in the opposite direction and creates another imbalance.
When both opposite Fair Value Gaps cover part of the same price range, the overlapping area becomes the ICT Balanced Price Range.
The BPR can become an important price reference when price later retraces into the overlap.
What Is ICT Balanced Price Range (BPR)?
An ICT Balanced Price Range or BPR is the overlapping area between two opposing Fair Value Gaps.
The two FVGs must represent opposite price delivery.
One is a bullish imbalance or BISI – Buy-Side Imbalance, Sell-Side Inefficiency.
The other is a bearish imbalance or SIBI – Sell-Side Imbalance, Buy-Side Inefficiency.
The basic structure is:
Bullish FVG + Bearish FVG + Overlapping Range = ICT Balanced Price Range
The complete first FVG is not automatically the BPR.
The complete second FVG is also not the BPR.
Only the price range where the two opposite Fair Value Gaps overlap is called the Balanced Price Range.
For example:
Bullish FVG = 100 to 110
Bearish FVG = 105 to 115
The overlap exists between 105 and 110.
Therefore:
BPR = 105 to 110
Price between 100 and 105 belongs only to the bullish FVG.
Price between 110 and 115 belongs only to the bearish FVG.
The range from 105 to 110 has received overlapping opposite imbalance delivery.
This becomes the ICT BPR.
Why Is It Called a Balanced Price Range?
To understand the term Balanced Price Range, first understand the nature of a Fair Value Gap.
A bullish Fair Value Gap shows aggressive upward price delivery.
Buy-side delivery dominates the range.
Sell-side delivery remains inefficient.
A bearish Fair Value Gap shows aggressive downward price delivery.
Sell-side delivery dominates.
Buy-side delivery remains inefficient.
Now imagine price creates a bullish FVG.
The market has delivered aggressively upward through a price range.
Later, price moves aggressively downward through part of the same range and creates a bearish FVG.
The second move provides opposite directional delivery.
Therefore, part of the previous bullish imbalance has now received bearish price delivery.
The overlapping area has been delivered through from opposing directions.
This creates the idea of a balanced price range or a range where opposite FVG delivery overlaps. Contemporary ICT study material describes the BPR as the overlap of opposing FVGs and associates the zone with equilibrium in price delivery.
However, the word “balanced” should not be misunderstood.
It does not mean price must stay inside the BPR.
It does not mean buyers and sellers are permanently equal.
The BPR is a specific price range created from the overlap of opposing imbalances.
How Does an ICT Balanced Price Range Form?
The formation of an ICT Balanced Price Range starts with aggressive price movement.
Suppose price moves strongly upward.
The movement creates a bullish Fair Value Gap.
This is a BISI.
Price continues higher.
Then the market reverses.
A strong bearish displacement moves price lower.
During the bearish movement, a bearish Fair Value Gap forms.
This is a SIBI.
The new bearish FVG overlaps a portion of the previous bullish FVG.
The overlapping portion becomes the ICT Balanced Price Range.
The sequence is:
Step 1 – Price displaces upward
↓
Step 2 – Bullish FVG forms
↓
Step 3 – Price reverses
↓
Step 4 – Bearish displacement forms
↓
Step 5 – Bearish FVG forms
↓
Step 6 – Both FVGs overlap
↓
Step 7 – Overlapping range becomes BPR
The same process can form in the opposite direction.
Price may first create a bearish FVG.
Then price aggressively reverses upward.
A bullish FVG forms through part of the bearish FVG.
The overlap creates a Balanced Price Range.
The Role of Displacement in ICT BPR
Displacement is important when studying ICT Balanced Price Range.
A BPR is connected with opposing price imbalances.
These imbalances normally develop when price moves rapidly enough to create Fair Value Gaps.
For example, price may aggressively move lower.
A SIBI forms.
Then price sharply reverses.
A strong bullish candle or series of candles reprices the market higher.
A BISI forms.
When the bullish FVG overlaps the previous bearish FVG, a BPR becomes visible.
This aggressive change in delivery is important because the market has moved through the same general price range in opposite directions.
Therefore, traders should not simply search for two random small FVGs anywhere on the chart.
Study the price movement that created the FVGs.
Was there strong displacement?
Did price clearly change delivery?
Did the opposing FVG form through the previous imbalance?
The price story around the BPR is more important than simply drawing overlapping rectangles.
Bullish ICT Balanced Price Range
A Bullish ICT Balanced Price Range is generally studied when the final price delivery and market narrative support higher prices.
A common bullish BPR formation starts with bearish price movement.
Price moves lower and creates a bearish FVG or SIBI.
Then price reverses aggressively upward.
The bullish displacement creates a BISI.
The new bullish FVG overlaps the previous bearish FVG.
The overlap becomes a BPR.
The basic structure is:
Bearish FVG forms
↓
Bullish displacement
↓
Bullish FVG forms
↓
Bullish FVG overlaps bearish FVG
↓
Bullish BPR
Price may later retrace downward into the Balanced Price Range.
If the bullish price narrative remains valid, the trader watches for price to respect the BPR and continue higher.
Bullish BPR Example
Suppose a bearish Fair Value Gap extends from 100 to 110.
Price then aggressively moves upward.
A bullish FVG forms from 105 to 115.
The overlapping price range is:
105 to 110
Therefore:
Bullish BPR = 105 to 110
After moving higher, price may retrace.
The trader watches the 105 to 110 range.
If price reacts from the BPR and resumes bullish delivery, higher liquidity may remain the objective.
However, the BPR alone is not an automatic buy signal.
The trader should first determine why the market is expected to move higher.
Bearish ICT Balanced Price Range
A Bearish ICT Balanced Price Range is generally studied when price delivery and the market narrative support lower prices.
The formation may begin with bullish displacement.
A bullish FVG or BISI forms.
Price then reverses aggressively lower.
The bearish displacement creates a SIBI.
The bearish FVG overlaps the previous bullish FVG.
The overlapping area becomes the bearish BPR.
The structure is:
Bullish FVG forms
↓
Bearish displacement
↓
Bearish FVG forms
↓
Bearish FVG overlaps bullish FVG
↓
Bearish BPR
Price may later retrace upward into the Balanced Price Range.
If the bearish narrative remains valid, the BPR may become a price area where traders study a continuation lower.
Bearish BPR Example
Suppose a bullish FVG extends from 100 to 110.
Price later moves aggressively lower.
A bearish FVG forms from 95 to 105.
The overlapping range is:
100 to 105
Therefore:
Bearish BPR = 100 to 105
Price moves lower.
Later, price retraces upward.
The trader studies price interaction with 100 to 105.
If price rejects the Balanced Price Range and resumes bearish delivery, sell-side liquidity may remain the objective.
How to Identify ICT Balanced Price Range on a Chart
To identify an ICT Balanced Price Range, first mark Fair Value Gaps correctly.
Do not start by searching for BPRs.
Start with price delivery.
Step 1 – Find the First Fair Value Gap
Look for a clear bullish or bearish FVG.
For a bullish FVG or BISI:
Candle 1 High < Candle 3 Low
The range between Candle 1 high and Candle 3 low forms the bullish FVG.
For a bearish FVG or SIBI:
Candle 1 Low > Candle 3 High
The range between Candle 3 high and Candle 1 low forms the bearish FVG.
Mark the complete FVG.
Step 2 – Wait for Opposite Price Delivery
Price must move in the opposite direction.
If the first FVG is bullish, look for bearish price delivery.
If the first FVG is bearish, look for bullish price delivery.
Study the displacement.
Step 3 – Find the Opposing FVG
Identify the new Fair Value Gap created during the opposite price move.
The second FVG must have the opposite direction from the first FVG.
Therefore:
BISI + SIBI
or
SIBI + BISI
Step 4 – Compare the Two FVG Ranges
Extend both FVG ranges horizontally.
Study whether their price ranges overlap.
The FVGs do not need to have exactly the same high and low.
Only a portion of the two gaps needs to share the same price range.
Step 5 – Mark Only the Overlap
The overlap becomes the ICT Balanced Price Range.
Do not mark the complete combination of both FVGs as BPR.
Mark only the shared price range.
The identification method is based specifically on finding the overlap between opposing FVGs.
How to Calculate the ICT BPR Range
The BPR can be calculated using the boundaries of the two Fair Value Gaps.
Suppose:
FVG 1 = 100 to 110
FVG 2 = 105 to 115
To find the overlapping range:
Take the higher lower boundary.
The lower boundaries are:
100 and 105.
The higher value is 105.
This becomes the BPR Low.
Now take the lower upper boundary.
The upper boundaries are:
110 and 115.
The lower value is 110.
This becomes the BPR High.
Therefore:
BPR Low = 105
BPR High = 110
Balanced Price Range = 105 to 110
If the two FVG ranges do not overlap, no BPR is present.
For example:
FVG 1 = 100 to 105
FVG 2 = 110 to 115
There is no shared price range.
Therefore, these two FVGs do not create a Balanced Price Range.
Key Levels of ICT Balanced Price Range
An ICT Balanced Price Range is a zone, not a single price.
The BPR contains three simple price references.
BPR High
The BPR High is the upper boundary of the overlapping Fair Value Gap range.
It shows the highest price included in both FVGs.
In a bearish setup, price retracing from below may first interact with the BPR Low and then move deeper toward the BPR High.
In a bullish setup approached from above, the BPR High can become the first boundary price enters.
BPR Low
The BPR Low is the lower boundary of the overlapping range.
It shows the lowest price contained in both Fair Value Gaps.
In a bullish setup, deeper price delivery through the BPR moves price toward the BPR Low.
In a bearish BPR approached from below, the BPR Low can become the first boundary of the zone.
BPR Consequent Encroachment
The midpoint or 50% level of the Balanced Price Range can also be marked.
This is the Consequent Encroachment or CE of the BPR.
It can be calculated as:
BPR CE = (BPR High + BPR Low) ÷ 2
For example:
BPR High = 110
BPR Low = 100
Therefore:
BPR CE = 105
The midpoint helps divide the Balanced Price Range into two halves.
A trader can study whether price only enters the BPR shallowly, reaches CE or delivers through the complete range.
The CE should not be treated as an automatic entry level.
It is simply an internal reference inside the BPR.
Why Is ICT Balanced Price Range Important?
The ICT Balanced Price Range is important because two opposing Fair Value Gaps have delivered through the same price area.
A single FVG represents one-sided inefficiency.
A BPR contains an overlap of opposite FVG delivery.
This can make the range an important price reference when the market returns.
ICT study material commonly describes BPR as sensitive to future price interaction and uses it as a retracement area within a directional market narrative.
The BPR can help a trader identify:
A refined price range.
A possible retracement area.
A zone created by opposing displacement.
A price reference for continuation analysis.
An overlap between BISI and SIBI.
The importance of the BPR does not come from the rectangle alone.
Its importance comes from how the range was created and where it is located in the overall market narrative.
ICT BPR and Liquidity
Liquidity should be studied before trading a Balanced Price Range.
Suppose price is bearish.
Buy-side liquidity rests above an old high.
Price trades higher and takes the buy-side liquidity.
Then price aggressively moves lower.
A bearish Market Structure Shift or change in price delivery develops.
The bearish displacement creates a Fair Value Gap.
The new bearish FVG overlaps a previous bullish FVG.
A bearish BPR forms.
Now the complete narrative may be:
Buy-side liquidity taken
↓
Bearish displacement
↓
Opposing FVG created
↓
Balanced Price Range forms
↓
Price retraces into BPR
↓
Bearish continuation
↓
Sell-side liquidity objective
The BPR is not the reason for the directional bias.
The liquidity event and price delivery create the narrative.
The BPR provides a price range where the trader can study the retracement.
The bullish model is the opposite.
Sell-side liquidity is taken.
Price displaces higher.
A bullish BPR forms.
Price retraces into the Balanced Price Range.
Buy-side liquidity remains above.
The trader studies continuation higher.
ICT BPR and Market Structure Shift
A Market Structure Shift or MSS can provide additional context for a Balanced Price Range.
Consider a bearish example.
Price moves higher.
Buy-side liquidity is taken.
Then price aggressively displaces lower through an important short-term low.
A bearish Market Structure Shift forms.
During the bearish displacement, a SIBI is created.
If this SIBI overlaps a previous BISI, a bearish BPR forms.
Now the trader has several pieces of information:
Buy-side liquidity has been taken.
Price has shifted bearish.
Displacement is present.
A bearish imbalance has formed.
A BPR is present.
Sell-side liquidity remains below.
The trader may then study a retracement into the BPR.
The BPR becomes more meaningful because it agrees with the surrounding price narrative.
How to Trade Bullish ICT Balanced Price Range
A basic bullish BPR model may develop in the following way.
Step 1 – Identify Sell-Side Liquidity
Mark an old low, equal lows or another sell-side liquidity pool.
Step 2 – Wait for Sell-Side Liquidity to Be Taken
Price trades below the low.
Sell stops are cleared.
Step 3 – Watch for Bullish Price Delivery
Price begins moving higher.
Look for strong bullish displacement.
Step 4 – Identify a Bullish FVG
The bullish displacement creates a BISI.
Step 5 – Find the Previous Bearish FVG
Check whether the bullish FVG overlaps a previous SIBI.
Step 6 – Mark the BPR
Mark only the overlapping price range.
Step 7 – Wait for Retracement
Do not chase the displacement.
Allow price to return toward the Balanced Price Range.
Step 8 – Study Price Reaction
Watch whether price respects the BPR and resumes bullish delivery.
Step 9 – Target Logical Liquidity
Identify buy-side liquidity above the market.
This may include:
Old highs.
Equal highs.
Session highs.
Previous Day High.
Other higher timeframe liquidity objectives.
The BPR is used as part of the execution narrative.
How to Trade Bearish ICT Balanced Price Range
The bearish model reverses the bullish process.
Step 1 – Identify Buy-Side Liquidity
Mark an old high, equal highs or another buy-side liquidity pool.
Step 2 – Wait for Buy-Side Liquidity to Be Taken
Price trades through the highs.
Buy stops are cleared.
Step 3 – Watch for Bearish Price Delivery
Price begins aggressively moving lower.
Step 4 – Identify a Bearish FVG
The bearish displacement creates a SIBI.
Step 5 – Find the Previous Bullish FVG
Determine whether the bearish FVG overlaps an existing BISI.
Step 6 – Mark the Balanced Price Range
Only mark the shared range between the two FVGs.
Step 7 – Wait for Price to Retrace
Price may trade upward into the BPR.
Step 8 – Study Bearish Reaction
Watch whether price rejects from the range and continues lower.
Step 9 – Target Sell-Side Liquidity
Possible objectives include:
Old lows.
Equal lows.
Session lows.
Previous Day Low.
Other lower liquidity pools.
Again, the BPR should agree with the complete market narrative.
BPR Inside a Fair Value Gap
A Balanced Price Range may also be studied in relation to a larger Fair Value Gap.
Some ICT teaching clips specifically discuss Balanced Price Ranges inside Fair Value Gaps, showing that BPR analysis can be nested within a larger imbalance context.
For example, a higher timeframe FVG may contain lower timeframe price delivery.
When the trader moves to a lower timeframe, opposing FVGs may overlap inside the larger higher timeframe imbalance.
This creates a lower timeframe BPR.
The structure can be understood as:
Higher Timeframe FVG
↓
Price trades into FVG
↓
Lower Timeframe displacement
↓
Opposing lower timeframe FVGs overlap
↓
Lower Timeframe BPR forms
The trader can use the higher timeframe FVG for context and the lower timeframe BPR to refine price analysis.
This is another reason timeframe selection is important.
A price range that appears as one FVG on a higher timeframe can contain several smaller price delivery structures on a lower timeframe.
ICT Balanced Price Range vs Fair Value Gap
An ICT Fair Value Gap and Balanced Price Range are not the same concept.
A Fair Value Gap forms from one-sided price delivery.
A bullish FVG represents bullish imbalance.
A bearish FVG represents bearish imbalance.
A Balanced Price Range requires two opposite Fair Value Gaps.
The differences are:
Fair Value Gap – One imbalance
Balanced Price Range – Overlap of two opposing imbalances
FVG – BISI or SIBI
BPR – BISI and SIBI overlapping
FVG – Three-candle imbalance structure
BPR – Price zone created from the intersection of opposite FVG ranges
A BPR cannot be identified correctly without first understanding Fair Value Gaps.
ICT BPR vs Inversion Fair Value Gap
Balanced Price Range and Inversion Fair Value Gap are also different concepts.
An Inversion Fair Value Gap begins with an existing FVG.
Price trades through the FVG and invalidates the expected support or resistance behaviour of that gap.
The failed FVG may then be studied from the opposite direction.
A BPR requires an overlap between two opposite Fair Value Gaps.
The basic difference is:
Inversion FVG = Failed FVG used from opposite side
BPR = Overlap of bullish and bearish FVGs
However, the concepts can appear in a similar price sequence.
A strong opposite displacement may trade through an FVG while simultaneously creating a new opposite FVG.
When the new FVG overlaps the old one, the overlap can form a Balanced Price Range. This relationship is described in ICT study references discussing IFVG/BPR reversal structures.
Therefore, an Inversion FVG and BPR may be closely related in some setups.
But they should not be treated as identical.
What Is a Failed ICT Balanced Price Range?
A BPR does not always hold price.
Suppose a bearish BPR forms.
Price retraces upward.
The trader expects bearish continuation.
But instead of rejecting, price aggressively delivers through the complete BPR and continues higher.
The expected bearish BPR reaction has failed.
The same concept applies to a bullish BPR.
Price may trade downward through the complete zone and continue bearish.
A failed BPR can tell the trader that the original directional expectation needs to be reconsidered.
Do not continue holding a bullish or bearish idea simply because a BPR exists.
Price delivery after interaction with the BPR remains important.
Does Price Always Return to the BPR?
No.
Price does not have to return to every ICT Balanced Price Range.
Sometimes displacement continues strongly.
The market may seek external liquidity before making a deep retracement.
The BPR may remain open.
Price may return much later.
In other situations, price may only touch the first boundary.
Sometimes price reaches the BPR CE.
Price can also trade through the complete range.
Therefore, avoid the belief:
BPR formed = Guaranteed retracement
The Balanced Price Range is a price reference.
It should be used with liquidity, time and directional price delivery.
Best Timeframe for ICT Balanced Price Range
The ICT BPR can appear on different timeframes because it is built from Fair Value Gaps.
The best timeframe depends on the trader’s model.
A higher timeframe BPR can provide broader price context.
A lower timeframe BPR can help refine a retracement after a liquidity event.
For example:
4-hour chart identifies bearish context.
15-minute chart shows buy-side liquidity being taken.
5-minute chart creates bearish displacement.
A bearish FVG overlaps a previous bullish FVG.
A 5-minute BPR forms.
Price retraces into the BPR.
The trader studies continuation toward sell-side liquidity.
The BPR timeframe should fit the analysis framework.
Do not randomly switch between many timeframes simply to find a BPR.
High-Probability ICT BPR Conditions
Not every Balanced Price Range has the same context.
A BPR may become more meaningful when several price conditions agree.
Look for a BPR after a clear liquidity run.
Study strong displacement.
Determine whether a Market Structure Shift has occurred.
Identify the higher timeframe directional bias.
Study whether price is in premium or discount.
Identify the next logical liquidity objective.
Look for a clean overlap between opposing FVGs.
Study the reaction when price retraces into the BPR.
The complete model can be understood as:
Liquidity Sweep → Market Shift → Displacement → Opposing FVG → BPR → Retracement → Liquidity Target
The BPR should fit inside the market narrative.
It should not be the entire trading strategy by itself.
Common Mistakes When Trading ICT Balanced Price Range
One common mistake is calling every two overlapping FVGs a high-quality setup.
The trader should study the direction of price delivery.
Another mistake is using two FVGs in the same direction.
A bullish FVG overlapping another bullish FVG does not create the standard BPR definition.
The two FVGs should be opposite.
Another mistake is marking the complete combined FVG range.
Only the overlap becomes the BPR.
Some traders also confuse BPR with Inversion FVG.
They are related in some price sequences but are not identical concepts.
Another common mistake is buying every bullish BPR and selling every bearish BPR.
The trader should first identify liquidity and directional bias.
Do not ignore the timeframe.
Do not assume price must retrace into the BPR.
Do not assume the BPR must always hold.
Finally, avoid forcing a BPR on unclear price action.
If the FVG boundaries and overlap are not clear, move to another price structure.
ICT Balanced Price Range Checklist
Before using an ICT BPR, ask:
Is the first Fair Value Gap clearly identified?
Is it a BISI or SIBI?
Did price create opposite directional displacement?
Has an opposite Fair Value Gap formed?
Do the two FVG price ranges actually overlap?
Have I marked only the overlapping range?
Where is the BPR High?
Where is the BPR Low?
Where is the BPR Consequent Encroachment?
Has buy-side or sell-side liquidity been taken?
Does the BPR agree with my directional bias?
Is there a logical liquidity objective?
Has price shown a Market Structure Shift or clear change in delivery?
Am I waiting for price reaction rather than blindly entering at the box?
If these questions create a logical price narrative, the Balanced Price Range may become an important price reference.
Final Thoughts on ICT Balanced Price Range (BPR)
The ICT Balanced Price Range (BPR) is the overlapping price range between two opposing Fair Value Gaps.
A bullish FVG represents BISI.
A bearish FVG represents SIBI.
When the BISI and SIBI overlap, the shared price range becomes the Balanced Price Range.
The BPR is important because the same area has experienced opposing imbalance delivery.
Price may later retrace into this range and react.
However, an ICT trader should not blindly buy or sell every BPR.
First identify liquidity.
Study the higher timeframe narrative.
Look for displacement.
Determine whether price has shifted delivery.
Mark the opposing FVGs correctly.
Then identify only the overlapping range.
The most important idea is simple:
Two opposite Fair Value Gaps overlap → The overlapping area becomes the ICT Balanced Price Range.
When the BPR is combined with liquidity, displacement, Market Structure Shift and a logical draw on liquidity, it can provide a more refined way to study how price retraces and continues toward its next objective.