ICT SMT Divergence is an important market analysis concept taught by Michael J. Huddleston, the creator of ICT (Inner Circle Trader). SMT stands for Smart Money Technique, and it is used to compare related markets to identify disagreement in their price movements.
The idea is simple.
Correlated markets should generally move in a similar way.
When one market makes a new high or low but another related market refuses to confirm that movement, a divergence appears.
This disagreement is called SMT Divergence.
For an ICT trader, the divergence can provide information about relative strength or weakness and may help identify a possible liquidity raid, market reversal or change in short-term price delivery.
ICT SMT Divergence is not a normal oscillator divergence.
No RSI, MACD or stochastic indicator is required.
The trader compares price with price.
What is ICT SMT Divergence?
ICT SMT Divergence occurs when two correlated markets fail to confirm the same high or low.
Suppose two markets normally move together.
Market A makes a lower low.
Market B does not make a lower low.
The two markets are now showing a disagreement.
This can indicate bullish SMT Divergence.
The market that failed to create the lower low is showing relative strength.
Now consider the opposite situation.
Market A makes a higher high.
Market B fails to make a higher high.
This creates bearish SMT Divergence.
The market that failed to create the higher high is showing relative weakness.
The basic concept is:
Correlated Markets + Failure to Confirm High or Low = SMT Divergence
ICT traders use this difference to study which market may be showing the stronger institutional clue.
Why Correlated Markets Are Used for SMT Divergence
SMT Divergence requires markets that have a meaningful relationship.
If two completely unrelated assets are compared, differences between their highs and lows may provide very little useful information.
The trader wants to compare markets that generally respond to similar market conditions.
Examples commonly studied by ICT traders include:
Forex
- EUR/USD and GBP/USD
- AUD/USD and NZD/USD
U.S. Stock Index Futures
- NASDAQ futures or NQ
- S&P 500 futures or ES
- Dow futures or YM
The idea is not that these markets must move pip-for-pip or point-for-point.
They are separate markets.
Their volatility and price ranges can differ.
But their general directional relationship can allow the trader to identify a crack in correlation.
When one correlated market attacks liquidity and another refuses to confirm the move, SMT Divergence may be present.
What Does SMT Divergence Tell a Trader?
ICT SMT Divergence can provide information about relative strength and relative weakness.
Suppose EUR/USD and GBP/USD are moving lower.
EUR/USD trades below a previous low.
GBP/USD remains above its corresponding low.
GBP/USD is refusing to confirm the new bearish extreme.
This can indicate relative strength in GBP/USD.
The trader may reason that the move lower is not being fully confirmed across the correlated markets.
The new low in EUR/USD may represent a sell-side liquidity raid.
If the larger market context is bullish, this disagreement can support a possible reversal higher.
SMT Divergence does not predict a reversal by itself.
It provides additional information.
The trader still needs to consider:
- Market bias
- Liquidity
- Higher timeframe PD Arrays
- Premium and discount
- Time of day
- Market structure
- Displacement
- Entry model
SMT should be used as confirmation of a market narrative, not as an isolated buy or sell signal.
Bullish ICT SMT Divergence
Bullish ICT SMT Divergence develops around market lows.
Two positively correlated markets are compared.
One market creates a lower low.
The other market fails to create a corresponding lower low.
The structure may look like this:
Market A: Lower Low
Market B: Higher Low or Equal Low
This disagreement suggests that one market is showing relative strength.
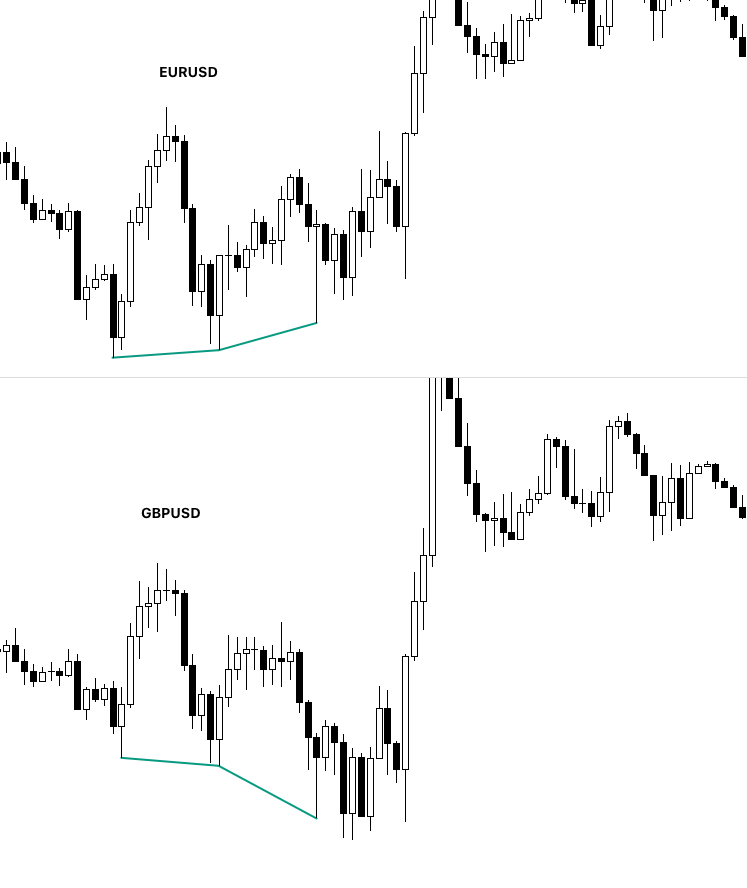
Simple Bullish SMT Example
Suppose EUR/USD and GBP/USD have previous lows.
EUR/USD trades below its old low.
Sell-side liquidity is taken.
At the same time, GBP/USD does not break its corresponding low.
The comparison becomes:
EUR/USD = Lower Low
GBP/USD = No Lower Low
This is bullish SMT Divergence.
GBP/USD is showing relative strength because sellers could not force it below the previous low.
The ICT trader can now study whether EUR/USD’s lower low was a liquidity raid.
If the higher timeframe context supports bullish prices, the SMT can provide additional confirmation.
Bullish SMT Logic
The basic bullish model is:
Correlated Markets Move Lower
↓
One Market Takes Sell-Side Liquidity
↓
Other Market Refuses to Make a Lower Low
↓
Bullish SMT Divergence
↓
Look for Bullish Confirmation
↓
Potential Expansion Higher
The important clue is the failure to confirm lower prices.
Bearish ICT SMT Divergence
Bearish ICT SMT Divergence develops around market highs.
Two correlated markets are compared.
One market creates a higher high.
The other market fails to create a corresponding higher high.
The structure becomes:
Market A: Higher High
Market B: Lower High or Equal High
This can indicate relative weakness.
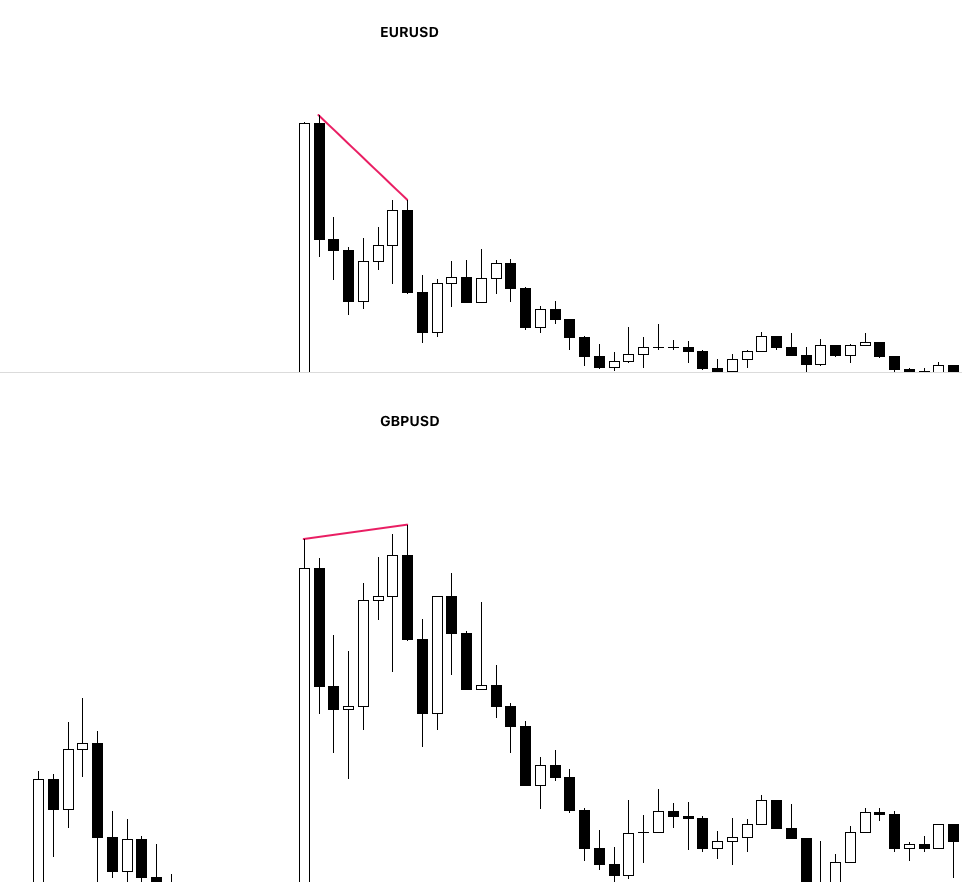
Simple Bearish SMT Example
Suppose EUR/USD and GBP/USD are trading higher.
GBP/USD trades above a previous high and reaches buy-side liquidity.
EUR/USD fails to trade above its corresponding high.
The comparison becomes:
GBP/USD = Higher High
EUR/USD = No Higher High
This creates bearish SMT Divergence.
EUR/USD is showing relative weakness.
If the larger market context supports lower prices, the move above the GBP/USD high may be viewed as a buy-side liquidity raid.
The trader then looks for bearish confirmation.
Bearish SMT Logic
The model is:
Correlated Markets Move Higher
↓
One Market Takes Buy-Side Liquidity
↓
Other Market Refuses to Make a Higher High
↓
Bearish SMT Divergence
↓
Look for Bearish Confirmation
↓
Potential Expansion Lower
The key information is the failure of the second market to confirm higher prices.
Bullish SMT vs Bearish SMT Divergence
The easiest way to remember ICT SMT Divergence is to focus on where it forms.
Bullish SMT
Look at lows.
One correlated market makes a lower low.
The other refuses to make a lower low.
Lower Low vs Failure to Make Lower Low = Bullish SMT
Bearish SMT
Look at highs.
One correlated market makes a higher high.
The other refuses to make a higher high.
Higher High vs Failure to Make Higher High = Bearish SMT
The trader should compare corresponding price swings.
Do not compare a current market high with an unrelated low formed several sessions earlier on another market.
The swing points should represent similar periods of price delivery.
ICT SMT Divergence and Liquidity
Liquidity is an important part of understanding SMT Divergence.
Suppose two correlated markets are approaching sell-side liquidity.
Market A trades below its old low.
Market B refuses to trade below its old low.
Why is this important?
Market A has attacked sell-side liquidity.
Stops below the old low may have been triggered.
But Market B does not confirm the bearish movement.
The divergence can suggest that the lower price movement is not supported equally across both correlated markets.
The ICT trader can study Market A’s lower low as a potential liquidity event.
The same occurs around highs.
Market A trades above an old high.
Buy-side liquidity is taken.
Market B fails to make a corresponding higher high.
This creates bearish SMT Divergence.
The market may have used the new high to attack liquidity rather than establish genuine bullish continuation.
Therefore, SMT Divergence is especially useful around:
- Old highs
- Old lows
- Equal highs
- Equal lows
- Previous day high
- Previous day low
- Previous week high
- Previous week low
- Session highs and lows
The divergence becomes more meaningful when one market is clearly interacting with an important liquidity pool.
Relative Strength and Weakness in SMT Divergence
ICT SMT Divergence helps traders compare the strength of related markets.
Consider a bullish example.
Both EUR/USD and GBP/USD are declining.
EUR/USD breaks a previous low.
GBP/USD holds above its previous low.
Which market is stronger?
GBP/USD
It refused to make the lower low.
Now consider a bearish example.
NQ makes a higher high.
ES fails to make a higher high.
Which market is showing relative weakness?
ES
It failed to confirm the new high.
This does not automatically mean the trader must trade the stronger or weaker market.
The main purpose of SMT is to identify the disagreement.
The trader can then combine that information with the larger market narrative.
ICT SMT Divergence With Negatively Correlated Markets
Negative correlated pair SMT Divergence is slightly different from the normal SMT comparison between positively correlated markets.
Positively correlated markets generally move in the same direction.
For example:
EUR/USD ↑ → GBP/USD ↑
Therefore, traders compare:
High vs High
and
Low vs Low
Negatively correlated markets generally move in opposite directions.
For example:
DXY ↑ → EUR/USD ↓
Therefore, the SMT comparison must also be inverted.
The trader compares:
High in One Market vs Low in the Negatively Correlated Market
or
Low in One Market vs High in the Negatively Correlated Market
The basic idea is:
Positive Correlation = Compare Same-Side Price Extremes
Negative Correlation = Compare Opposite-Side Price Extremes
How Negative Correlated SMT Works
Suppose two markets normally move in opposite directions.
When Market A moves higher, Market B should normally move lower.
The expected relationship is:
Market A Higher High ↔ Market B Lower Low
If Market A makes a higher high but Market B refuses to make a corresponding lower low, the inverse relationship is not being confirmed.
This creates SMT Divergence.
The opposite is also true.
Market A Lower Low ↔ Market B Higher High
If Market A makes a lower low while Market B fails to create a corresponding higher high, the markets are showing another failure of inverse confirmation.
The trader is looking for a crack in the normal inverse relationship.
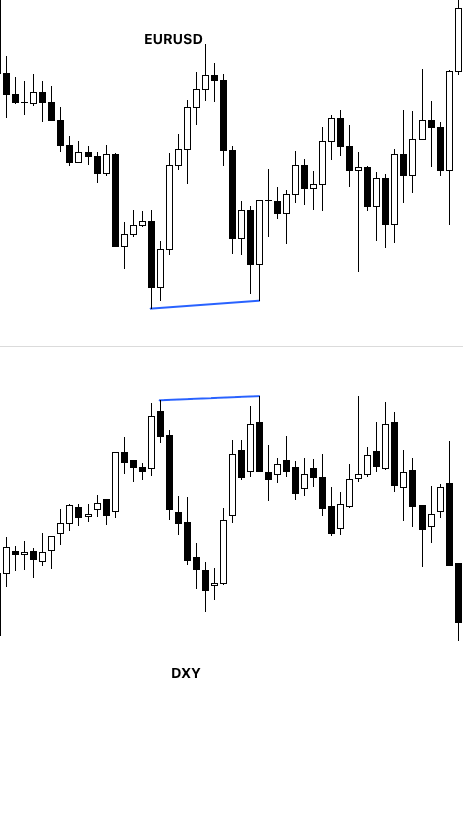
Bullish Negative Correlation SMT Divergence
Consider EUR/USD and DXY.
These markets normally show an inverse relationship.
Suppose EUR/USD moves lower and trades below a previous low.
EUR/USD creates a lower low and takes sell-side liquidity.
At the same time, DXY should normally confirm the move by creating a higher high.
But DXY fails to make a higher high.
The structure becomes:
EUR/USD = Lower Low
DXY = Fails to Make Higher High
This can create a bullish SMT Divergence for EUR/USD.
EUR/USD has taken sell-side liquidity, but DXY is failing to confirm continued dollar strength.
The model becomes:
EUR/USD Takes Sell-Side Liquidity
↓
DXY Fails to Make Higher High
↓
Inverse Correlation Fails to Confirm
↓
Bullish SMT Divergence
↓
Look for Bullish EUR/USD Confirmation
↓
Potential Expansion Higher
The trader can then look for bullish displacement, a Market Structure Shift, Fair Value Gap or another ICT entry model.
Bearish Negative Correlation SMT Divergence
Now consider the opposite condition.
EUR/USD moves higher and trades above a previous high.
Buy-side liquidity is taken.
Because DXY is negatively correlated with EUR/USD, DXY would normally be expected to create a corresponding lower low.
But DXY refuses to make the lower low.
The comparison becomes:
EUR/USD = Higher High
DXY = Fails to Make Lower Low
This can create a bearish SMT Divergence for EUR/USD.
EUR/USD has reached buy-side liquidity, but the U.S. Dollar Index is refusing to confirm continued dollar weakness.
The model becomes:
EUR/USD Takes Buy-Side Liquidity
↓
DXY Fails to Make Lower Low
↓
Inverse Relationship Fails to Confirm
↓
Bearish SMT Divergence
↓
Look for Bearish EUR/USD Confirmation
↓
Potential Expansion Lower
The trader can then study bearish displacement or another ICT bearish entry model.
DXY and EUR/USD Negative SMT Example
The easiest way to remember negative correlated SMT is through DXY and EUR/USD.
For bullish EUR/USD SMT:
EUR/USD Lower Low ↔ DXY Should Make Higher High
If DXY fails to make the higher high, bullish SMT may be present.
For bearish EUR/USD SMT:
EUR/USD Higher High ↔ DXY Should Make Lower Low
If DXY fails to make the lower low, bearish SMT may be present.
The simple rule is:
EUR/USD Low = Compare With DXY High
EUR/USD High = Compare With DXY Low
Do not compare the EUR/USD high with the DXY high as if the two markets were positively correlated.
Their inverse relationship requires opposite price extremes to be compared.
Positive vs Negative Correlated Pair SMT
For positively correlated markets:
Bullish SMT = Lower Low vs Failure to Make Lower Low
Bearish SMT = Higher High vs Failure to Make Higher High
For negatively correlated markets:
Bullish SMT = Lower Low vs Failure to Make Opposite Higher High
Bearish SMT = Higher High vs Failure to Make Opposite Lower Low
For example:
EUR/USD and GBP/USD
Compare:
Low ↔ Low
High ↔ High
But for:
EUR/USD and DXY
Compare:
EUR/USD Low ↔ DXY High
EUR/USD High ↔ DXY Low
This is the main difference between positive and negative correlated pair SMT Divergence.
Negative Correlation SMT is Still Confirmation
Negative correlated SMT should not be used as an automatic entry signal.
For example:
EUR/USD Makes Lower Low
DXY Fails to Make Higher High
This does not mean the trader should immediately buy EUR/USD.
The better model is:
Higher Timeframe Bullish Bias
↓
EUR/USD Takes Sell-Side Liquidity
↓
DXY Fails to Confirm With Higher High
↓
Bullish Negative Correlation SMT
↓
Bullish Displacement
↓
Market Structure Shift
↓
Retracement Into ICT PD Array
↓
Long Entry
SMT provides information about the disagreement between the two markets.
Price action should still confirm the expected directional move.
The important question is:
If these two markets normally move inversely, why did one create a new price extreme while the other refused to create the opposite corresponding extreme?
That failure of inverse confirmation is the foundation of negative correlated pair ICT SMT Divergence.
Which Market Should You Trade After SMT Divergence?
There is no rule that the trader must always trade the market that created the new high or low.
There is also no universal rule that the stronger market must always be selected.
The better market depends on the setup.
Suppose bullish SMT forms between EUR/USD and GBP/USD.
GBP/USD shows relative strength.
The trader may prefer GBP/USD because it is demonstrating strength.
However, EUR/USD may provide a cleaner liquidity raid and a better lower timeframe entry model.
The trader should compare:
- Higher timeframe bias
- PD Array
- Liquidity
- Displacement
- Market structure
- Entry precision
- Reward-to-risk
SMT helps identify a relationship.
It does not remove the need to analyze the individual market.
ICT SMT Divergence With EUR/USD and GBP/USD
EUR/USD and GBP/USD are commonly compared for forex SMT analysis.
Suppose both pairs are expected to trade higher.
During London or New York price delivery, both pairs move lower.
EUR/USD trades below a short-term low.
GBP/USD refuses to create a lower low.
This creates bullish SMT Divergence.
Now the trader looks for confirmation.
EUR/USD may show:
- Sell-side liquidity raid
- Bullish displacement
- Market structure shift
- Fair Value Gap
- Bullish order block
If these conditions develop, the trader can frame a bullish setup.
A bearish example is the opposite.
GBP/USD trades above a previous high.
EUR/USD refuses to trade above its corresponding high.
Bearish SMT forms.
If price is in a higher timeframe premium and bearish displacement develops, the divergence can support a short idea.
ICT SMT Divergence With NQ, ES and YM
SMT Divergence is also widely studied between U.S. equity index futures.
The three markets are:
- NQ – NASDAQ futures
- ES – S&P 500 futures
- YM – Dow futures
These indices are separate markets, but traders can compare their corresponding highs and lows.
Bullish Index SMT Example
Suppose NQ and ES trade below previous lows.
YM refuses to make a lower low.
The disagreement may indicate bullish SMT Divergence.
YM is showing relative strength.
The trader then studies whether the lower move in NQ or ES was a sell-side liquidity raid.
Bearish Index SMT Example
Suppose NQ makes a higher high.
ES and YM fail to create corresponding higher highs.
This can provide bearish SMT Divergence.
NQ may have attacked buy-side liquidity while the other indices show weakness.
The trader then looks for bearish confirmation.
When comparing three indices, the trader can study which market is the outlier.
ICT SMT Divergence and DXY
The U.S. Dollar Index or DXY can also provide correlation information for forex analysis.
However, DXY and pairs such as EUR/USD are generally studied through an inverse relationship.
If DXY strengthens, EUR/USD often experiences downward pressure.
If DXY weakens, EUR/USD can experience upward pressure.
Therefore, the comparison logic is different from two positively correlated pairs.
The trader should not blindly apply:
Higher High vs Lower High
in the same way as EUR/USD versus GBP/USD.
Instead, compare whether the inverse relationship is being maintained.
For example, if DXY makes a meaningful bullish expansion but a dollar-denominated foreign currency pair refuses to show corresponding weakness, the failure can provide information about relative strength.
For beginners, SMT is generally easier to study first with positively correlated markets.
The Best Timeframe for ICT SMT Divergence
SMT Divergence can appear on different timeframes.
There is no single timeframe where it works exclusively.
The trader can identify SMT on:
- Daily chart
- 4-hour chart
- 1-hour chart
- 15-minute chart
- 5-minute chart
- 1-minute chart
However, the timeframe should match the trading model.
A swing trader may study daily or 4-hour SMT.
A day trader may focus on 15-minute or 5-minute SMT.
A scalper may identify a short-term divergence on the 1-minute chart.
The important rule is:
Compare both markets on the same timeframe.
Do not compare a 5-minute high on EUR/USD with a 1-hour high on GBP/USD.
The price swings should be viewed under the same timeframe and similar period of market delivery.
SMT Divergence at Important Times of Day
SMT Divergence becomes more useful when it forms during an important trading period.
For ICT traders, time is part of price analysis.
A divergence forming randomly in an inactive market period may have less significance than one forming around an important session liquidity event.
Traders commonly study SMT around:
- London session
- New York session
- Session highs and lows
- Major market opens
- ICT Killzones
- ICT Silver Bullet windows
- Important macroeconomic releases
For example, both EUR/USD and GBP/USD may move lower during the New York session.
EUR/USD raids the London low.
GBP/USD fails to break its London low.
Bullish SMT forms.
The time of day, session liquidity and divergence can create a stronger market narrative.
How to Identify ICT SMT Divergence Step by Step
The following process can be used to study SMT Divergence.
1. Select Correlated Markets
Choose markets with a meaningful relationship.
For example:
EUR/USD and GBP/USD
or
NQ and ES
2. Use the Same Timeframe
Open both charts on the same timeframe.
For example:
5-Minute EUR/USD
and
5-Minute GBP/USD
3. Mark Corresponding Swing Points
Identify highs or lows formed during the same market period.
4. Compare the New Price Extreme
Ask:
Did both markets make a higher high?
Did both markets make a lower low?
5. Identify the Failure to Confirm
If one makes a new extreme and the other does not, SMT Divergence may be present.
6. Determine Bullish or Bearish SMT
Compare lows for bullish SMT.
Compare highs for bearish SMT.
7. Study Liquidity
Did one market take an important old high or old low?
8. Check the Larger Market Bias
Does the divergence support the expected market direction?
9. Wait for Price Confirmation
Look for displacement, structure change or another defined ICT entry model.
10. Frame the Trade
Use logical risk and a liquidity-based price objective.
How to Trade Bullish ICT SMT Divergence
A simple bullish SMT model may look like this:
Step 1. Establish Bullish Bias
The higher timeframe should support higher prices.
Price may be in discount or reacting from a bullish PD Array.
Step 2. Identify Sell-Side Liquidity
Mark old lows or equal lows.
Step 3. Compare Correlated Markets
One market trades below its low.
The second market refuses to make a lower low.
Step 4. Confirm Bullish SMT
The disagreement at the lows creates bullish divergence.
Step 5. Wait for Bullish Displacement
Do not enter only because SMT appears.
Price should demonstrate a willingness to move higher.
Step 6. Identify an Entry Model
The trader may use:
- Fair Value Gap
- Order Block
- Breaker
- Market Structure Shift
Step 7. Target Buy-Side Liquidity
Potential targets may include old highs or equal highs.
The model becomes:
Bullish Bias → Sell-Side Raid → Bullish SMT → Displacement → Entry → Buy-Side Liquidity
How to Trade Bearish ICT SMT Divergence
The bearish model is the reverse.
Step 1. Establish Bearish Bias
Higher timeframe analysis supports lower prices.
Price may be in premium or reacting from a bearish PD Array.
Step 2. Mark Buy-Side Liquidity
Identify old highs or equal highs.
Step 3. Compare Correlated Markets
One market trades above its high.
The second market refuses to create a higher high.
Step 4. Confirm Bearish SMT
The disagreement at the highs creates bearish divergence.
Step 5. Wait for Bearish Displacement
Price should demonstrate selling pressure.
Step 6. Use a Defined Entry Model
Look for a bearish Fair Value Gap, order block or another ICT entry framework.
Step 7. Target Sell-Side Liquidity
Old lows and equal lows may provide possible objectives.
The model becomes:
Bearish Bias → Buy-Side Raid → Bearish SMT → Displacement → Entry → Sell-Side Liquidity
SMT Divergence is Not an Entry Signal
One of the biggest mistakes is entering immediately after seeing SMT Divergence.
A trader notices:
EUR/USD makes lower low
GBP/USD does not
Then immediately buys.
This is not enough.
The markets can remain divergent for a period of time.
Price can also continue in the original direction.
SMT provides information and confirmation.
The trader should still wait for a price-action setup.
For example:
SMT Divergence
↓
Displacement
↓
Market Structure Shift
↓
Fair Value Gap Retracement
↓
Entry
This creates a complete trading framework.
Without confirmation, the trader may enter too early.
SMT Divergence and Market Structure Shift
A Market Structure Shift or MSS can provide useful confirmation after SMT Divergence.
Suppose bullish SMT forms.
One market takes sell-side liquidity.
The correlated market refuses to make a lower low.
Now price aggressively moves higher and violates a short-term swing high.
This can indicate a bullish shift in short-term price delivery.
The trader may then study the retracement.
A Fair Value Gap or bullish order block can provide the entry area.
The complete model becomes:
Sell-Side Liquidity → Bullish SMT → Bullish MSS → Retracement → Long Entry
For bearish conditions:
Buy-Side Liquidity → Bearish SMT → Bearish MSS → Retracement → Short Entry
SMT helps build the narrative.
Structure provides additional confirmation.
ICT SMT Divergence and Fair Value Gap
A Fair Value Gap can be used after SMT Divergence.
Suppose bearish SMT forms at a market high.
One index takes buy-side liquidity.
The correlated index refuses to confirm the higher high.
Price then displaces lower.
The bearish displacement creates a Fair Value Gap.
The trader can wait for price to retrace into the FVG.
The model becomes:
Buy-Side Raid
↓
Bearish SMT Divergence
↓
Bearish Displacement
↓
Bearish FVG
↓
Retracement Into FVG
↓
Short Position
↓
Target Sell-Side Liquidity
The FVG provides the entry framework.
The SMT provides the divergence context.
Common Mistakes With ICT SMT Divergence
The first mistake is comparing unrelated markets.
SMT requires a meaningful market relationship.
The second mistake is using different timeframes.
Compare corresponding swings on the same timeframe.
The third mistake is comparing unrelated swing points.
The highs or lows should develop during similar price delivery.
The fourth mistake is entering immediately after SMT appears.
Wait for confirmation.
The fifth mistake is ignoring the higher timeframe bias.
A divergence against the larger price narrative may fail.
The sixth mistake is forcing SMT on every high and low.
Not every small disagreement is meaningful.
The seventh mistake is using SMT as a complete trading strategy.
It is primarily a confirmation and market-analysis concept.
The eighth mistake is ignoring liquidity.
SMT becomes more useful when one market has taken an important liquidity level.
Simple ICT SMT Divergence Checklist
Before using SMT Divergence, ask:
Are the markets correlated?
Am I comparing the same timeframe?
Are the swing points related?
Did one market make a new high or low?
Did the other market fail to confirm?
Is this bullish or bearish SMT?
Was liquidity taken?
Does the higher timeframe bias support the divergence?
Did price show displacement?
Do I have a defined entry model?
If several of these questions cannot be answered clearly, the SMT setup may not be worth trading.
Final Thoughts on ICT SMT Divergence
ICT SMT Divergence is a powerful price-comparison concept within the ICT (Inner Circle Trader) framework.
Instead of using an oscillator, the trader compares correlated markets.
When one market creates a new price extreme and another market fails to confirm it, the disagreement can reveal relative strength or weakness.
The basic rules are simple:
Bullish SMT Divergence = One Market Makes Lower Low, Correlated Market Fails to Make Lower Low
Bearish SMT Divergence = One Market Makes Higher High, Correlated Market Fails to Make Higher High
But SMT should not be traded in isolation.
The best context develops when divergence is combined with:
Higher Timeframe Bias + Liquidity + Time + SMT Divergence + Displacement + ICT Entry Model
The trader is not simply searching for two different highs or lows.
The purpose is to identify a crack in correlation around an important price level and determine whether one market is revealing relative strength or weakness.
For an ICT trader, SMT Divergence can provide one more layer of confirmation before a potential market expansion.
The most important question is:
If these markets are expected to move together, why did one confirm the new high or low while the other refused?
That disagreement is where the ICT SMT Divergence analysis begins.