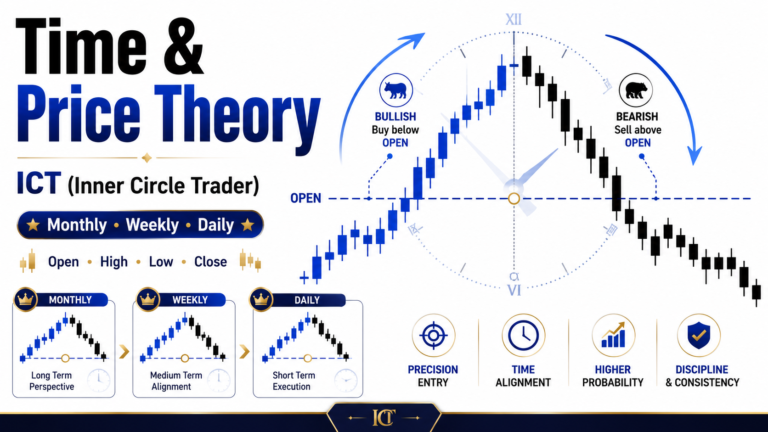
The ICT Smart Money Technique or SMT is an important intermarket analysis concept used in the ICT (Inner Circle Trader) methodology. Developed and taught by Michael J. Huddleston, this concept is covered in the ICT Forex – Market Maker Primer Course and helps traders identify hidden strength or weakness by comparing related markets.
SMT is based on a simple idea: closely correlated or inversely correlated markets should generally move with a degree of symmetry.
When that expected relationship breaks, the disagreement can provide information about institutional accumulation or distribution.
As Michael J. Huddleston explains:
“We’re going to be looking for a divergence between closely correlated or inversely correlated assets.”
Instead of analyzing one chart in isolation, SMT compares corresponding price swings between related assets to determine whether the current market move is confirmed or potentially misleading.
What Is the ICT Smart Money Technique or SMT?
SMT stands for Smart Money Technique, sometimes discussed as an SMT divergence.
The concept compares price swings between markets that have a known relationship.
The trader studies:
- Swing highs
- Swing lows
- Higher highs
- Lower highs
- Higher lows
- Lower lows
Then the same price swing is compared with another correlated or inversely correlated market.
The purpose is to determine whether market symmetry confirms the move.
The basic idea is:
Markets Move Symmetrically → Current Price Action Is Confirmed
Markets Fail to Move Symmetrically → Potential Smart Money Activity
Huddleston states:
“Every price swing should be studied to determine if market symmetry confirms it.”
This disagreement between markets is the foundation of SMT analysis.
Understanding Market Symmetry
Before identifying SMT divergence, traders must understand normal market symmetry.
For example, the US Dollar Index and many foreign currencies quoted against the US dollar generally have an inverse relationship.
When the Dollar Index moves higher, downward pressure may appear in pairs such as EUR/USD or GBP/USD.
When the Dollar Index moves lower, those foreign currencies may move higher.
Therefore:
DXY Higher → Foreign Currency Lower
DXY Lower → Foreign Currency Higher
In a symmetrical condition, corresponding price swings should confirm each other.
For example:
DXY Makes Lower Low → GBP/USD Makes Higher High
Or:
DXY Makes Higher High → GBP/USD Makes Lower Low
When these corresponding swings form correctly, the current market direction is confirmed.
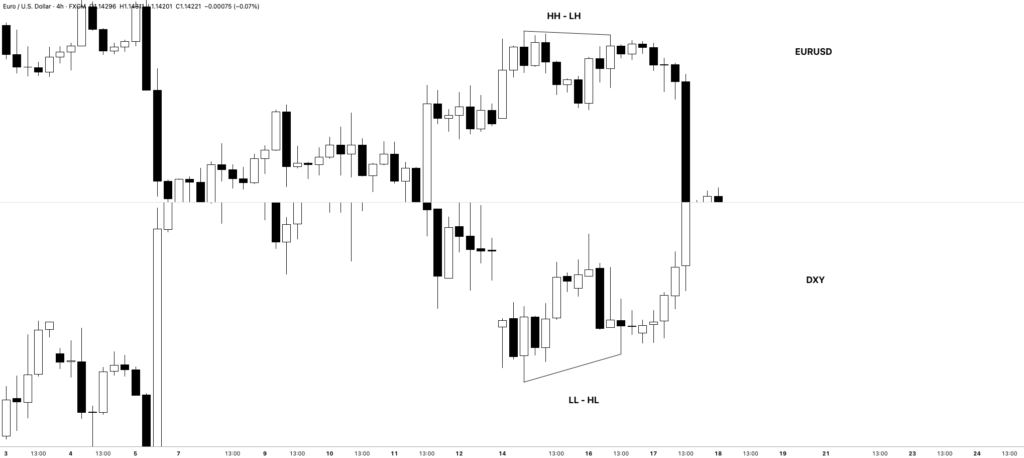
Symmetrical Price Action Confirms the Trend
Suppose the Dollar Index creates a new lower low.
At approximately the same time, GBP/USD creates a new higher high.
The movement is symmetrical.
DXY Lower Low ↔ GBP/USD Higher High
This confirms dollar weakness and foreign currency strength.
According to the ICT framework, traders should generally avoid aggressively searching for reversal setups when this symmetry is present.
The underlying trend may still be intact.
The same principle works in reverse:
DXY Higher High ↔ GBP/USD Lower Low
This confirms dollar strength and weakness in GBP/USD.
When both markets confirm the same underlying condition, the probability of immediate reversal may be lower.
What Is SMT Divergence?
SMT divergence occurs when related markets fail to produce the price swings expected from their correlation.
For example:
GBP/USD Makes Higher High
But:
DXY Fails to Make Lower Low
The markets are no longer moving symmetrically.
This disagreement may indicate underlying strength in the Dollar Index.
The GBP/USD higher high may appear bullish when viewed alone. However, the Dollar Index is refusing to create the corresponding lower low.
This is valuable information.
The sequence may be:
GBP/USD Higher High → DXY Higher Low → Market Symmetry Fails → Dollar Strength Indicated → Potential GBP/USD Reversal
The higher high in GBP/USD may simply be a liquidity event above an old high.
Bullish SMT Divergence in the Dollar Index
Consider a situation where the Dollar Index is expected to make a lower low because a foreign currency has made a higher high.
Instead, DXY forms a higher low.
This means DXY is showing relative strength.
The SMT condition may appear as:
Foreign Currency → Higher High
DXY → Fails to Make Lower Low
This failure can suggest that the Dollar Index is being accumulated.
Huddleston explains:
“The dollar was unwilling to make a lower low, and the only reason why that can happen is if it’s being bought aggressively.”
Within the ICT interpretation, the foreign currency may be moving above an old high to raid buy-side liquidity while underlying dollar strength remains present.
The trader may therefore anticipate:
Dollar Strength → Foreign Currency Weakness
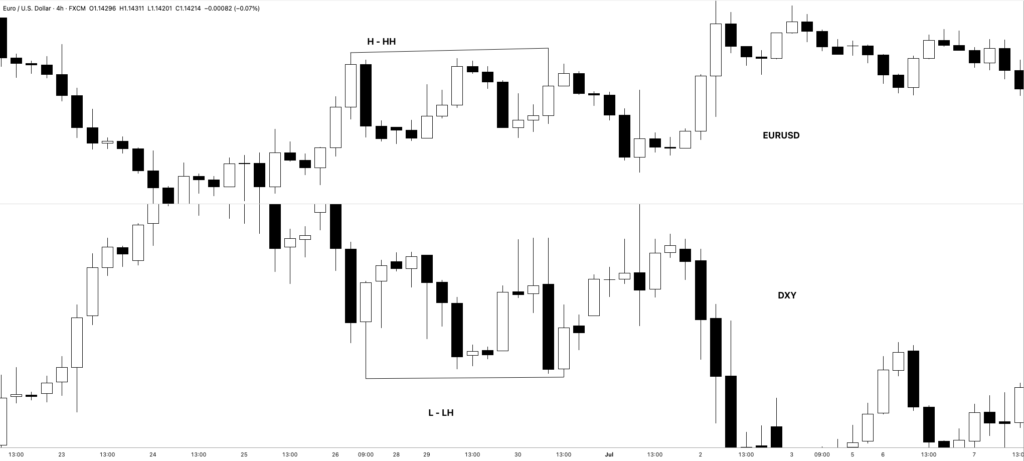
Bearish SMT Divergence in the Dollar Index
The opposite condition can also occur.
Suppose a foreign currency creates a lower low.
Normally, DXY should create a corresponding higher high.
However, DXY fails to make that higher high and instead forms a lower high.
The structure becomes:
Foreign Currency → Lower Low
DXY → Fails to Make Higher High
This may indicate underlying weakness in the Dollar Index.
The foreign currency’s move below an old low may simply be taking sell-side liquidity.
The sequence may be:
Foreign Currency Lower Low → DXY Lower High → SMT Divergence → Dollar Weakness → Foreign Currency Potentially Rallies
This can help traders identify possible bullish conditions in the foreign currency.
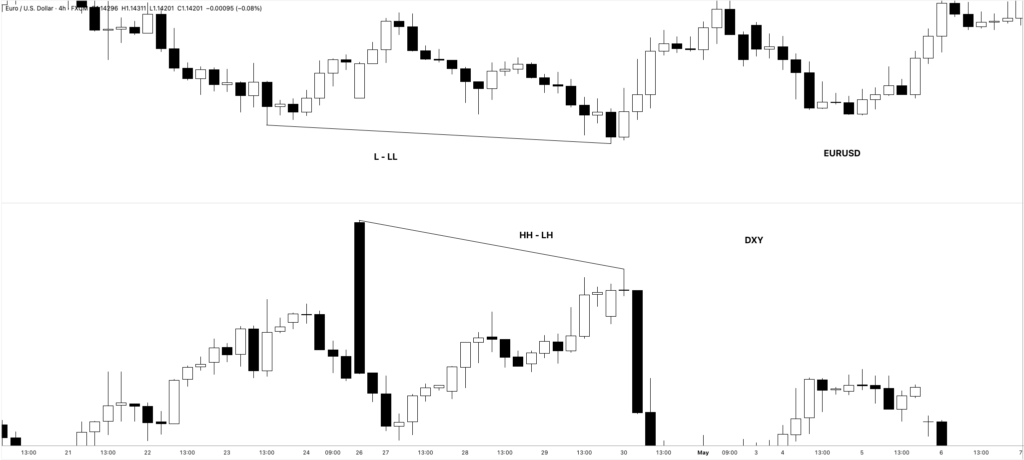
SMT and Failure Swings
Failure swings are important in The ICT Smart Money Technique or SMT.
A failure swing occurs when one market fails to make the expected corresponding high or low.
Suppose GBP/USD creates a higher high.
DXY should theoretically produce a lower low.
If DXY creates a higher low instead, DXY has produced a failure swing relative to the expected symmetrical movement.
The trader should ask:
Why was DXY unwilling to trade lower?
Within ICT analysis, this unwillingness can indicate accumulation or underlying buying pressure.
Similarly:
EUR/USD Makes Lower Low → DXY Should Make Higher High → DXY Forms Lower High
The Dollar Index has failed to confirm the weakness in EUR/USD.
This can indicate dollar weakness and potential accumulation in EUR/USD.
SMT Can Reveal False Breakouts
One of the strongest applications of SMT is identifying potential false breakouts.
Suppose GBP/USD trades above an old high.
Retail traders may interpret the movement as a bullish breakout.
The price chart may show:
Old High → Breakout → Higher High
However, the ICT trader compares the movement with DXY.
If GBP/USD creates a higher high but DXY refuses to create a lower low, the bullish breakout is not confirmed.
Huddleston explains:
“If you don’t see that, then you know that the false breakout on the upside in the foreign currency market, it’s all sucker play.”
Within the SMT framework, the move above the old high may be a run on buy stops.
The process may look like:
Old High → Buy Stops Above High → Price Trades Higher → DXY Fails to Confirm → SMT Divergence → Distribution → Reversal Lower
SMT therefore gives additional context to liquidity raids.
SMT and Smart Money Accumulation
SMT can help traders identify which market may be experiencing accumulation.
Suppose GBP/USD continues moving higher while DXY forms a higher low.
The lack of a new low in DXY can indicate underlying dollar strength.
The Dollar Index may be accumulated while GBP/USD is being pushed into premium prices.
The relationship is:
DXY Higher Low → Relative Strength → Potential Accumulation
GBP/USD Higher High → Buy-Side Liquidity Raid → Potential Distribution
This allows traders to study what smart money may be accumulating and what may be distributed.
Huddleston describes the purpose of this type of analysis as determining:
“What the smart money is accumulating or distributing.”
SMT and Smart Money Distribution
Distribution can become visible when one market appears exceptionally strong but the related market refuses to confirm the move.
For example:
GBP/USD rallies through an old high.
At the same time, DXY refuses to trade below its previous low.
GBP/USD may appear bullish.
However:
GBP/USD Higher High + DXY Higher Low = Non-Symmetrical Price Action
Within the SMT framework, the move higher in GBP/USD may provide liquidity for distributing long positions.
Buy stops above old highs provide willing buyers.
Price can trade into those buy stops before reversing lower.
The SMT divergence helps the trader question the apparent breakout strength.
Positive and Negative Correlation in SMT
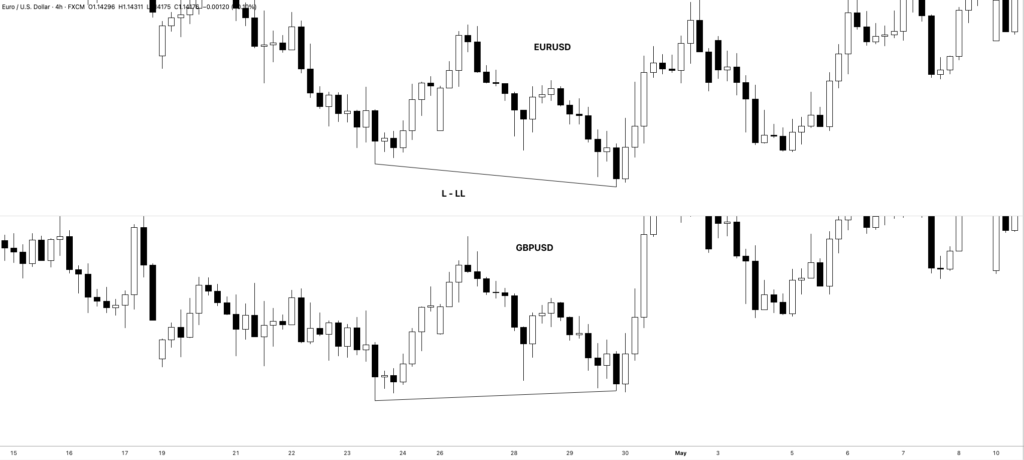
SMT can be applied to both positively correlated and inversely correlated markets.
Positively Correlated Markets
Positively correlated markets generally move in the same direction.
For example, when comparing two positively correlated assets:
Market A Makes Higher High
Market B Should Also Make Higher High
If Market B fails to make a higher high, SMT divergence may be present.
The same logic applies to lows:
Market A Makes Lower Low
Market B Should Also Make Lower Low
Failure in one market creates a divergence.
Inversely Correlated Markets
Inversely correlated markets generally move in opposite directions.
DXY and many USD-quoted foreign currencies are common examples in ICT Forex analysis.
The expected relationship is:
DXY Higher High ↔ Foreign Currency Lower Low
DXY Lower Low ↔ Foreign Currency Higher High
When one side fails to confirm the other, SMT divergence may be present.
How ICT Uses DXY for SMT Analysis
The US Dollar Index is particularly important for Forex SMT analysis.
The process is simple.
Choose the foreign currency pair being analyzed.
Then compare each important swing with DXY.
For example, when trading GBP/USD:
GBP/USD Creates Higher High → Check DXY
Ask:
Did DXY make a lower low?
If yes, the move is symmetrical.
If no, potential SMT divergence exists.
For bearish GBP/USD conditions:
GBP/USD Creates Lower Low → Check DXY
Ask:
Did DXY make a higher high?
If yes, the movement is confirmed.
If no, SMT divergence may indicate potential reversal conditions.
Huddleston explains:
“We compare every price swing in the dollar index with the foreign currency that we trade.”
The trader is effectively comparing the relative strength of both markets.
SMT as a Trend Confirmation Tool
Many traders only use SMT to find reversals.
However, SMT can also confirm trend continuation.
Suppose DXY makes a lower low while GBP/USD makes a higher high.
The market relationship is behaving as expected.
This symmetrical price action confirms dollar weakness and GBP/USD strength.
In this condition, aggressively selling GBP/USD simply because it appears overbought may be lower probability.
The sequence is:
DXY Lower Low + GBP/USD Higher High → Symmetry Confirmed → Current Direction Supported
Similarly:
DXY Higher High + GBP/USD Lower Low → Symmetry Confirmed → Bearish GBP/USD Direction Supported
SMT is therefore both a confirmation and divergence concept.
SMT as a Reversal Confirmation Tool
SMT becomes particularly valuable when market symmetry breaks near an important price level.
Suppose GBP/USD trades above an old daily high.
Buy-side liquidity is available above the high.
GBP/USD creates a higher high.
However, DXY creates a higher low instead of the expected lower low.
Now several factors align:
GBP/USD Buy-Side Liquidity Raid
DXY Failure to Make Lower Low
SMT Divergence
Potential Dollar Strength
This can strengthen the argument for a bearish GBP/USD reversal.
The same logic applies to bullish setups:
Foreign Currency Sell-Side Liquidity Raid
DXY Failure to Make Higher High
SMT Divergence
Potential Dollar Weakness
Possible Foreign Currency Rally
The divergence works best when supported by a clear market narrative.
SMT and Turtle Soup Setups
The ICT Smart Money Technique can also help anticipate a Turtle Soup or false breakout setup.
When market symmetry confirms the existing trend, a move through a short-term high or low may simply collect liquidity before continuation.
However, when SMT divergence appears at an old high or low, the probability of a false breakout can become more interesting.
For example:
GBP/USD Runs Above Old High → DXY Fails to Make Lower Low → SMT Divergence → Buy-Side Liquidity Taken → Potential Turtle Soup Short
For bullish conditions:
GBP/USD Runs Below Old Low → DXY Fails to Make Higher High → SMT Divergence → Sell-Side Liquidity Taken → Potential Turtle Soup Long
SMT provides the intermarket confirmation behind the liquidity event.
Use SMT With Higher Timeframe Context
SMT should not be treated as an automatic entry signal.
A divergence alone does not mean price must immediately reverse.
The trader should combine SMT with:
- Higher timeframe bias
- Daily or weekly liquidity
- Premium and discount
- ICT PD Arrays
- Old highs and lows
- Order blocks
- Fair Value Gaps
- Time-of-day concepts
For example:
Daily Resistance → GBP/USD Buy-Side Liquidity Raid → DXY SMT Divergence → Bearish Lower Timeframe Setup
This is stronger than simply identifying two mismatched swing highs.
The correct approach is:
Narrative → Liquidity Objective → SMT Confirmation → Entry Model
How to Find SMT Divergence Step by Step
Step 1: Select Related Markets
Choose closely correlated or inversely correlated markets.
For Forex, compare a foreign currency pair with DXY when appropriate.
Step 2: Identify Important Swing Points
Mark significant highs and lows on both charts.
Step 3: Compare the Same Period
Both price swings should be compared over the same time period.
Do not compare unrelated swings.
Step 4: Determine the Expected Relationship
Ask whether the markets should move together or inversely.
Step 5: Check for Symmetry
Did both markets produce the expected corresponding swings?
Step 6: Identify the Failure Swing
If one market fails to confirm, note which asset is displaying relative strength or weakness.
Step 7: Study Liquidity
Determine whether one market has raided an old high or old low.
Step 8: Apply Higher Timeframe Context
Look for support from daily bias, PD Arrays, and liquidity objectives.
Step 9: Wait for an ICT Entry Model
Use lower timeframe price action to execute the trade rather than entering solely because SMT appeared.
Example of Bearish SMT Logic
Suppose GBP/USD is approaching an old daily high.
Price trades above the high and creates a higher high.
Now compare DXY.
DXY does not create a lower low.
Instead, it forms a higher low.
The analysis becomes:
GBP/USD Higher High
DXY Higher Low
Expected Inverse Symmetry Fails
Dollar Shows Relative Strength
GBP/USD Takes Buy-Side Liquidity
Potential Bearish Reversal
The trader can then search for bearish ICT confirmation on GBP/USD.
Example of Bullish SMT Logic
Suppose EUR/USD trades below an important old low.
Price creates a lower low.
DXY should produce a higher high.
However, DXY forms a lower high.
The analysis becomes:
EUR/USD Lower Low
DXY Lower High
Expected Symmetry Fails
DXY Shows Relative Weakness
EUR/USD Takes Sell-Side Liquidity
Potential Bullish Reversal
The trader can then search for bullish confirmation.
Common Mistakes When Using SMT
Treating Every Different Swing as SMT
The markets must have a meaningful correlation or inverse relationship.
Randomly comparing unrelated assets does not create valid SMT analysis.
Comparing Different Time Periods
The highs and lows should correspond to the same market swing.
Using SMT Without Liquidity Context
SMT becomes more meaningful around important highs, lows, and higher timeframe objectives.
Entering Immediately at the Divergence
SMT provides information about relative strength and weakness.
It does not automatically define the exact entry price.
Ignoring Confirmed Symmetry
When correlated markets are confirming the current move, traders should be cautious about forcing reversal trades.
Final Thoughts
The ICT Smart Money Technique or SMT helps traders study the relationship between correlated and inversely correlated markets.
The basic principle is simple:
Expected Market Symmetry Present → Current Price Action Confirmed
Expected Market Symmetry Fails → Investigate Relative Strength or Weakness
A foreign currency making a higher high while DXY refuses to make a lower low can indicate underlying dollar strength.
A foreign currency making a lower low while DXY refuses to make a higher high can indicate underlying dollar weakness.
By comparing corresponding price swings, ICT traders can gain insight into potential accumulation, distribution, false breakouts, liquidity raids, and future directional movement.
SMT is most effective when combined with higher timeframe context, liquidity, ICT PD Arrays, and a clear market narrative. It should not replace price analysis. Instead, it acts as an intermarket confirmation tool that helps reveal when one market is telling a different story from another.