Defining Open Float Liquidity Pools is an important higher-timeframe concept in the ICT (Inner Circle Trader) methodology developed by Michael J. Huddleston. This concept is taught in ICT Mentorship Core Content – Month 5 and explains how traders can identify large fund liquidity resting above old highs and below old lows.
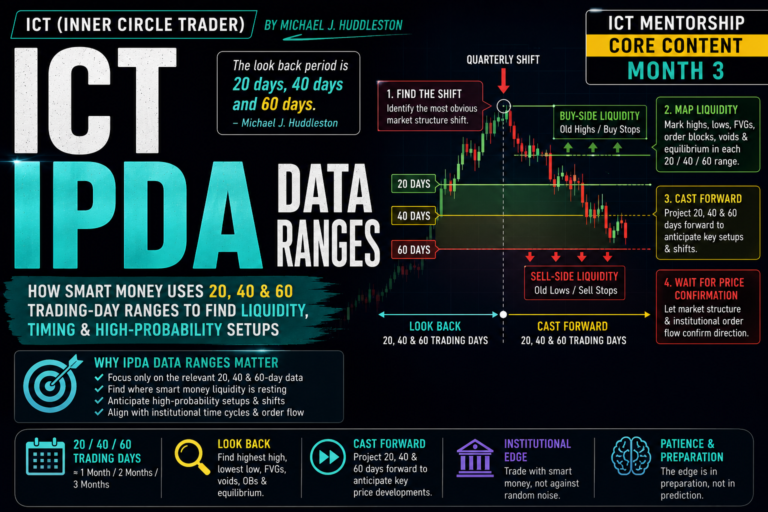
The main idea is to study a revolving range of trading days and identify where major buy stops and sell stops are likely resting. By monitoring which side of the market is continuously targeted, traders can also gain clues about institutional order flow and possible quarterly shifts in price.
What are Open Float Liquidity Pools?
Open Float Liquidity Pools are areas of liquidity identified from significant highs and lows formed within specific trading-day ranges.
In simple terms:
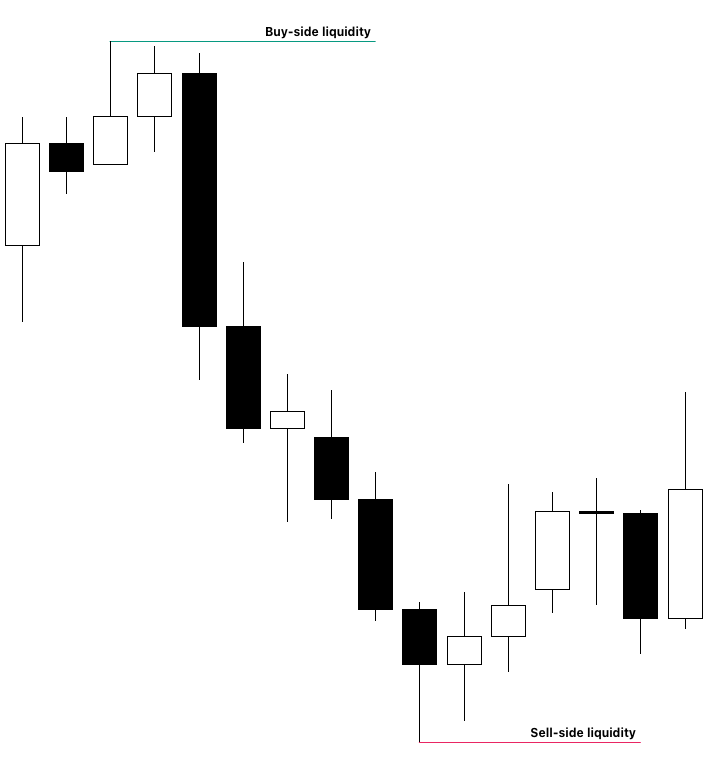
Buy-side liquidity rests above old highs.
Sell-side liquidity rests below old lows.
Large fund traders may have buy stops above important highs and sell stops below important lows. These levels can become attractive price objectives.
Michael J. Huddleston explains:
“Every 20 trading days there’s going to be a new liquidity pool formed.”
The purpose of Defining Open Float Liquidity Pools is to locate these obvious pools and study which side price is repeatedly reaching for.
What is Open Float in ICT?
In ICT, Open Float is studied by looking at a 60-trading-day look-back period and monitoring price for the next 60 trading days forward.
This creates a revolving window of approximately:
60 days backward + 60 days forward = 120 trading days
ICT describes it as:
“What you’re looking for is a revolving continuous range of 120 days.”
The historical 60-day range gives known highs and lows.
The future 60 days are not predicted in advance. Instead, the trader continuously monitors new highs and lows as price action forms.
The highest high and lowest low within this broader framework help define large fund liquidity objectives.
The 20, 40 and 60 Trading Day Ranges
The Open Float concept is separated into three important intervals.
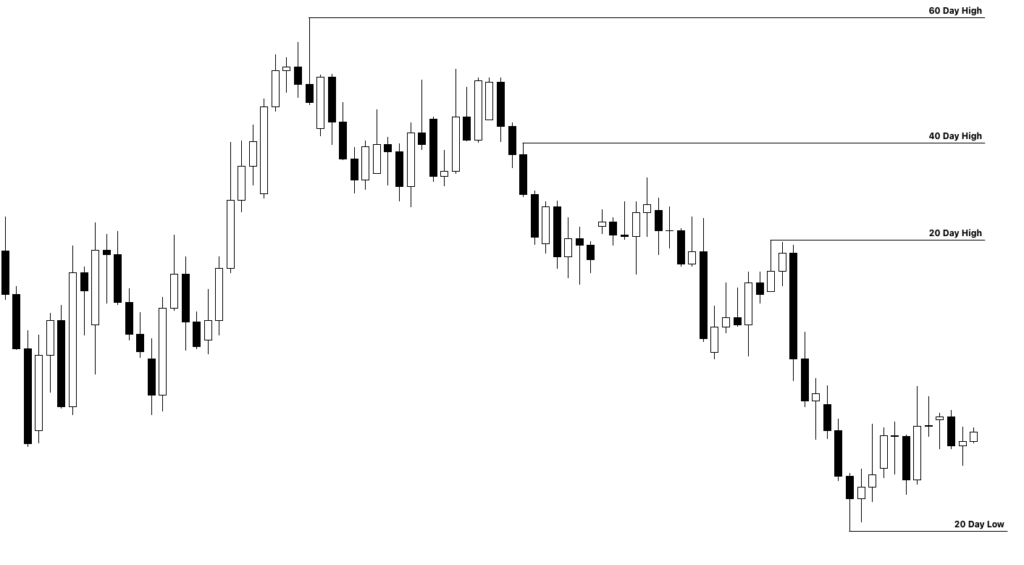
20-Day Open Float
The highest high and lowest low of the last 20 trading days.
This represents the near-term Open Float.
20-Day High → Buy Stops Above

20-Day Low → Sell Stops Below
These liquidity pools may be useful for shorter-term trading, day trades and intraday price objectives.
40-Day Open Float
The highest high and lowest low of the last 40 trading days.
This represents the short-term Open Float.
The 40-day range helps traders identify broader liquidity pools visible on the Daily chart.
60-Day Open Float
The highest high and lowest low of the last 60 trading days.
This represents the intermediate-term Open Float.
These levels are more important when studying larger fund liquidity and higher-timeframe price delivery.
The basic structure is:
20 Days → Near-Term Liquidity

40 Days → Short-Term Liquidity

60 Days → Intermediate-Term Liquidity
How to Define Open Float Liquidity Pools
The process can be done directly on the Daily chart.
Step 1. Start from a Reference Date
Select the current date or the beginning of a new month.
For example, assume the reference date is August 1.
Step 2. Look Back 20 Trading Days
Find the most obvious high and low formed within the previous 20 trading days.
Mark:
- Buy-side liquidity above the high
- Sell-side liquidity below the low
Step 3. Look Back 40 Trading Days
Expand the range to the previous 40 trading days.
Identify the highest high and lowest low.
These levels define the short-term Open Float liquidity pools.
Step 4. Look Back 60 Trading Days
Now identify the highest high and lowest low of the previous 60 trading days.
These levels create the intermediate-term liquidity boundaries.
Step 5. Monitor New 20-Day Intervals
As price moves forward, study every new 20-trading-day interval.
Mark new significant highs and lows as they form.
The trader does not need to forecast exactly where the future high or low will be.
Simply monitor new price swings and compare them with the previous 20-, 40- and 60-day ranges.
How Open Float Shows Institutional Order Flow
One of the most important uses of Defining Open Float Liquidity Pools is identifying institutional order flow.
Study which liquidity pool price continuously attacks.
Bullish Institutional Order Flow
Suppose price repeatedly trades above old highs and takes buy-side liquidity.
At the same time, sell-side liquidity below important lows is rarely taken.
This suggests bullish institutional order flow.
Old High Taken
      ↓
New High Forms
      ↓
Another Buy-Side Pool Taken
      ↓
Higher Price Delivery
ICT explains the logic very clearly:
“If it keeps taking out the buy stops or the highs, the market is doing what? It’s moving higher.”
In this condition, traders should be careful about continuously trying to sell the market.
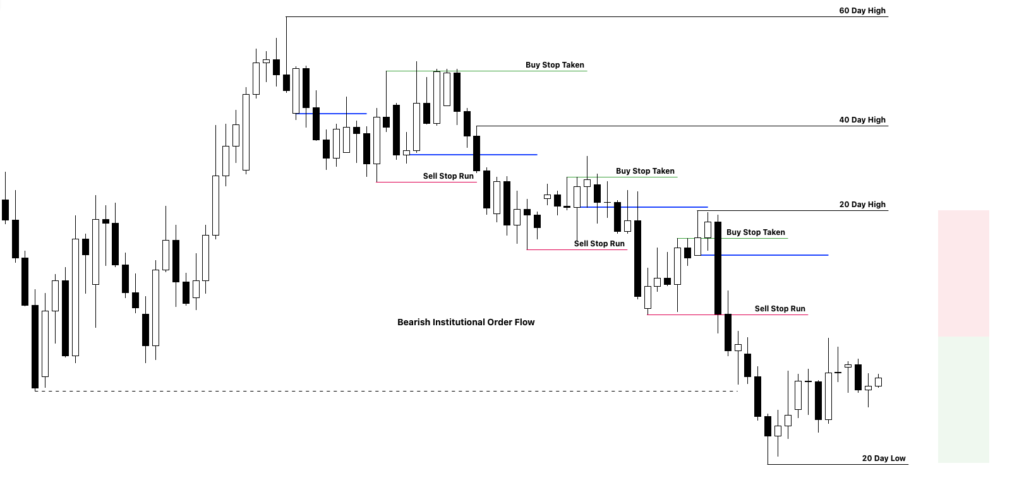
Bearish Institutional Order Flow
The opposite applies when price repeatedly takes sell-side liquidity.
Old Low Taken
      ↓
New Low Forms
      ↓
Another Sell-Side Pool Taken
      ↓
Lower Price Delivery
If sell stops continue to be raided while buy-side liquidity is rarely reached, institutional order flow may be bearish.
In this condition, the trader can focus more on bearish opportunities.
Open Float and Quarterly Shifts
Open Float can also provide clues about a possible quarterly shift.
Suppose price has continuously traded higher and repeatedly taken buy-side liquidity.
Eventually, price reaches an extreme relative to the previous 60-day range.
Now the trader starts seeing sell-side liquidity taken instead of buy-side liquidity.
This change in liquidity delivery can indicate that market conditions are changing.
Example:
Buy Stops Continuously Taken
        ↓
Price Reaches 60-Day Extreme
        ↓
Sell Stops Begin Getting Taken
        ↓
Possible Quarterly Shift
The opposite can happen in a bearish market.
If price is below the previous 60-day low and deeply discounted, then starts aggressively taking buy-side liquidity, a change in higher-timeframe price delivery may be developing.
This does not mean every liquidity raid creates a reversal.
The important factor is the change in which side of liquidity price continuously targets.
Why 20-Day Highs and Lows are Important
ICT connects the 20-trading-day range with the tendency of large traders and trend-following systems to focus on significant breakout levels.
A 20-day high can naturally attract breakout buyers and place buy stops above the market.
A 20-day low can attract bearish breakout activity and create sell stops below the market.
These old highs and lows therefore become important liquidity pools.
Sometimes price moves through these levels and continues.
Other times price briefly breaks the level, takes the liquidity and quickly rejects.
This false break can create a possible Turtle Soup-type liquidity raid.
The trader should study how price reacts after the liquidity pool is taken.
How to Use Open Float Liquidity Pools in Trading
Open Float should first be used as a higher-timeframe liquidity framework.
Start on the Daily chart.
Mark the important:
- 20-day high and low
- 40-day high and low
- 60-day high and low
Then ask:
Which side of liquidity is price continuously taking?
If buy-side liquidity is continuously taken, focus on bullish institutional order flow.
If sell-side liquidity is continuously taken, focus on bearish institutional order flow.
Next, identify the nearest logical liquidity objective.
For example:
Bullish Institutional Order Flow
        ↓
Retracement into Discount
        ↓
Bullish Higher Timeframe PD Array
        ↓
Price Expands Higher
        ↓
20-Day or 40-Day Buy-Side Liquidity
For a bearish market:
Bearish Institutional Order Flow
        ↓
Retracement into Premium
        ↓
Bearish Higher Timeframe PD Array
        ↓
Price Expands Lower
        ↓
20-Day or 40-Day Sell-Side Liquidity
The Open Float liquidity pool can therefore act as a possible draw on liquidity or exit objective.
Open Float Liquidity Pools for Day Trading
Although Open Float is studied on the Daily chart, the information can also help intraday traders.
The 20-day range gives near-term liquidity objectives.
Suppose the higher-timeframe institutional order flow is bullish and price is continuously attacking old highs.
An intraday trader can use lower-timeframe ICT concepts to find bullish entries while targeting an important 20-day high.
Possible lower-timeframe confirmation may include:
- Liquidity sweep
- Market Structure Shift
- Displacement
- Fair Value Gap
- Order Block
The Daily Open Float gives the broader price objective.
The lower timeframe helps with execution.
Common Mistakes When Defining Open Float Liquidity Pools
Only marking the 60-day highest high and lowest low: ICT also studies the important highs and lows within the 20- and 40-day intervals.
Trying to predict future highs and lows: The next 60 days are monitored as price develops. The trader does not know the future price range in advance.
Ignoring repeated liquidity raids: Which side of the market continuously gets taken provides important information about institutional order flow.
Trading against higher-timeframe flow: Continuously selling while price repeatedly attacks buy-side liquidity can place the trader against bullish price delivery.
Using random swing highs and lows: Focus on obvious highs and lows formed within the respective 20-, 40- and 60-trading-day ranges.
Final Thoughts
Defining Open Float Liquidity Pools helps ICT traders locate large fund buy-side and sell-side liquidity using the 20-, 40- and 60-trading-day ranges.
The 20-day range defines near-term liquidity.
The 40-day range defines short-term liquidity.
The 60-day range defines intermediate-term liquidity.
By continuously monitoring which highs and lows are being taken, traders can develop a clearer understanding of ICT institutional order flow.
When buy stops are continuously targeted, price delivery may be bullish. When sell stops are continuously targeted, price delivery may be bearish.
The main purpose of Open Float is not to predict every future market move. It is to identify where important liquidity is resting, which side price is seeking, and when the liquidity delivery may begin to shift.