ICT IPDA Data Ranges is an advanced higher timeframe analysis concept taught by Michael J. Huddleston, the founder of ICT (Inner Circle Trader). This concept is taught in ICT Mentorship Core Content – Month 5 and explains how traders can use specific 20, 40 and 60 trading-day ranges to identify liquidity, institutional price references, and potential future setup windows.
Many traders identify an old high and immediately expect price to attack it.
Others see an old low and assume sell-side liquidity below it must be the next target.
The problem is that a chart can contain hundreds of old highs and lows.
Which high should matter?
Which low should matter?
Which Fair Value Gap should price seek?
Which order block is more important?
ICT IPDA Data Ranges provides a framework for narrowing the price data the trader should study.
Michael J. Huddleston explains the core idea:
“The look back period is 20 days, 40 days and 60 days.”
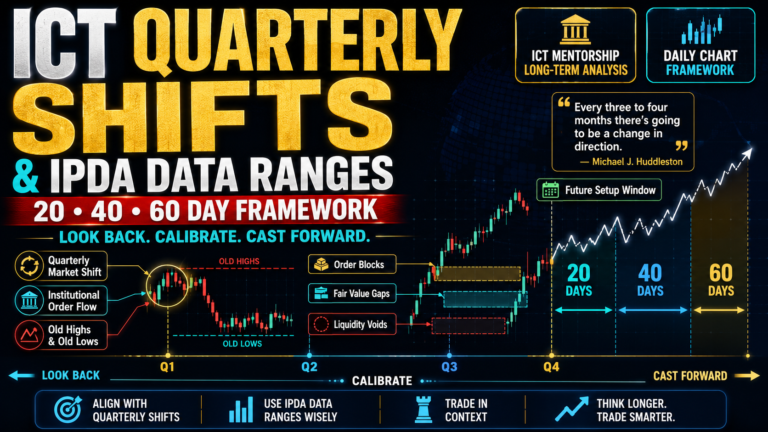
The trader first identifies a significant Market Structure Shift. From a calibrated reference point, price data is studied 20, 40 and 60 trading days into the past and projected 20, 40 and 60 trading days into the future.
The goal is not to predict an automatic reversal on day 20, 40, or 60.
The real purpose is to know where to look for liquidity and when to become more attentive to a significant Daily price setup.
What Are ICT IPDA Data Ranges?
In ICT terminology, IPDA refers to the Interbank Price Delivery Algorithm.
The ICT IPDA Data Ranges framework studies three primary periods of Daily price data:
20 trading days
40 trading days
60 trading days
These are trading days, not calendar days.
Approximately:
20 trading days represent one trading month.
40 trading days represent two trading months.
60 trading days represent three trading months.
The trader studies the highs, lows, imbalances, liquidity, and institutional reference points created inside these ranges.
The basic idea is:
Find a major Market Structure Shift
Then:
Calibrate the beginning of the shift month
Then:
Look back 20, 40 and 60 trading days
Then:
Identify liquidity and institutional price references
Then:
Cast forward 20, 40 and 60 trading days
Then:
Anticipate a significant setup or change in price condition
The data ranges help organize price into a structured and measurable framework.
ICT IPDA Data Ranges Do Not Predict a Reversal Every 20 Days
One of the biggest misunderstandings about ICT IPDA Data Ranges is assuming that price must reverse every 20, 40 or 60 trading days.
That is not the concept.
Huddleston clearly explains:
“Some of you are thinking that it’s going to call the high and low 20 days, 40 days and 60 days away. That’s not what happens.”
Sometimes a significant high or low can form extremely close to a 20, 40 or 60-day reference.
But the number itself is not a buy or sell signal.
The ranges create a time framework.
For example, after a major bearish Quarterly Shift, price may continue lower for approximately 20 trading days.
At the 20-day area, the market may consolidate.
If a significant counter-directional move does not develop, the trader continues studying price toward the 40-day range.
Around the 40-day period, price may reach major support, run sell-side liquidity, and shift bullishly.
In another market, the major development may not occur until closer to the 60-day range.
The trader is anticipating a setup inside the data range, not blindly trading the exact numbered day.
Start With the Daily Chart
ICT IPDA Data Ranges are primarily studied on the Daily Chart.
The Daily timeframe provides enough price data to develop a three-month directional framework.
Lower timeframes can later be used for execution.
The trader should initially focus on:
- Daily Market Structure
- Quarterly Shifts
- Major displacement
- Old highs and lows
- Fair Value Gaps
- Liquidity voids
- Order blocks
- Equilibrium
The Daily Chart gives the macro context.
A 4-hour, 1-hour, or 15-minute chart can later refine the setup.
Starting on a 5-minute chart and counting 20, 40 and 60 candles is not the concept taught in this framework.
The standard IPDA analysis is based on trading days on the Daily Chart.
Find the Most Obvious Quarterly Market Shift
The first major step is identifying a clear Market Structure Shift.
Look back approximately three to six months.
Ask:
Where is the most obvious significant change in price delivery?
The shift may be bearish.
Price was moving higher.
Buy-side liquidity was taken.
A significant Daily low was then violated.
Strong bearish displacement developed.
Or the shift may be bullish.
Price was trading lower.
Sell-side liquidity was attacked.
A significant Daily high was violated.
Strong bullish displacement appeared.
Do not force a Market Structure Shift onto the chart.
Huddleston emphasizes finding the most obvious example.
The price move should clearly show that the market changed its previous condition.
The sequence may look like:
Bullish price delivery
Then:
Buy-side liquidity run
Then:
Daily low violated
Then:
Bearish displacement
This can establish a bearish Quarterly Shift.
The bullish model is simply reversed.
Why the Quarterly Shift is Important
The Market Structure Shift gives the IPDA Data Range a starting context.
Suppose a major bearish shift developed during November.
The trader now has evidence that price entered a sell profile.
The market may continue lower until it reaches a significant level capable of creating:
- A bullish correction
- Consolidation
- A larger reversal
The previous Quarterly Shift helps the trader understand the price profile currently being studied.
Without this shift, randomly marking 20, 40 and 60-day ranges can create confusion.
The sequence should be:
Identify the shift first
Then:
Calibrate the data range
The Quarterly Shift provides the directional background for the IPDA analysis.
How to Calibrate ICT IPDA Data Ranges
Once the most obvious Quarterly Market Shift has been identified, determine the month in which that shift occurred.
Then move to the first trading day of that month.
This becomes the calibration reference.
For example:
A major Market Structure Shift develops during the second week of November.
Do not begin counting from the exact shift candle.
Go back to the beginning of November.
The first trading day of November becomes the reference point.
Huddleston explains that once the shift is identified:
“You gotta roll back to the beginning of that month.”
This creates a consistent numerical reference for the data range.
The trader can now perform the lookback and cast-forward process.
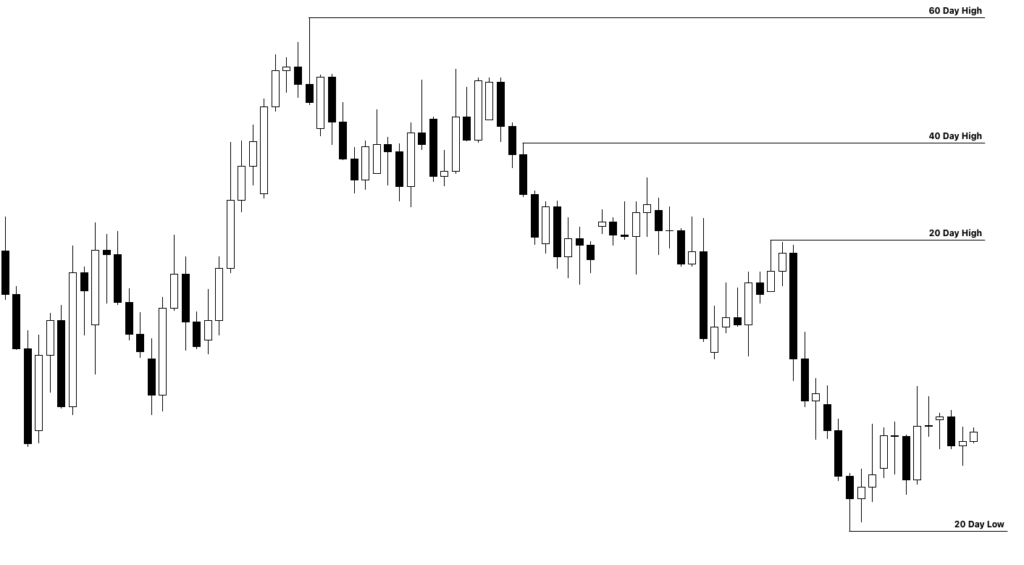
The 20 Trading-Day Lookback
From the calibrated reference point, count 20 trading days to the left.
Now study the price action inside that 20-day range.
Identify:
The highest high
The lowest low
Above the highest high, buy-side liquidity may be present.
Below the lowest low, sell-side liquidity may be present.
Also study:
- Fair Value Gaps
- Liquidity voids
- Consolidations
- Order blocks
- Equilibrium levels
The 20-day lookback shows the most recent approximately one month of institutional price delivery.
The trader should not simply mark the most recent swing high or swing low.
The specific question is:
What is the highest high and lowest low inside this 20 trading-day data range?
These levels provide possible liquidity pools.
The 40 Trading-Day Lookback
Next, count 40 trading days to the left of the calibrated reference point.
Again identify:
The highest high
The lowest low
Then mark the important institutional references inside the range.
The 40-day range contains approximately two months of Daily price data.
A high or low inside the 40-day range may be more significant than the levels identified inside the 20-day range.
Suppose buy-side liquidity above the 20-day high has already been taken.
The 40-day high remains unviolated.
The market may continue higher toward the larger liquidity pool.
The same principle applies to sell-side liquidity.
If the 20-day low has already been cleared but the 40-day low remains intact, the lower level may become the next important draw.
The 60 Trading-Day Lookback
The 60 trading-day lookback provides approximately three trading months of Daily price information.
Identify:
The highest high in the last 60 trading days
and
The lowest low in the last 60 trading days
According to the ICT framework, these price levels can contain significant liquidity.
Above the 60-day high may be buy stops.
Below the 60-day low may be sell stops.
The 60-day range is the broader standard IPDA lookback.
The trader also studies every important institutional price reference inside this data sample.
Huddleston explains:
“Last 60 days, where’s the high and the low? Last 40 days, where’s the high and the low? Last 20 days, where’s the high and the low?”
This is the basic IPDA liquidity-mapping process.
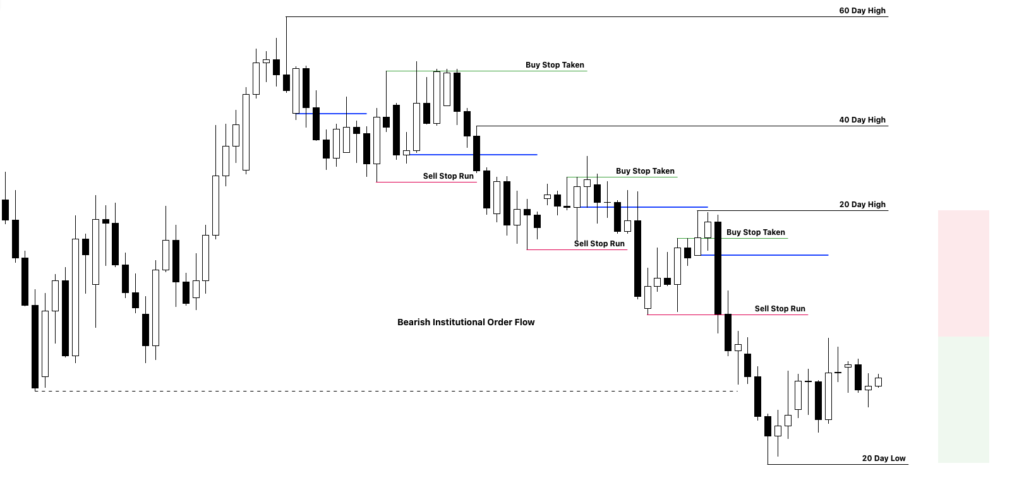
What Should You Mark Inside Each IPDA Data Range?
ICT IPDA Data Ranges are not only about the highest high and lowest low.
The trader should also identify institutional reference points.
Inside the 20, 40 and 60-day ranges, mark:
Old Highs
Old highs may contain buy-side liquidity.
Short traders may have protective buy stops above the high.
Breakout traders may also enter long above the high.
Old Lows
Old lows may contain sell-side liquidity.
Long traders may protect positions with sell stops below the low.
Breakdown traders may enter short below the level.
Fair Value Gaps
A Fair Value Gap indicates an imbalance in price delivery.
Price may later return to rebalance the range.
Liquidity Voids
A large one-sided price delivery may create a range where price was not efficiently offered in both directions.
The market may later return into the void.
Bullish and Bearish Order Blocks
Order blocks can provide important reaction areas when price is delivering toward an IPDA liquidity objective.
Consolidations
Consolidation ranges can identify equilibrium areas.
When price is not expanding, it may gravitate around these balanced price ranges.
Equilibrium
The midpoint of an important price range can become a reference for retracement and rebalancing.
The trader is trying to identify what price created inside the recent data.
IPDA Data Ranges Help Select the Correct Liquidity Pool
One of the most useful applications of ICT IPDA Data Ranges is deciding which old high or old low should be monitored.
Suppose the chart contains ten old highs.
A trader may ask:
Which high will price seek?
The IPDA framework narrows the question.
Where is the highest high in the last 20 trading days?
Where is the highest high in the last 40 trading days?
Where is the highest high in the last 60 trading days?
These are known liquidity references.
The same process applies to lows.
Where is the lowest low of the 20-day range?
Where is the lowest low of the 40-day range?
Where is the lowest low of the 60-day range?
Instead of randomly choosing visually attractive swings, the trader studies specific data samples.
IPDA Data Ranges and Open Float
The concept is closely related to ICT Open Float.
Open Float is the open buying and selling interest above and below the current market price.
Buy stops may be resting above old highs.
Sell stops may be resting below old lows.
The IPDA Data Range tells the trader which price ranges should be studied for this liquidity.
Suppose the last 20-day high remains unviolated.
There may be buy-side Open Float above the level.
Suppose the 40-day low remains intact.
Sell-side Open Float may exist below the low.
The trader then combines this liquidity map with Institutional Order Flow.
The IPDA range identifies where liquidity may exist.
Institutional Order Flow helps determine which side price may seek.
IPDA Data Ranges Do Not Give Directional Bias Alone
This is another important rule.
The fact that buy stops exist above the 20-day high does not automatically mean price will go higher.
The fact that sell stops exist below the 60-day low does not automatically mean price will go lower.
The data ranges identify reference points.
Directional bias must come from additional analysis.
Study:
- Quarterly Market Shift
- Market Structure
- Institutional Order Flow
- Higher timeframe support or resistance
- Premium and discount
- SMT divergence
- Open interest where available
Huddleston explains that the 20, 40 and 60-day references are used to find where stops would logically rest.
The trader still needs evidence showing which direction price is delivering.
How to Use Institutional Order Flow With IPDA Data Ranges
Suppose the Daily Chart has shifted bullishly.
Price continues making meaningful upside progress.
Intermediate-term lows are protected.
The 20-day high is taken.
Price continues higher.
The 40-day high remains above current market price.
The trader can anticipate that the larger buy-side liquidity pool may still be the draw.
The market may seek the 40-day high.
If that level is also taken, the 60-day high may become important.
The sequence can be:
Bullish Quarterly Shift
Then:
20-day buy-side liquidity taken
Then:
Bullish Institutional Order Flow continues
Then:
40-day high becomes the objective
Then:
60-day liquidity may become the larger draw
The bearish process is reversed.
What Happens When All 60-Day Liquidity Has Been Cleared?
An important part of ICT IPDA Data Ranges is knowing what to do when liquidity inside the standard 60-day lookback has already been taken.
Suppose price has cleared:
- The 20-day high
- The 40-day high
- The 60-day high
The major buy-side liquidity references inside the normal lookback have been removed.
What is next?
Look outside the 60-day range.
Find the next important higher high.
In a bearish condition, if the 20, 40 and 60-day lows have already been cleared, identify the next major lower low outside the 60-day data range.
Huddleston explains that when liquidity in the normal range has already been cleaned out, price may make a larger movement toward the next external reference.
This can help anticipate an explosive price move.
Why Price Can Make a Large Expansion Outside the 60-Day Range
Suppose all sell-side liquidity inside the 60-day range has been taken.
The market remains bearish.
No major lower liquidity pool remains inside the standard IPDA lookback.
However, a significant old low exists just outside the 60-day range.
The market may accelerate toward that low.
The next available liquidity pool is farther away.
This can produce a larger price expansion.
The sequence becomes:
60-day internal sell-side liquidity cleared
Then:
Bearish Institutional Order Flow remains
Then:
Next old low outside the 60-day range identified
Then:
Price accelerates toward external sell-side liquidity
The same can occur on the upside when buy-side liquidity inside the 60-day range has already been removed.
What is the ICT Cast-Forward Range?
After the lookback, the trader uses the same 20, 40 and 60 trading-day measurements in the future.
This is called the cast forward.
From the calibrated first trading day of the Quarterly Shift month, project:
20 trading days forward
40 trading days forward
60 trading days forward
The future range provides a time horizon for studying the next significant Daily price development.
The trader is not forecasting an exact top or bottom.
The trader is anticipating that a meaningful setup, correction, consolidation, or Market Structure Shift may develop inside these ranges.
The 20-Day Cast Forward
The first future range extends 20 trading days from the calibration point.
During this period, study how price is interacting with the liquidity identified in the lookback.
Price may:
- Reach an old high
- Reach an old low
- Close a Fair Value Gap
- Enter a liquidity void
- Begin consolidation
- Show a new Market Structure Shift
Suppose the market has entered a bearish profile after the Quarterly Shift.
During the first 20 trading days, price declines and then enters consolidation.
A counter-directional reversal does not necessarily need to occur.
The consolidation itself can represent a change in price condition.
The trader continues monitoring the 40-day range.
The 40-Day Cast Forward
The 40-day projection extends the study to approximately two trading months after the calibrated reference.
A significant level may be reached inside this range.
For example, price may approach major Weekly support.
Sell-side liquidity may be cleared.
A bullish Market Structure Shift may then begin.
The setup does not need to form exactly on the 40th trading day.
It may develop several days before or after the numerical reference.
What matters is that price is inside the broader 40-day data range and is showing the expected institutional characteristics.
The price action confirms the setup.
The number provides the time framework.
The 60-Day Cast Forward
The 60-day cast-forward range provides approximately three trading months of future price context.
ICT associates this broader period with the Quarterly Shift framework.
A significant intermediate-term high or low may develop before the 60-day period is complete.
A new liquidity pool may form.
A major correction may begin.
The market may also transition into consolidation.
The 60-day future range helps the trader avoid assuming that the present direction will continue indefinitely.
Huddleston explains that markets do not trade in straight lines.
The IPDA cast forward reminds the trader to begin watching for the next significant change in condition.
The 20, 40 and 60-Day Ranges Are Windows, Not Deadlines
This point is extremely important.
Day 20 is not a mandatory reversal day.
Day 40 is not an automatic buy or sell signal.
Day 60 is not a guaranteed Quarterly Shift.
Think of the ranges as windows of study.
Suppose price is approaching the 40-day cast-forward reference.
At the same time:
Sell-side liquidity is being taken.
Price has reached a Weekly bullish order block.
A Daily down candle is violated on the upside.
Bullish displacement appears.
Now the 40-day range has context.
Without these price characteristics, the number 40 alone has little practical value.
The best IPDA analysis combines time with price.
Using Monthly and Weekly Charts With IPDA Data Ranges
Although IPDA Data Ranges are calibrated from the Daily Chart, higher timeframes can improve the analysis.
Suppose the 40-day cast-forward period is approaching.
Price is declining.
On the Weekly Chart, an old bullish order block is present.
The Daily Chart reaches that Weekly range.
Sell-side liquidity below a 40-day low is taken.
Price strongly rejects.
The confluence becomes more meaningful.
The trader now has:
40-day IPDA range
Weekly bullish institutional reference
Sell-side liquidity taken
Daily Market Structure Shift
The higher timeframe level helps explain why the Daily IPDA setup may become significant.
Using Futures Data With Forex IPDA Analysis
In the Australian dollar example, Huddleston emphasizes studying the underlying currency futures contract alongside the Forex pair.
Forex traders often analyse only the spot currency chart.
However, exchange-traded futures can provide additional data such as centralized volume and open interest.
The price structure of the Australian dollar futures contract can then be compared with AUD/USD.
The charts may appear broadly similar, but the futures market can provide additional information not available from decentralized spot Forex volume.
ICT uses this additional information to study institutional accumulation and distribution.
IPDA Data Ranges and Open Interest
Open interest can provide another layer of analysis when studying futures.
Open interest represents the number of open contracts in the market.
In the Australian dollar example, Huddleston studied price behavior alongside open interest.
Price had been trading inside a broad consolidation.
A bearish Market Structure Shift developed.
The market moved lower.
Open interest also declined during the bearish move.
The interpretation presented in the lesson was that earlier short exposure was being reduced as price moved lower.
At major higher timeframe support, a significant drop in open interest was studied as part of the bullish narrative.
The IPDA Data Range identified the time and liquidity framework.
The higher timeframe support identified the price location.
Open interest provided another clue about institutional positioning.
The Australian Dollar IPDA Data Range Example
The Australian dollar example gives a practical view of how the concept is applied.
A major bearish Quarterly Shift developed during November 2016.
The market had moved above equal highs and taken buy-side liquidity.
Price then shifted bearishly.
The first trading day of November became the calibration reference.
From this point, 20, 40 and 60 trading-day ranges could be studied.
Price moved lower.
Around the 40-day cast-forward region, the Australian dollar approached the 71.50 area.
This level was also significant on the Weekly Chart.
Previous bullish price reactions had developed from the broader range.
The market then began moving higher.
The lesson emphasizes that the important point is not simply that a low formed near day 40.
The larger framework included:
A previous Quarterly Shift
A 40-day cast-forward range
Higher timeframe support
A significant price level
Developing bullish Market Structure
The data range helped determine where the trader should focus attention.
IPDA Data Ranges and Bullish Order Blocks
Once the higher timeframe framework suggests bullishness, lower Daily order blocks can be studied.
Suppose a Daily down candle forms.
Price later trades above the high of that down candle.
The candle becomes a bullish order block in the ICT framework.
If price returns to the body of the candle, the area may provide support.
In the Australian dollar example, bullish order blocks were used after the larger IPDA framework suggested that price could move higher.
Price retraced into the bullish order block.
The level showed sensitivity.
The market then expanded higher and closed a Fair Value Gap.
The IPDA Data Range provided the macro framework.
The order block refined the price area.
IPDA Data Ranges and Fair Value Gaps
Fair Value Gaps should be marked inside the 20, 40 and 60-day lookback ranges.
Suppose price has shifted bullishly.
A Fair Value Gap remains above current price.
Buy-side liquidity is also present above equal highs.
The IPDA analysis shows that these references exist inside the relevant data range.
Price may move higher to close the imbalance and then continue toward the liquidity.
In a bearish setup, a Fair Value Gap below price may provide a downside objective.
The trader should ask:
Where are the gaps in the last 20 days?
Where are the gaps in the last 40 days?
Where are the gaps in the last 60 days?
These imbalances become part of the IPDA map.
IPDA Data Ranges and Liquidity Voids
Liquidity voids are another important reference.
A liquidity void is created when price moves aggressively through a range with one-sided delivery.
The market may later return to rebalance the range.
When studying the IPDA lookback, identify liquidity voids inside the 20, 40 and 60-day samples.
Suppose price shifts bearishly.
A large liquidity void remains below.
The market may retrace into a bearish institutional level and then continue lower to close the void.
The void gives the trader a logical price objective.
The cast-forward range gives the trader a time framework for monitoring the setup.
IPDA Data Ranges and Equilibrium
Consolidations inside the IPDA range can provide equilibrium price references.
Huddleston explains that the trader should study where consolidation occurred during the last 20, 40 and 60 trading days.
These balanced price areas can become important when the market is not ready to expand.
Suppose the market has reached equilibrium.
No large external liquidity objective is immediately being attacked.
Price may remain sideways.
This can help the trader determine when not to expect significant Daily range expansion.
The IPDA framework is therefore not only used to forecast directional moves.
It can also help identify conditions where price may consolidate.
How IPDA Data Ranges Help With Turtle Soup
A common question is:
How do I know whether an old high will create a Turtle Soup Sell or whether price will continue higher?
IPDA Data Ranges help place the old high in context.
Suppose price takes the 20-day high.
The 40-day and 60-day highs remain above.
Institutional Order Flow is bullish.
Price is gaining new upside ground.
The 20-day high may only be an intermediate liquidity objective.
Selling the first old-high violation may be premature.
Now consider another condition.
The 20, 40 and 60-day buy-side liquidity has already been taken.
Price reaches a major higher timeframe bearish reference.
A small short-term high is violated.
Price cannot gain meaningful new ground.
A bearish Market Structure Shift appears.
The short-term high violation may have a greater probability of becoming a Turtle Soup Sell.
The IPDA framework helps determine whether more liquidity remains in the breakout direction.
How to Apply ICT IPDA Data Ranges Step by Step
Step 1. Open the Daily Chart
Use Daily price data for the standard IPDA analysis.
Step 2. Look Back Three to Six Months
Find the most obvious major bullish or bearish Market Structure Shift.
Step 3. Identify the Shift Month
Determine the calendar month where the significant shift developed.
Step 4. Return to the First Trading Day of That Month
Use this date as the calibration reference.
Step 5. Mark 20 Trading Days Back
Identify the highest high, lowest low, liquidity, gaps, order blocks, and equilibrium.
Step 6. Mark 40 Trading Days Back
Repeat the same process.
Step 7. Mark 60 Trading Days Back
Map the broader three-month liquidity and institutional references.
Step 8. Determine Institutional Order Flow
Decide whether current price delivery is showing bullish or bearish characteristics.
Step 9. Identify Which Liquidity Remains
Have the 20-day highs or lows already been taken?
What remains inside the 40-day range?
What remains inside the 60-day range?
Step 10. Look Outside 60 Days When Necessary
If all important liquidity inside the 60-day range has been cleared, identify the next external high or low.
Step 11. Cast Forward 20 Trading Days
Monitor for a significant setup or change in price condition.
Step 12. Cast Forward 40 and 60 Trading Days
Continue monitoring for a Quarterly Shift, correction, consolidation, or new Market Structure Shift.
Step 13. Add Monthly and Weekly Context
Look for important higher timeframe institutional reference points.
Step 14. Refine the Trade on Lower Timeframes
Once the Daily framework is clear, move to the 4-hour, 1-hour, or 15-minute chart for execution.
How to Use IPDA Data Ranges for Day Trading
ICT IPDA Data Ranges are higher timeframe concepts, but a day trader can still use them.
Suppose the Daily IPDA framework indicates bullish Institutional Order Flow.
The 40-day high remains untapped.
Price is expected to seek buy-side liquidity.
The day trader can focus on intraday buying opportunities.
During London or New York, the trader may look for:
- Sell-side liquidity run
- Bullish order block
- Bullish Fair Value Gap
- Breaker
- Turtle Soup Long
The intraday setup is traded in alignment with the larger Daily liquidity objective.
The trader is not holding the position for 40 days.
The 40-day data range simply provides directional context.
How to Use IPDA Data Ranges for Swing Trading
A swing trader can use the framework more directly.
Suppose a bearish Quarterly Shift occurs.
The 20-day low is taken.
The 40-day low remains below current price.
A Daily retracement enters a bearish order block.
The trader may look for a short setup targeting the 40-day sell-side liquidity.
If the 40-day low is cleared and bearish Institutional Order Flow continues, the 60-day low may become the next objective.
The trader can manage the position between known IPDA liquidity pools.
The Importance of Waiting for the Setup
One of the strongest lessons connected with ICT IPDA Data Ranges is patience.
Higher timeframe setups require time.
A price objective identified today may take:
Three days.
One week.
Two weeks.
Or several trading weeks.
Huddleston explains that traders need to learn how long these ideas take to develop.
The trader should not assume that because a 60-day high has been identified, price must reach the level tomorrow.
The data range gives the trader an area of focus.
Price still needs time to deliver.
This is why chart journaling is useful.
Record:
When the level was identified
Why the level was important
How many trading days price took to reach it
What price did after reaching the level
This develops real anticipatory skill.
Common Mistakes With ICT IPDA Data Ranges
The first mistake is counting calendar days instead of trading days.
The concept uses trading days.
The second mistake is expecting an automatic reversal on day 20, 40 or 60.
These are study ranges, not automatic trade signals.
The third mistake is counting from a random Daily candle.
First identify the significant Quarterly Market Shift and calibrate the beginning of its month.
The fourth mistake is marking only the most recent high and low.
Study the specific highs and lows inside the 20, 40 and 60-day ranges.
The fifth mistake is using IPDA Data Ranges as directional bias by themselves.
Combine them with Institutional Order Flow and Market Structure.
The sixth mistake is ignoring liquidity already taken.
Know which 20, 40 and 60-day highs and lows have been cleared.
The seventh mistake is ignoring price outside the 60-day range.
When internal liquidity has already been removed, the next external high or low may create a larger price objective.
The eighth mistake is ignoring higher timeframe reference points.
Monthly and Weekly order blocks can strengthen the Daily IPDA analysis.
The ninth mistake is forcing an immediate trade.
IPDA analysis requires the trader to wait for price to reach the anticipated level and form a setup.
Final Thoughts
ICT IPDA Data Ranges teaches traders how to organize Daily price data into 20, 40 and 60 trading-day reference ranges.
The analysis begins by identifying the most obvious Quarterly Market Shift during the previous three to six months.
Once the shift is found, move back to the first trading day of the month where the shift occurred.
This becomes the calibration point.
Look back 20 trading days.
Identify the highest high, lowest low, liquidity pools, Fair Value Gaps, liquidity voids, order blocks, and equilibrium.
Repeat the same process for 40 trading days.
Then repeat it for 60 trading days.
The IPDA lookback helps answer:
Which highs contain relevant buy-side liquidity?
Which lows contain relevant sell-side liquidity?
Which imbalances remain open?
Which institutional reference points may influence price?
Next, cast forward 20, 40 and 60 trading days.
These future ranges create a time horizon for anticipating a significant Daily setup, correction, consolidation, or new Market Structure Shift.
But remember, price does not automatically reverse on day 20, 40 or 60.
Michael J. Huddleston explains:
“It’s not giving you directional bias yet.”
The data ranges identify the reference points.
Institutional Order Flow tells you which side of liquidity price may seek.
Market Structure shows whether the current price profile remains bullish or bearish.
Monthly and Weekly price action provide higher timeframe context.
Lower timeframes refine the actual trade.
That is the purpose of ICT IPDA Data Ranges.
Do not randomly mark every old high and low.
Calibrate the Quarterly Shift.
Look back 20, 40 and 60 trading days.
Find the liquidity.
Identify what remains untapped.
Cast forward into the next data range.
Then wait for Institutional Order Flow to show which price reference is most likely to become the next draw.