Defining Institutional Swing Points is an important market structure concept in the ICT (Inner Circle Trader) methodology developed by Michael J. Huddleston. This concept is taught in ICT Mentorship Core Content – Month 5 and explains how traders can study swing points from an institutional perspective rather than simply marking every three-candle swing high or swing low.
In ICT, the important question is not only where a swing high or low forms. The trader should understand what happened around that swing point, where liquidity was resting, and whether traders were trapped or stopped out before price repriced in the opposite direction.
Michael J. Huddleston explains:
“There’s really only two forms of swing points in the marketplace as it relates to institutional trading.”
These two forms are:
- Breaker Swing Point or Stop Run
- Failure Swing
What are Institutional Swing Points?
An Institutional Swing Point is a meaningful price turning point formed around liquidity and an institutional reference level.
A normal swing high is commonly identified as a three-candle pattern where the middle candle has a higher high than the candles on both sides.
A swing low is the opposite.
However, Defining Institutional Swing Points requires traders to look deeper.
The trader studies:
- Where buy stops and sell stops are resting
- Higher timeframe support or resistance
- Order Blocks
- Fair Value Gaps
- Liquidity Voids
- Breakers
- Mitigation Blocks
- Old highs and old lows
The objective is to understand the institutional logic behind the price reversal.
According to ICT, market turns can generally be studied through two conceptual models: a stop run or a failure swing.
1. Breaker Swing Point or Stop Run
The Breaker Swing Point is the first and most important institutional swing point model.
Price trades through a previous high or low, takes the liquidity resting beyond that level and then aggressively reprices in the opposite direction.
In a bearish condition:
Short-Term High
      ↓
Price Pulls Back
      ↓
New Higher High
      ↓
Buy Stops are Taken
      ↓
Aggressive Bearish Repricing
      ↓
Short-Term Low is Broken
The move above the previous high traps breakout buyers and removes the stops of traders who were already short.
Price then breaks lower.
Michael J. Huddleston describes this model as:
“The most powerful, the most dynamic, the most significant price pattern you need to learn conceptually.”
The bullish model works in the opposite direction.
Short-Term Low
      ↓
Price Retraces Higher
      ↓
New Lower Low
      ↓
Sell Stops are Taken
      ↓
Aggressive Bullish Repricing
      ↓
Short-Term High is Broken
Price runs below an old low, takes sell-side liquidity and then quickly moves higher.
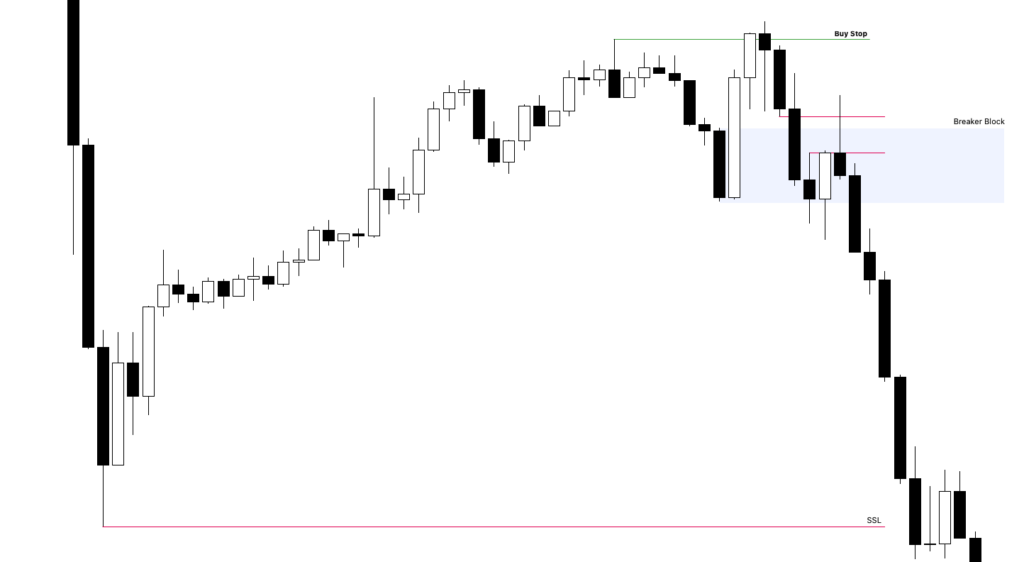
Bearish Breaker Swing Point
A bearish Breaker Swing Point normally develops around an important institutional resistance reference.
Possible levels include:
- Bearish Order Block
- Bearish Breaker
- Mitigation Block
- Fair Value Gap
- Liquidity Void
- Old High
Suppose price initially rallies toward a bearish PD Array but falls slightly short.
Price starts moving lower.
Retail traders may enter short because they believe the bearish move has already started.
Their protective buy stops are commonly placed above the short-term high.
Price then makes another drive higher.
It trades above the short-term high and takes the buy stops.
Institutional Resistance
          ↓
Price Falls Short
          ↓
Short-Term High Forms
          ↓
Price Trades Lower
          ↓
New Shorts Enter
          ↓
Price Runs Above High
          ↓
Buy Stops Taken
          ↓
Bearish Repricing
When price aggressively breaks the short-term low between the two highs, the bearish institutional swing point becomes more significant.
Bullish Breaker Swing Point
The bullish model is the opposite.
Price trades near an institutional support reference such as:
- Bullish Order Block
- Bullish Breaker
- Fair Value Gap
- Liquidity Void
- Old Low
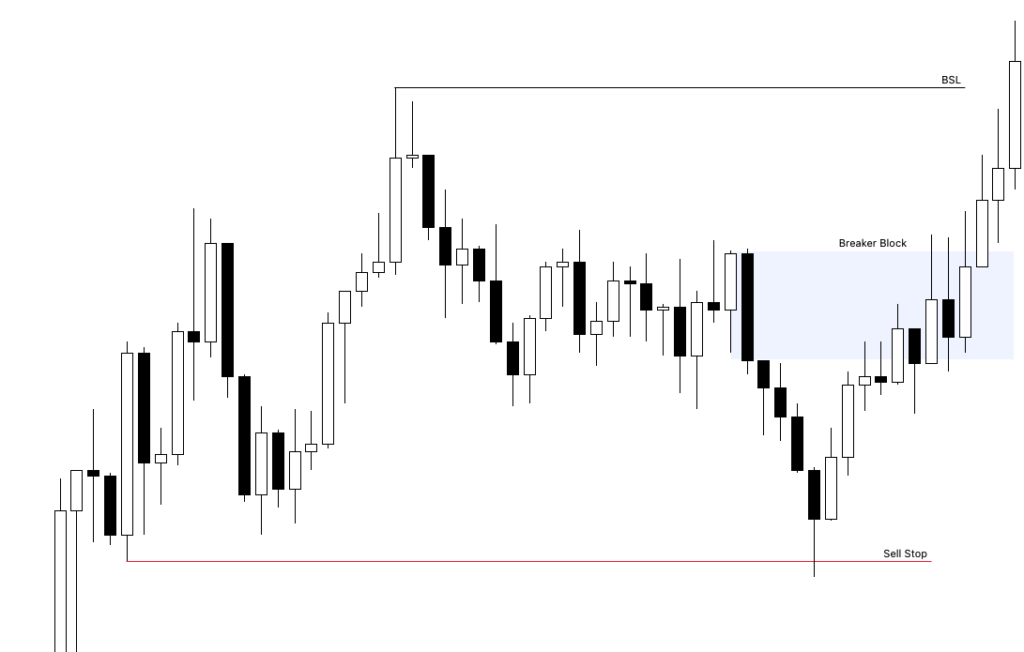
Price may initially bounce before reaching the real institutional support level.
Retail traders enter long and place sell stops below the short-term low.
Price then drives lower.
The old low is violated and sell-side liquidity is taken.
If price reaches the bullish institutional reference point and immediately reprices higher, a bullish Breaker Swing Point may be developing.
ICT emphasizes the importance of an immediate response away from the level.
Price should not trade below the low and remain there for a long period.
A strong displacement away from the low gives evidence that the liquidity raid may have completed its purpose.
How to Trade a Breaker Swing Point
There are two possible ways to approach the model.
Aggressive Entry
The aggressive approach is entering around the stop run itself.
For a bearish setup:
Sell above the old high near the bearish institutional reference point.
For a bullish setup:
Buy below the old low near the bullish institutional reference point.
This can provide a very premium sell or deep discount buy.
However, it requires strong understanding of higher timeframe institutional order flow and PD Arrays.
Confirmed Entry
Traders who cannot confidently enter during the liquidity raid can wait for price to break a short-term swing point.
For a bearish setup:
Buy-Side Liquidity Raid
        ↓
Bearish Displacement
        ↓
Short-Term Low Broken
        ↓
Price Retraces to Breaking Point
        ↓
Sell
For a bullish setup:
Sell-Side Liquidity Raid
        ↓
Bullish Displacement
        ↓
Short-Term High Broken
        ↓
Price Retraces to Breaking Point
        ↓
Buy
The breaking point becomes a possible execution area on the retracement.
ICT describes the Breaker model almost like a two-chance setup.
The trader may enter during the stop run or wait for the market structure break and possible retracement.
Why the Stop Run is Important
The liquidity raid gives the Breaker Swing Point its institutional logic.
Suppose price takes buy-side liquidity above an old high and then aggressively reprices lower.
The buy stops above that high have already been violated.
Breakout traders may now be trapped long.
If price retraces toward the market structure breaking point, the trader can study a bearish entry.
The stop can generally be framed relative to the manipulated high.
The opposite applies after a sell-side liquidity raid.
Once the sell stops below a low have been taken and price aggressively moves higher, the manipulated low becomes an important reference point.
The idea is simple:
Liquidity has already been attacked and price has shown a willingness to move away from that area.
2. Failure Swing
The second model used when Defining Institutional Swing Points is the Failure Swing.
A Failure Swing occurs when price fails to make another pass through a previous important high or low.
Suppose a trader expects price to run above an old high and form a bearish Breaker Swing Point.
Instead, price retraces higher but fails to reach or violate the high.
Price then turns lower.
This is a bearish Failure Swing.
Previous High
      ↓
Price Reprices Lower
      ↓
Retracement Higher
      ↓
Fails to Make Higher High
      ↓
Short-Term Low Broken
      ↓
Bearish Opportunity
The bullish model works in reverse.
Previous Low
      ↓
Price Reprices Higher
      ↓
Retracement Lower
      ↓
Fails to Make Lower Low
      ↓
Short-Term High Broken
      ↓
Bullish Opportunity
The trader may have expected another liquidity raid.
However, price does not provide the ideal Breaker entry.
It creates a Failure Swing instead.
How to Trade a Bearish Failure Swing
Suppose price reaches an area where bearish institutional order flow is expected.
Price moves lower and then retraces higher.
The trader may expect price to trade above the old high.
However, the retracement falls short.
Do not chase the bearish move.
Wait for the relevant short-term low to be broken.
Bearish Institutional Reference
          ↓
Price Moves Lower
          ↓
Retraces Higher
          ↓
Fails Below Previous High
          ↓
Short-Term Low Broken
          ↓
Retracement to Breaking Point
          ↓
Sell
The stop can be framed above the important Failure Swing high.
How to Trade a Bullish Failure Swing
For a bullish Failure Swing, price trades into an area where higher prices are expected.
Price moves higher and then retraces lower.
The trader may expect another move below the previous low.
But price fails to make a new lower low.
Once price breaks the short-term high, the trader can monitor the breaking point for a bullish retracement.
Bullish Institutional Reference
          ↓
Price Moves Higher
          ↓
Retraces Lower
          ↓
Fails Above Previous Low
          ↓
Short-Term High Broken
          ↓
Retracement to Breaking Point
          ↓
Buy
This allows the trader to participate even when the ideal liquidity raid or Breaker entry does not occur.
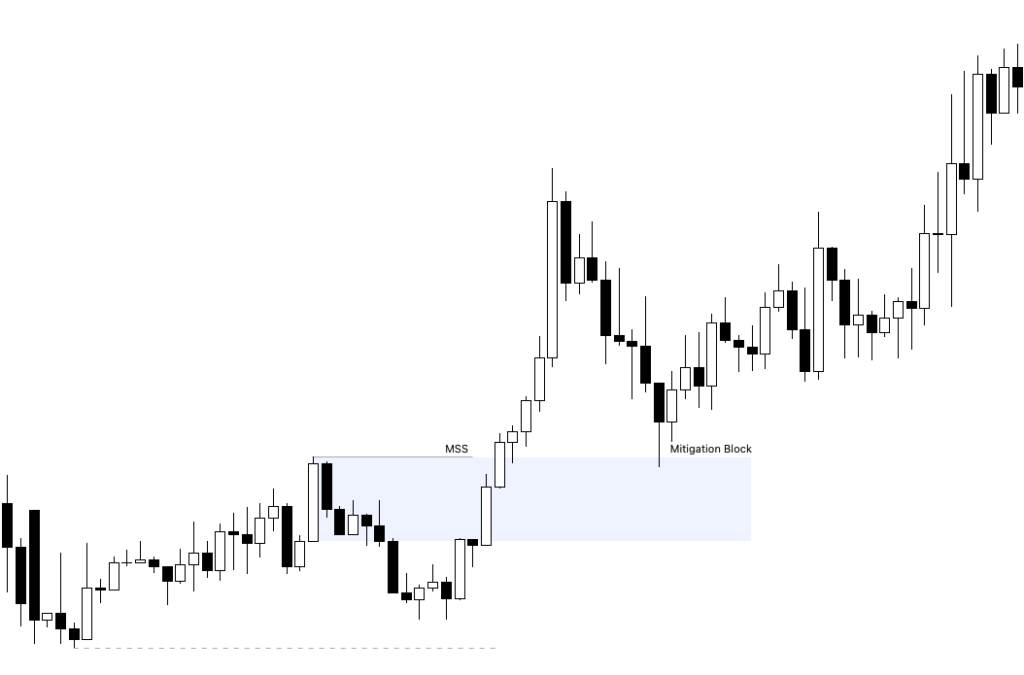
Breaker Swing Point vs Failure Swing
The main difference is whether price passes through the previous swing point.
Breaker Swing Point
Price runs above the old high or below the old low.
Liquidity is directly taken.
Then price aggressively reprices in the opposite direction.
Old High Taken → Bearish Breaker Model

Old Low Taken → Bullish Breaker Model
Failure Swing
Price fails to return through the previous high or low.
The expected second liquidity raid does not occur.
Price turns and breaks short-term structure.
Fails Below Old High → Bearish Failure Swing

Fails Above Old Low → Bullish Failure Swing
ICT considers the Breaker Swing Point the more optimal model because it can provide a deeper discount for buys and a higher premium for sells.
However, the Failure Swing provides an alternative when price does not give the ideal stop-run entry.
Institutional Reference Points are Important
Institutional Swing Points should not be traded randomly.
The surrounding price location is extremely important.
Before anticipating a Breaker or Failure Swing, identify the important ICT reference points on the chart.
These may include:
- Order Blocks
- Breakers
- Mitigation Blocks
- Fair Value Gaps
- Liquidity Voids
- Old Highs
- Old Lows
For example, a simple move above an old high does not automatically create a bearish trade.
But if price runs above an old high directly into a higher timeframe bearish Order Block and aggressively displaces lower, the setup has stronger institutional context.
The same applies to bullish setups.
Think About Trapped Traders
One of the key ideas behind Defining Institutional Swing Points is understanding where traders may become trapped.
Michael J. Huddleston explains:
“The institutions go into the marketplace to trap or they go into knock off.”
Consider a bearish model.
Price moves above an old high.
Breakout traders buy.
Their buy orders provide liquidity for selling.
Price then aggressively reprices lower.
The breakout buyers are trapped at higher prices.
For a bullish model, price trades below an old low.
Breakout sellers enter short.
Price then aggressively moves higher.
Those sellers may be forced to buy back their positions as price continues higher.
Understanding this relationship between liquidity, trapped traders and aggressive repricing helps explain why some swing points become more important than others.
Do Not Focus Only on Candlestick Patterns
ICT does not define these swing points using classical candlestick names.
A liquidity raid may later appear as:
- Hammer
- Doji
- Long wick candle
- Rejection candle
However, the candle pattern itself is not the main concept.
The important questions are:
Where was liquidity resting?
Which institutional reference point was reached?
Did price take the liquidity or fail to make another pass?
Did price aggressively reprice?
Was a short-term swing point broken?
This provides more context than simply memorizing candlestick formations.
Final Thoughts
Defining Institutional Swing Points helps ICT traders understand market turning points through liquidity and institutional price delivery.
According to the ICT (Inner Circle Trader) framework, two primary models should be studied:
Breaker Swing Point — Price runs stops beyond an old high or low and aggressively reprices.
Failure Swing — Price fails to make another pass through the previous high or low and then breaks short-term structure.
The Breaker Swing Point provides the ideal stop-run model and may offer a premium sell or deep discount buy.
When the Breaker does not form, the Failure Swing can provide another opportunity after a short-term market structure break.
Rather than memorizing many chart patterns, traders can focus on where the orders are resting, how price behaves around institutional reference points, and whether the market forms a stop run or Failure Swing.