Qualifying Trade Conditions With 10 Year Yields is a higher timeframe analysis concept taught by Michael J. Huddleston, founder of the ICT (Inner Circle Trader) concepts. This concept is taught in the ICT Mentorship Core Content – Month 5 and explains how traders can use the 10-Year Treasury market, 10-Year yields, and the Dollar Index to qualify a potential trade condition.
The main idea is not to trade a market simply because a seasonal tendency or higher timeframe setup is present. ICT looks for confirmation through market symmetry, SMT divergence, interest rates, and the Dollar Index.
When these markets fail to move in their normally expected relationship, it can indicate an underlying institutional move is developing.
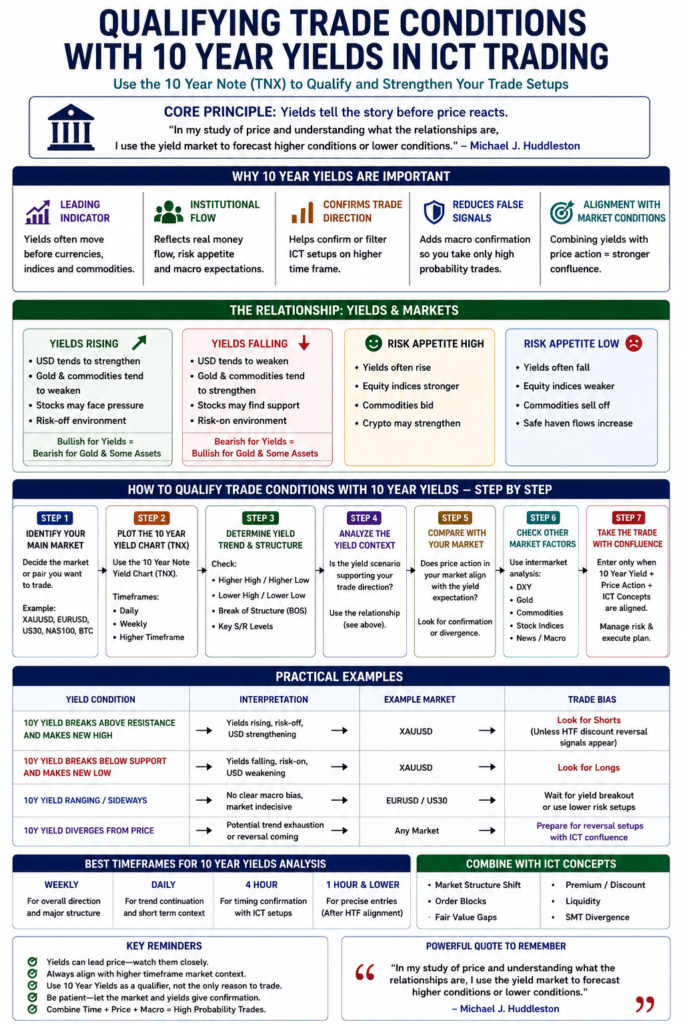
Why ICT Uses 10 Year Yields
The 10-Year Treasury market gives important information about interest rates and the potential direction of the US Dollar.
A simple relationship to remember is:
10-Year Note Price Higher → 10-Year Yield Lower
10-Year Note Price Lower → 10-Year Yield Higher
The 10-Year Treasury Note and its yield have an inverse relationship.
ICT uses this information together with the Dollar Index or DXY. Rising yields can support a stronger dollar because global capital naturally seeks higher yield opportunities.
As Michael J. Huddleston explains:
“Markets seek yield.”
Therefore, changes in the 10-Year yield can help traders understand whether a Dollar Index move has support from the interest rate market.
Expected Relationship Between 10-Year Notes and Dollar Index
Under normal market symmetry, the 10-Year Treasury Note and Dollar Index should generally show an inverse relationship.
For example:
10-Year Note making lower lows → DXY should show higher highs
10-Year Note making higher highs → DXY should show lower lows
Equal lows in 10-Year Notes → DXY may show corresponding equal highs
The charts should behave almost like a mirror image.
ICT traders compare the swings between both markets. The goal is to find whether the expected market symmetry is present or broken.
Broken Market Symmetry as a Trade Qualification
The important signal appears when the expected relationship fails.
For example, imagine the 10-Year Note is progressively making lower lows.
Normally, DXY should make higher highs.
But instead, DXY starts making lower highs.
This is a crack in correlation.
In ICT terminology, this can be viewed as a form of SMT divergence between the Dollar Index and the 10-Year Treasury Note.
Michael J. Huddleston explains:
“When that symmetry is broken, it indicates there is an underlying trend or manipulation.”
The divergence does not automatically provide an entry. Instead, it qualifies the trade condition and suggests that a larger market idea may be developing.
Example of 10-Year Note and DXY Divergence
ICT explains a condition where the 10-Year Treasury Note progressively makes lower lows during a seasonal period.
Based on normal market symmetry, DXY should respond with higher highs.
However, DXY makes lower highs.
The expected inverse relationship is missing.
10-Year Note → Lower lows
DXY → Lower highs
Expected DXY behavior → Higher highs
This broken correlation suggests that the markets are not delivering perfect symmetry.
The trader can now investigate whether a higher timeframe trade is developing.
The move can be further qualified by observing the 10-Year yield. If yields are declining while Treasury Note futures are rallying, the interest rate market provides additional context for the trade idea.
Equal Lows and Higher Highs in DXY
Another trade condition can appear when the 10-Year Treasury Note forms equal lows.
Under market symmetry, traders would normally expect corresponding equal highs in the Dollar Index.
But imagine DXY instead makes higher highs.
10-Year Note → Equal lows
DXY → Higher highs
This is another crack in correlation.
DXY is showing willingness to move higher, but the expected weakness in 10-Year Notes is not visible.
According to ICT, this difference can qualify the idea that an underlying trade is already underway.
The trader can then study yields and other correlated markets for further confirmation.
Using 10 Year Yields to Confirm Dollar Strength
The interest rate market can provide further confirmation of a DXY trend.
When the 10-Year yield increases, the 10-Year Note price generally declines.
At the same time, rising yields can support a stronger US Dollar.
The relationship may appear as:
10-Year Note Price ↓
10-Year Yield ↑
Dollar Index ↑
This does not mean the Dollar must rally every time yields increase. ICT uses the relationship as part of a larger market framework.
The goal is to determine whether the interest rate market is supporting the higher timeframe Dollar Index direction.
Consolidation in Yields and Currency Markets
10-Year yields are also useful for identifying market conditions where traders should expect reduced expansion.
When yields remain inside a large consolidation, the Dollar Index, Treasury market, and foreign currencies may also experience consolidation.
A small price movement inside this range may look like a trend on a lower timeframe.
However, higher timeframe analysis may still show a broad consolidation.
This is why ICT emphasizes looking at higher timeframe charts.
Without the higher timeframe context, traders may mistake small internal movements for major directional trends.
Blend 10 Year Yields With Seasonal Tendencies
ICT does not use seasonal tendencies as automatic buy or sell signals.
For example, the 10-Year Treasury Note may historically show a seasonal tendency to rally during a particular period.
The seasonal tendency gives the trader an idea of what may occur.
The relationship between the 10-Year Note and DXY helps determine whether that seasonal idea is being qualified.
A basic process is:
Identify the seasonal tendency → Study 10-Year Note swings → Compare the swings with DXY → Look for broken symmetry → Confirm with 10-Year yields
When the markets align, the seasonal tendency has more supporting evidence.
Qualifying Quarterly Shifts With 10 Year Yields
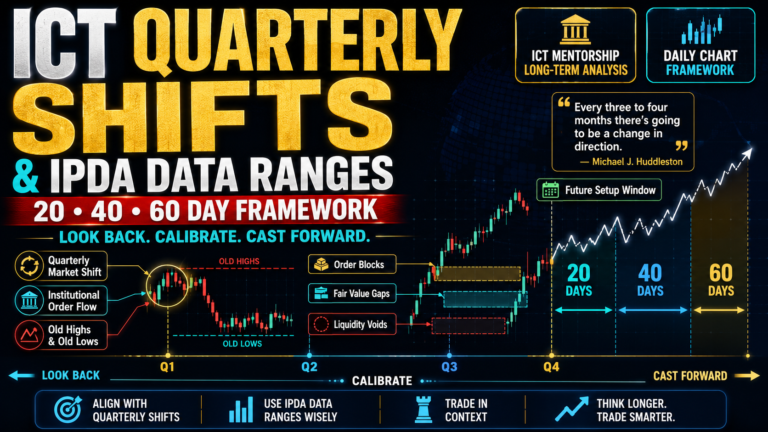
Michael J. Huddleston also teaches traders to blend this concept with the ICT Quarterly Shift concept.
The trader may be studying the potential market direction for the next three to four months.
This does not mean the trader must hold a position for the entire period.
Instead, the higher timeframe analysis helps identify the potential major swing or institutional order flow.
ICT generally focuses on a three-month time horizon when studying these larger market conditions. Individual trade setups may complete much earlier.
The 10-Year Note, DXY, and yields can therefore help qualify whether a potential quarterly shift is developing.
Combining 10 Year Yields With SMT Divergence
One of the strongest applications of this concept is combining it with ICT SMT Divergence.
The trader can study:
Dollar Index vs 10-Year Treasury Note
Look for market symmetry and divergence between corresponding highs and lows.
The trader may also use:
Dollar Index vs Forex Currency Pair
A currency pair can show SMT divergence against DXY.
Another option is using an interest rate triad to further qualify the market condition.
ICT does not suggest that every confirmation must appear together. A valid divergence relationship may provide enough evidence to begin developing a higher timeframe trade idea.
The objective is to build supporting evidence around a possible quarterly shift.
How to Qualify a Trade Condition With 10 Year Yields
A simple ICT analysis process can be followed:
Step 1: Identify the Higher Timeframe Idea
Study the seasonal tendency or potential quarterly shift.
Step 2: Analyze the 10-Year Treasury Note
Mark important higher highs, lower highs, higher lows, lower lows, or equal levels.
Step 3: Compare It With DXY
Determine what DXY should normally do based on the inverse market relationship.
Step 4: Look for Broken Symmetry
If DXY fails to confirm the Treasury Note swing, a crack in correlation may be present.
Step 5: Check the 10-Year Yield
Determine whether yields are increasing, declining, or consolidating.
Step 6: Look for Additional SMT Divergence
Compare DXY with a related Forex pair or use interest rate analysis.
Step 7: Align With Higher Timeframe Order Flow
Use the qualified direction to frame swing trades, short-term trades, day trades, or scalps.
Why This Concept Is Important for Day Traders
Qualifying Trade Conditions With 10 Year Yields is a higher timeframe concept, but it is not limited to position traders.
A day trader can use the analysis to determine the broader institutional order flow.
For example, if 10-Year yields, DXY, and SMT divergence support Dollar strength, the trader can focus on setups that align with that higher timeframe condition.
This can help filter lower timeframe trade ideas that move against institutional order flow.
As ICT explains:
“It filters out a lot of the noise.”
The higher timeframe direction becomes a filter for lower timeframe execution.
Final Thoughts
Qualifying Trade Conditions With 10 Year Yields is an ICT framework used to confirm whether a higher timeframe trade idea has supporting evidence from the interest rate market.
The main focus is the relationship between the 10-Year Treasury Note, 10-Year yields, and Dollar Index.
Under normal conditions, the 10-Year Note and DXY should show a form of mirror-image market symmetry. When this symmetry breaks, ICT traders look for a crack in correlation or SMT divergence.
By combining 10-Year yields, DXY, seasonal tendencies, SMT divergence, and Quarterly Shift concepts, traders can develop a clearer understanding of higher timeframe order flow.
The concept is not designed to predict every market move. Its purpose is to qualify trade conditions, remove unnecessary market noise, and keep trading ideas aligned with the broader institutional workflow.