Defining HTF PD Arrays is an important part of higher time frame analysis in ICT trading. The concept is taught by Michael J. Huddleston, founder of ICT (Inner Circle Trader), in the ICT Mentorship Core Content – Month 5.
The purpose of HTF PD Arrays is to organize important institutional price reference points into a clear hierarchy.
Instead of randomly marking every Order Block, Fair Value Gap, Breaker, or old high on a chart, the trader asks:
Where is price inside the higher time frame range?
Is price in Premium, Discount, or Equilibrium?
Which PD Array should price encounter next?
Michael J. Huddleston explains:
“There’s a hierarchy in how they are used and how you look for them in price.”
This hierarchy helps traders frame directional expectations, potential targets, and areas where price may react.
What Are HTF PD Arrays?
HTF PD Arrays are Premium and Discount Arrays identified on higher time frame charts.
For this framework, ICT primarily focuses on:
- Monthly chart
- Weekly chart
- Daily chart
The Monthly and Weekly charts establish the main market context.
The Daily chart can reveal important PD Arrays hidden inside larger Monthly or Weekly price swings.
The basic concept is:
Premium PD Arrays → Potential bearish reference points or bullish targets
Discount PD Arrays → Potential bullish reference points or bearish targets
Price is viewed as moving between areas of Premium and Discount.
Premium, Discount and Equilibrium
Before Defining HTF PD Arrays, the trader must identify a relevant higher time frame trading range.
The simplest method is to use a significant:
Old High → Old Low
or:
Old Low → Old High
These two points define the current dealing range.
The midpoint of the range is called Equilibrium.
The structure becomes:
Premium
Above Equilibrium
Equilibrium
50% of the trading range
Discount
Below Equilibrium
When price trades above Equilibrium, it is moving into a relatively expensive or Premium condition.
When price trades below Equilibrium, it is moving into a relatively cheap or Discount condition.
ICT explains the basic delivery model as:
Discount → Premium
and:
Premium → Discount
Michael J. Huddleston states:
“Predominantly it’s moving from a level of discount to a level of premium, from a level of premium to a level of discount.”
The trader’s job is to identify the PD Arrays between current market price and the expected future price objective.
Why HTF PD Arrays Need a Hierarchy
A chart may contain several ICT concepts at the same time.
For example, above current price there may be:
- Mitigation Block
- Bearish Breaker
- Liquidity Void
- Fair Value Gap
- Bearish Order Block
- Rejection Block
- Old High
The problem is deciding which one should be considered first.
A beginner may immediately focus on the Bearish Order Block.
However, a Bearish Breaker or Mitigation Block may exist below the Order Block.
Price may react from the lower PD Array and never reach the Bearish Order Block.
This is why the hierarchy matters.
You start from current market price and study the PD Arrays in the direction price is expected to travel.
HTF Premium PD Array Hierarchy
When price is below Premium and you are looking for higher price objectives or future selling areas, the Premium PD Arrays are organized as follows.
From the deepest Premium level downward toward Equilibrium, the hierarchy is:
Old High or Old Low
↓
Rejection Block
↓
Bearish Order Block
↓
Fair Value Gap
↓
Liquidity Void
↓
Bearish Breaker
↓
Mitigation Block
However, when price is near Equilibrium and starts moving higher, the trader encounters the hierarchy in reverse order.
The practical scanning process becomes:
Mitigation Block
↓
Bearish Breaker
↓
Liquidity Void
↓
Fair Value Gap
↓
Bearish Order Block
↓
Rejection Block
↓
Old High or Old Low
This is the order traders should use when asking:
What is the next Premium PD Array above price?
How to Search for Premium PD Arrays
Assume price is around Equilibrium and your analysis suggests price may move higher before selling off.
Start with the nearest potential Premium PD Array.
1. Look for a Mitigation Block
Ask:
Is there a Mitigation Block above current price?
If yes, it may become the first reaction or selling area.
If there is no Mitigation Block, move to the next array.
2. Look for a Bearish Breaker
A Bearish Breaker can be a very important PD Array.
ICT places significant emphasis on Breakers because they can prevent price from reaching higher Premium Arrays.
If a Bearish Breaker exists below a Liquidity Void, Fair Value Gap, or Bearish Order Block, price may react at the Breaker.
Michael J. Huddleston explains:
“The breaker has precedence over everything.”
This does not mean price can never trade through a Breaker.
It means the Breaker should be considered before expecting price to reach higher PD Arrays.
3. Look for a Liquidity Void
If no significant Breaker is present, determine whether price may reprice into a Liquidity Void.
Price may move higher to close a portion of the inefficient range.
4. Look for a Fair Value Gap
If there is no relevant Liquidity Void, identify the nearest Fair Value Gap.
The imbalance may act as a draw on price.
5. Look for a Bearish Order Block
Without a lower Mitigation Block, Breaker, Void, or FVG stopping price, the Bearish Order Block may become the next logical Premium PD Array.
This can provide a potential higher time frame selling area.
6. Look for a Rejection Block
If the chart contains prominent upper wicks, ICT may focus on the area immediately above the candle bodies.
The candle body is important when defining the Rejection Block.
The wick forms the actual extreme, while the area around the bodies may define the institutional rejection reference.
7. Look for an Old High or Old Low
The deepest Premium objective may be an old high.
In some market structures, a historical old low can also act as Premium resistance if price has rallied significantly back toward it.
The key is its position relative to the current trading range.
HTF Discount PD Array Hierarchy
The same logic is reversed when price is moving lower into Discount.
From the deepest Discount area upward toward Equilibrium, the hierarchy is:
Old Low or Historical High
↓
Rejection Block
↓
Bullish Order Block
↓
Fair Value Gap
↓
Liquidity Void
↓
Bullish Breaker
↓
Mitigation Block
When price is around Equilibrium and moving lower, the practical scanning process becomes:
Mitigation Block
↓
Bullish Breaker
↓
Liquidity Void
↓
Fair Value Gap
↓
Bullish Order Block
↓
Rejection Block
↓
Old Low or Historical High
This allows the trader to identify the next potential Discount PD Array below current price.
How to Search for Discount PD Arrays
Assume the higher time frame analysis suggests lower prices.
Start below current market price.
First ask:
Is there a bullish Mitigation Block?
If not:
Is there a Bullish Breaker?
If a Bullish Breaker exists, it may prevent price from reaching a lower Liquidity Void or Fair Value Gap.
Without a Breaker, the next objective may be:
Liquidity Void
Then:
Fair Value Gap
Then:
Bullish Order Block
Below the Bullish Order Block, the trader may identify a Rejection Block around the lower candle bodies.
The deepest Discount objective may be an old low or another important historical price reference.
The process is not about randomly choosing a bullish PD Array.
The trader works through the hierarchy based on where current price is located.
Why Breakers Are Important in the PD Array Hierarchy
Breakers deserve special attention in Defining HTF PD Arrays.
Suppose price is moving higher.
Above price you identify:
Bearish Breaker
↓
Liquidity Void
↓
Fair Value Gap
↓
Bearish Order Block
A common mistake is targeting the Bearish Order Block because it appears to be the most obvious selling area.
However, ICT teaches that the Bearish Breaker may prevent price from reaching the higher arrays.
The expectation becomes:
Price rallies
↓
Reaches Bearish Breaker
↓
Institutional selling may enter
↓
Price moves lower
The Liquidity Void or FVG above the Breaker may remain open.
The same concept applies in Discount.
A Bullish Breaker may support price before a lower Liquidity Void, FVG, or Bullish Order Block is reached.
Therefore:
Always check for a Breaker before assuming price must reach a deeper PD Array.
Monthly, Weekly and Daily PD Arrays
The same PD Array hierarchy applies to the Monthly, Weekly, and Daily charts.
Nothing changes in the order.
Monthly PD Arrays
The Monthly chart provides the broadest higher time frame context.
Use it to identify:
- Major Premium
- Major Discount
- Long-term trading range
- Significant Monthly PD Arrays
- Potential long-term price objectives
Weekly PD Arrays
The Weekly chart applies the same hierarchy.
It can provide more detailed PD Arrays inside the Monthly dealing range.
A Weekly Breaker or Order Block may become important before a Monthly objective is reached.
Daily PD Arrays
The Daily chart can reveal price references hidden inside large Weekly or Monthly candles.
For example, what appears to be a simple Monthly swing low may contain:
- Daily short-term high
- Daily Bullish Order Block
- Daily Fair Value Gap
- Daily Breaker
These internal arrays may explain why price reacts before reaching the visible Monthly extreme.
For HTF PD Array analysis, ICT’s focus is on the Monthly, Weekly, and Daily charts.
Use HTF PD Arrays to Find Future Price Objectives
HTF PD Arrays help answer one of the most important trading questions:
Where can price go next?
Suppose price is trading in Premium and your higher time frame narrative is bearish.
You expect price to move toward Discount.
The process is:
Identify current Premium condition
↓
Establish bearish expectation
↓
Study Discount PD Arrays below price
↓
Find the nearest valid array
↓
Check for Breaker precedence
↓
Use the PD Array as a potential price objective
The opposite applies to bullish conditions.
Identify current Discount condition
↓
Establish bullish expectation
↓
Study Premium PD Arrays above price
↓
Find the next valid array
↓
Monitor Institutional Order Flow
↓
Use the array as a potential objective
PD Arrays give structure to the expected path of price.
Submit to Time and Price
An important part of HTF analysis is understanding that a price forecast may take time to develop.
The market rarely moves directly from current price to the final Premium or Discount objective.
Price can:
Displace
↓
Retrace
↓
Reach another PD Array
↓
React
↓
Continue toward the larger objective
Michael J. Huddleston explains:
“You have to submit to time and price.”
The trader studies price to determine whether Institutional Order Flow continues to support the original expectation.
At the same time, the trader must accept that the move may require days, weeks, or months to develop.
HTF PD Arrays help traders stay focused on the larger narrative during these intermediate price swings.
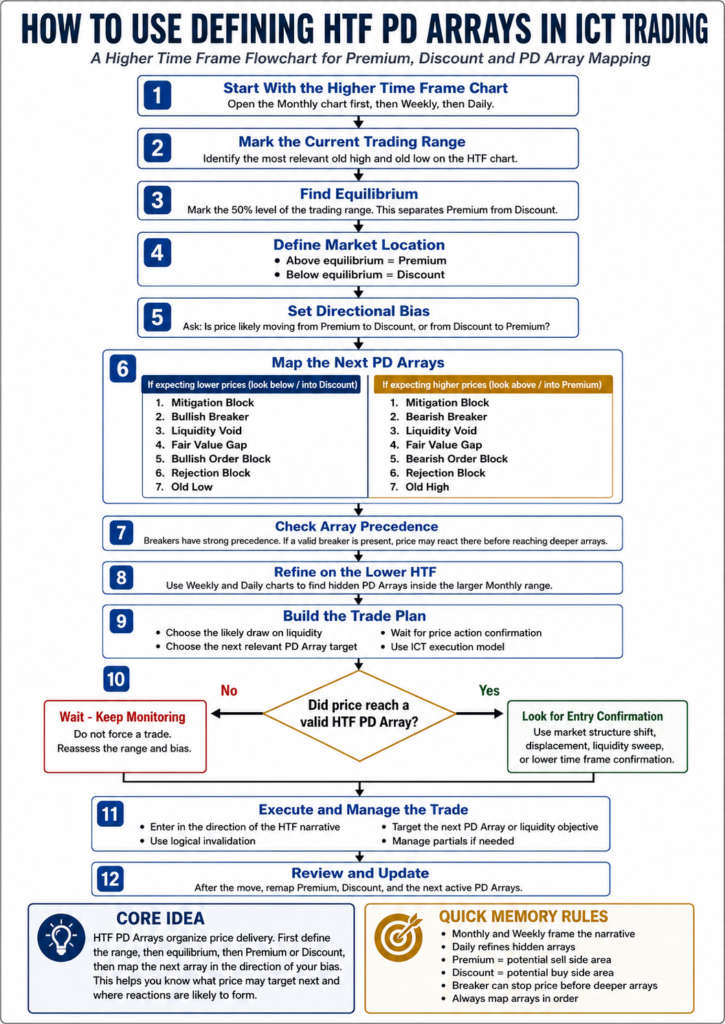
How to Use Defining HTF PD Arrays in Trading
A simple ICT process is:
Open the Monthly chart
↓
Identify the current trading range
↓
Mark the significant old high and old low
↓
Find Equilibrium
↓
Determine Premium or Discount
↓
Establish higher time frame directional expectation
↓
Move to the Weekly chart
↓
Identify PD Arrays between current price and the expected objective
↓
Apply the PD Array hierarchy
↓
Give Breakers precedence
↓
Use the Daily chart to refine hidden HTF arrays
↓
Monitor Institutional Order Flow
↓
Frame targets and potential trade locations
The main objective is organization.
You are no longer marking random ICT concepts on the chart.
Every PD Array has a position within the Premium or Discount framework.
Final Thoughts
Defining HTF PD Arrays gives ICT traders a structured method for reading higher time frame price action.
The concept begins with identifying a relevant trading range and separating it into:
Premium
Equilibrium
Discount
The trader then organizes institutional price references into a hierarchy.
For Premium, price may encounter:
Mitigation Block → Bearish Breaker → Liquidity Void → Fair Value Gap → Bearish Order Block → Rejection Block → Old High or Old Low
For Discount, the logic is reversed:
Mitigation Block → Bullish Breaker → Liquidity Void → Fair Value Gap → Bullish Order Block → Rejection Block → Old Low or Historical High
The key is to identify the next relevant PD Array in the direction of expected price delivery.
By combining Monthly, Weekly, and Daily analysis with Premium and Discount logic, traders can better understand where price may react, where price may seek liquidity, and which higher time frame PD Array may become the next objective.
That is the practical purpose of Defining HTF PD Arrays in ICT trading.