The ICT Quarterly Shifts & IPDA Data Ranges concept is a macro price analysis framework taught by Michael J. Huddleston, the founder of ICT (Inner Circle Trader). The concept explains how traders can study approximately three months of Daily price data, identify a recent market structure shift, locate institutional reference points, and anticipate where another important setup may develop during the next 20, 40, or 60 trading days.
This framework builds on important ICT ideas such as Institutional Order Flow, liquidity, SMT divergence, Turtle Soup, order blocks, Fair Value Gaps, liquidity voids, and Rejection Blocks.
The main idea is that traders should not look at the Daily Chart as an unlimited series of random candles.
Instead, ICT divides price into manageable data ranges.
Michael J. Huddleston explains:
“Every three to four months there’s going to be a change in direction.”
The change does not always mean a complete long-term trend reversal.
It may be a deep retracement, consolidation, intermediate-term correction, or the beginning of a new directional price swing.
This is the foundation of the ICT Quarterly Shifts & IPDA Data Ranges concept.
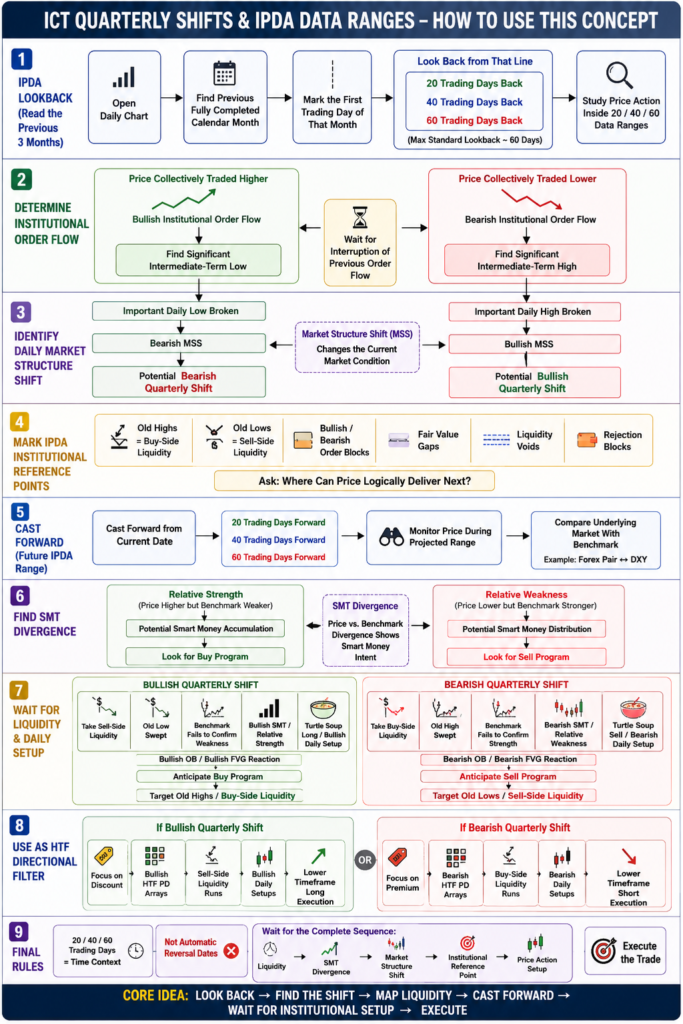
What is an ICT Quarterly Shift?
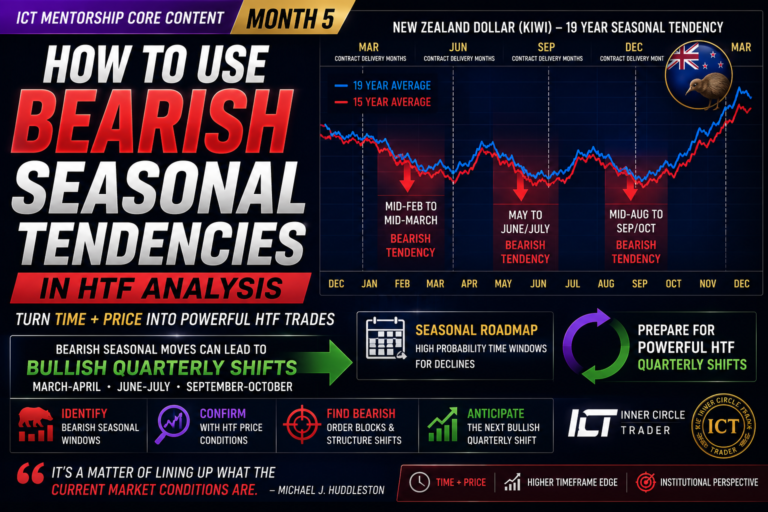
An ICT Quarterly Shift is an anticipated change in market condition that may develop approximately every three to four months.
The market may have been trading higher for several months.
A Quarterly Shift can produce:
- A bearish correction
- A deeper retracement
- A consolidation
- A change in Institutional Order Flow
- A complete directional reversal
The same idea applies to a bearish market.
After several months of lower prices, the market may begin consolidating, retracing higher, or changing into a bullish environment.
ICT does not suggest that every three months price must automatically reverse.
The concept is based on anticipating a change in the current market condition.
For example, a strong bullish market may not create a major bearish reversal.
Instead, price may enter a Daily consolidation.
Price may run below a short-term low, take sell-side liquidity, and then continue higher.
In this condition, the Quarterly Shift was represented by consolidation and repricing rather than a complete change in the primary bullish trend.
Why Quarterly Shifts Are Important
Many traders become emotionally attached to the price direction they have recently observed.
If price has rallied for three months, they assume it must continue higher.
If price has declined for several months, they continue searching for short setups.
ICT Quarterly Shift analysis warns traders that the previous two or three months of price delivery may not represent the next three months.
A market can transition from:
Bullish expansion to bearish correction
Bearish expansion to bullish correction
Trend to consolidation
Consolidation to expansion
Retracement to trend continuation
The trader should therefore continuously study Monthly, Weekly, and Daily price action.
The purpose is to anticipate the next intermediate-term price swing.
This broader perspective is important even for day traders.
A trader may only hold a position for several hours, but the Quarterly Shift can still provide the directional framework for those intraday trades.
What are ICT IPDA Data Ranges?
In ICT terminology, IPDA refers to the Interbank Price Delivery Algorithm.
The ICT IPDA Data Ranges concept studies specific portions of Daily price data.
The main ranges are:
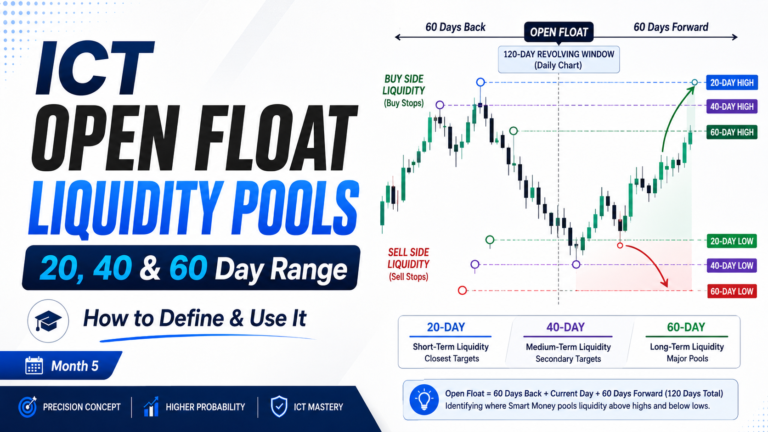
20 trading days
40 trading days
60 trading days
These are trading days, not calendar days.
Approximately 20 trading days represent one trading month.
Approximately 40 trading days represent two trading months.
Approximately 60 trading days represent three trading months.
ICT uses these data ranges to study recent Institutional Order Flow and identify the liquidity or institutional price references that may influence future price delivery.
The basic idea is:
Look back 20, 40 and 60 trading days
Then:
Identify what price has created
Then:
Calibrate the recent market structure shift
Then:
Cast forward 20, 40 and 60 trading days
Then:
Anticipate the next important setup
The IPDA Data Range gives the trader both a price reference and a time horizon.
Why ICT Uses 20, 40 and 60 Trading Days
ICT teaches that approximately three trading months of recent data can contain important institutional reference points.
The 60-day range gives the broader three-month perspective.
The 40-day range allows the trader to study more recent intermediate price action.
The 20-day range focuses on the most recent trading month.
The trader compares these ranges to determine:
- Where price has traded from
- Whether Institutional Order Flow was bullish or bearish
- Where liquidity may remain
- Which order blocks may remain active
- Where Fair Value Gaps exist
- Where liquidity voids remain
- Which old highs or lows may be targeted
The trader is essentially asking:
What has price created during the previous three trading months that may still be relevant?
This is the purpose of the IPDA lookback.
The ICT Quarterly Shift Lookback Process
The first part of the analysis is called the lookback.
Start with the Daily Chart.
Find the most recent fully completed calendar month.
Then place a vertical line on the first trading day of that month.
For example, suppose the current date is in November.
The previous fully completed month is October.
The trader uses the first trading day of October as the initial calendar reference.
From that vertical line, look left.
Mark:
20 trading days back
40 trading days back
60 trading days back
Now study the price action inside those data ranges.
The maximum standard lookback used in this framework is approximately 60 trading days.
The trader is reviewing about three trading months of Daily price action.
Why Use the Previous Closed Month?
ICT uses a completed calendar month as the starting reference because the month has already delivered its complete range.
The first trading day and last trading day are known.
The trader is not calibrating the model from an incomplete future range.
Suppose it is November 14.
October is the most recent completed month.
The trader can begin with October’s first trading day.
The process should not automatically begin from November 1 simply because November is the current month.
November is still developing.
Using the previous completed month provides a consistent calendar reference for the lookback process.
What to Study During the 60-Day Lookback
After marking the 20, 40 and 60 trading-day ranges, study Institutional Order Flow.
Ask:
Over the last 60 trading days, has price collectively traded higher or lower?
You are not trying to classify every Daily candle.
Study the general price delivery.
If price has collectively moved from a significant intermediate-term low toward higher prices, Institutional Order Flow was bullish.
If price moved from an intermediate-term high toward lower prices, Institutional Order Flow was bearish.
Sometimes price may be in a broad consolidation.
That is also important information.
The purpose is to understand the dominant price delivery during the previous three trading months.
Find the Significant Intermediate-Term High or Low
Inside the previous 60 trading days, look for an obvious significant price extreme.
If the market was bullish, identify the important intermediate-term low from which price expanded higher.
If the market was bearish, identify the significant intermediate-term high from which price moved lower.
The level should be obvious in the context of recent Daily price action.
Once identified, the market structure calibration can be anchored around that price swing.
For bullish Institutional Order Flow:
Find the important low
For bearish Institutional Order Flow:
Find the important high
The purpose is to identify where the recent institutional price movement began.
Calibrating the Recent Market Structure Shift
After identifying the recent Institutional Order Flow, wait for an obvious interruption in that price delivery.
Suppose price traded higher during the previous 60 days.
Higher prices have been delivered.
Then a significant Daily low is broken.
This can indicate a bearish Market Structure Shift.
The market has interrupted the previous bullish order flow.
The trader may now anticipate bearish conditions during the following Quarterly Shift.
The sequence is:
Previous 60-day Institutional Order Flow bullish
Then:
Important Daily low violated
Then:
Bearish Market Structure Shift
Then:
Retracements higher may become selling opportunities
Then:
Price may seek lower institutional reference points
The opposite process applies to a bearish market.
Suppose the previous 60-day price delivery was bearish.
Price then trades above an important Daily high.
Institutional Order Flow may be shifting bullish.
The trader can begin anticipating higher prices.
Quarterly Shift Does Not Mean Long-Term Trend Reversal
This is an important distinction.
A bearish Quarterly Shift does not automatically mean a long-term bear market has started.
The primary trend may remain bullish.
The Quarterly Shift may simply produce an intermediate-term correction.
For example:
The Monthly Chart is bullish.
Price has rallied for several months.
A bearish Daily Market Structure Shift develops.
The next two or three months may produce a correction.
After reaching a higher timeframe discount area or bullish order block, the primary bullish trend may resume.
Therefore, traders should separate:
Primary long-term trend
from
Intermediate Quarterly Shift
The Quarterly Shift helps identify meaningful swings inside the larger market structure.
Institutional Reference Points Inside IPDA Data Ranges
The ICT IPDA Data Ranges are not used only to count days.
The main purpose is to identify important price references inside those ranges.
During the 20, 40 and 60-day lookback, study:
- Old highs
- Old lows
- Bullish order blocks
- Bearish order blocks
- Fair Value Gaps
- Liquidity voids
- Rejection Blocks
These levels provide possible liquidity objectives and reaction areas.
Suppose the previous 60-day range was bullish.
Price created several short-term lows while moving higher.
Below those lows are potential sell stops.
If a bearish Market Structure Shift develops, those lower liquidity pools may become objectives.
Price is not expected to move lower without a logical destination.
The trader identifies institutional reference points where liquidity may be absorbed or engineered.
Old Highs and Old Lows in the 20, 40 and 60-Day Range
Old highs can contain buy-side liquidity.
Old lows can contain sell-side liquidity.
During the IPDA lookback, identify these levels.
Suppose recent Institutional Order Flow was bullish.
Price has already moved higher.
A bearish Market Structure Shift occurs.
The trader studies the previous 20, 40 and 60-day lows.
Sell-side liquidity may rest below these levels.
These lows may provide future downside objectives.
The opposite applies after bearish Institutional Order Flow.
If price shifts bullish, old highs inside the recent data ranges may provide buy-side liquidity objectives.
The trader is looking back to understand where price may reach next.
Rejection Blocks Inside IPDA Data Ranges
Some old highs and lows contain long candle wicks.
In these conditions, ICT may study the bodies of the candles rather than only the absolute wick extreme.
At a swing high with several long upper wicks, price moving above the highest candle bodies may enter a Rejection Block.
The market may not need to break the absolute highest wick before rejecting lower.
At a swing low with long lower wicks, price moving below the lowest candle bodies may enter a bullish Rejection Block.
Therefore, during the 20, 40 and 60-day lookback, study the relationship between candle bodies and wick extremes.
This can help identify institutional liquidity around an old high or low.
Order Blocks Inside the IPDA Range
Bullish and bearish order blocks are also important IPDA reference points.
Suppose Institutional Order Flow shifts bearish.
Look back through the previous 60 trading days.
A bearish order block may exist above current price.
Price may retrace into this institutional reference point before continuing lower.
Below the market, an old low or Fair Value Gap may provide the objective.
The setup becomes:
Bearish Quarterly Shift
Then:
Retracement into bearish order block
Then:
Institutional selling
Then:
Price seeks sell-side liquidity
The order block provides the reaction area.
The Quarterly Shift provides the directional framework.
The IPDA lookback identifies the reference point.
Fair Value Gaps and Liquidity Voids in IPDA Data Ranges
Fair Value Gaps and liquidity voids can also remain important inside the 20, 40 and 60-day range.
Suppose price previously expanded aggressively higher.
A liquidity void remains below current price.
After a bearish Market Structure Shift, price may retrace higher and then move lower toward the void.
The gap provides a logical price delivery objective.
The opposite condition can occur after bullish market structure develops.
A Fair Value Gap above price may become a future draw.
The trader should therefore identify imbalances created during the previous three trading months.
These imbalances can help explain where the next Quarterly Shift may deliver price.
The ICT Cast Forward Process
After completing the lookback, ICT uses a process called the cast forward.
The same 20, 40 and 60 trading-day measurements are projected to the right.
The trader is now creating a future data range.
The idea is to anticipate when another important Daily setup or market shift may develop.
The cast forward is:
20 trading days forward
40 trading days forward
60 trading days forward
These projections create a future time horizon.
Michael J. Huddleston explains:
“We’re anticipating the next market shift in 20 to 60 trading days.”
The trader is not predicting the exact candle that will form.
The cast forward identifies a future period where the anticipated institutional setup may develop.
20-Day IPDA Data Range
The first cast-forward range is 20 trading days.
This represents approximately one trading month.
The trader studies whether price begins interacting with an important institutional reference point during this period.
A setup can form before the 20-day range is complete.
There is no rule requiring price to wait exactly 20 days.
The 20-day reference simply provides the first major time division inside the projected data range.
Ask:
Has price reached liquidity?
Has a Fair Value Gap been closed?
Has market structure shifted?
Is accumulation or distribution becoming visible?
The trader combines the time range with price action.
40-Day IPDA Data Range
The 40 trading-day range represents approximately two trading months.
If the anticipated setup has not completed during the first 20 days, price may continue delivering toward the higher timeframe objective.
The 40-day area can become another important period for studying:
- Liquidity runs
- Intermediate-term highs or lows
- Accumulation
- Distribution
- SMT divergence
- Daily Turtle Soup setups
The trader should not assume something must reverse exactly on day 40.
IPDA Data Ranges provide a framework.
Price still needs to show an institutional price action setup.
60-Day IPDA Data Range
The 60-day data range represents approximately three trading months.
This is the broader IPDA horizon used in the concept.
An anticipated Daily setup may take up to 60 trading days to form.
This explains why Quarterly Shift analysis requires patience.
The setup may take several weeks or months to develop.
However, the trader does not necessarily need to hold one position for 60 trading days.
The concept can provide:
- Daily directional bias
- Short-term trading context
- Swing trade direction
- Long-term price objectives
An intraday trader can still use the 60-day IPDA framework to determine which side of the market deserves more attention.
How the Lookback and Cast Forward Work Together
The lookback asks:
Where has price traded from?
What was the recent Institutional Order Flow?
Where is liquidity resting?
Which institutional reference points remain?
The cast forward asks:
When may the next important setup develop?
The complete process is:
Look back 60, 40 and 20 trading days
Then:
Identify recent Institutional Order Flow
Then:
Find liquidity and institutional reference points
Then:
Identify a Market Structure Shift
Then:
Calibrate the Quarterly Shift
Then:
Cast forward 20, 40 and 60 trading days
Then:
Wait for price to reach a logical institutional objective
Then:
Look for the next Daily setup
This gives the trader both price and time context.
ICT Smart Money Accumulation Buy Programs
The Quarterly Shift framework also studies smart money accumulation for buy programs.
A buy program is a sequence of bullish price delivery.
On the Daily Chart, this may appear as a series of higher Daily price swings that continues for days, weeks, or even several months.
The objective may be buy-side liquidity above recent highs.
ICT compares the underlying market with a benchmark to identify manipulation or relative strength.
The underlying is the asset being traded.
The benchmark is the related market used for comparison.
In Forex, DXY is commonly used as a benchmark for U.S. dollar-related currency pairs.
If one market fails to make the expected correlated or inverse price swing, the divergence can indicate institutional accumulation.
Benchmark Makes Lower Low, Underlying Makes Higher Low
Suppose two markets are positively correlated.
The benchmark makes a lower low.
The underlying should also make a lower low.
But the underlying forms a higher low.
The underlying is showing relative strength.
The condition is:
Benchmark lower low
but
Underlying higher low
This may indicate accumulation in the underlying.
Selling pressure cannot produce the expected lower low.
The trader may anticipate higher prices.
For example, if DXY makes a lower low while a positively correlated USD-based pair forms a higher low, the currency pair may be showing relative strength.
Underlying Makes Lower Low, Inverse Benchmark Makes Lower High
Now consider an inversely correlated relationship.
Suppose GBP/USD makes a lower low.
DXY should make a higher high.
But DXY only forms a lower high.
The dollar is failing to show the expected strength.
GBP/USD may be moving below an old low to take sell-side liquidity.
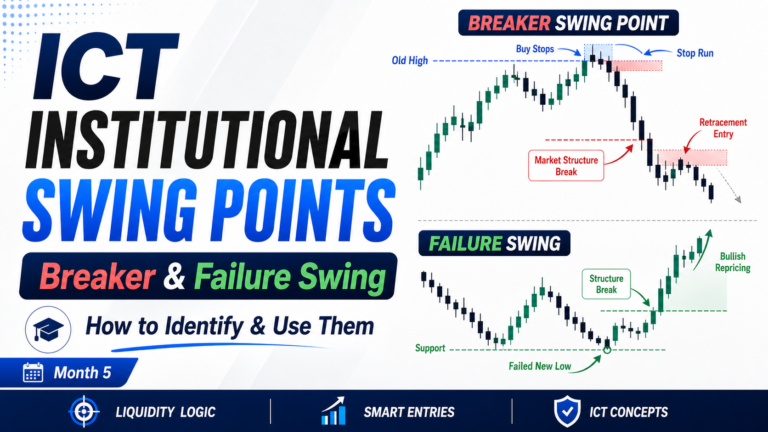
This can create a Daily Turtle Soup Long condition.
The sequence is:
GBP/USD lower low
DXY lower high
GBP/USD sell-side liquidity taken
DXY fails to confirm dollar strength
Bullish GBP/USD reversal may develop
This is a form of smart money accumulation for a buy program.
Benchmark Makes Higher High, Underlying Makes Higher Low
Another accumulation condition can occur when the benchmark makes a higher high but the inversely related underlying forms a higher low.
Suppose DXY makes a higher high.
EUR/USD would normally be expected to make a lower low.
Instead, EUR/USD forms a higher low.
EUR/USD is refusing to move lower.
The foreign currency is showing relative strength.
At the same time, DXY may be moving above an old high to take buy-side liquidity.
A Turtle Soup Sell may develop in DXY.
The relative strength in EUR/USD can support a future bullish buy program.
ICT Smart Money Distribution Sell Programs
The opposite process is used to identify smart money distribution for sell programs.
A sell program is a sequence of lower price delivery.
The move may continue for several Daily sessions or several months.
The trader again compares the underlying with a benchmark.
The purpose is to identify relative weakness.
A market that fails to produce an expected high may already be under distribution.
A market making a higher high without benchmark confirmation may only be taking buy-side liquidity.
These non-symmetrical conditions can help anticipate lower prices.
Benchmark Makes Higher High, Underlying Makes Lower High
Suppose positively correlated markets should both move higher.
The benchmark makes a higher high.
The underlying forms a lower high.
The underlying is showing relative weakness.
The condition is:
Benchmark higher high
but
Underlying lower high
This may indicate institutional distribution in the underlying market.
For example, DXY may make a higher high while USD/JPY forms a lower high.
USD/JPY is failing to confirm the benchmark strength.
The pair may be under distribution.
The trader can begin looking for a sell program.
Underlying Makes Higher High, Inverse Benchmark Makes Higher Low
Suppose GBP/USD makes a higher high.
Because DXY is inversely correlated, the Dollar Index should make a lower low.
Instead, DXY forms a higher low.
The move in GBP/USD is not confirmed.
The condition becomes:
GBP/USD higher high
DXY higher low
GBP/USD may simply be taking buy-side liquidity above an old high.
DXY is showing underlying strength.
A Turtle Soup Sell can form in GBP/USD.
The higher high that looks bullish may actually be part of a smart money distribution program.
Benchmark Makes Lower Low, Underlying Makes Lower High
Another distribution condition occurs when DXY makes a lower low but an inversely related foreign currency forms a lower high.
Suppose DXY moves below an old low.
EUR/USD should make a higher high.
But EUR/USD creates a lower high.
The euro is showing relative weakness.
DXY may simply be collecting sell-side liquidity below its old low.
The Dollar Index can reject the lower price and rally.
EUR/USD, already under distribution, may move aggressively lower.
The lower high in EUR/USD gives the trader information that the apparent DXY breakdown may be false.
IPDA Data Ranges and Turtle Soup
Turtle Soup is closely connected with the ICT Quarterly Shifts & IPDA Data Ranges concept.
The 20, 40 and 60-day lookback identifies old highs and lows.
These highs and lows can contain liquidity.
During the future IPDA range, price may attack one of these levels.
Suppose the Quarterly Shift is expected to be bullish.
An old low from the previous 60 trading days is present.
Price moves below that low.
Sell-side liquidity is taken.
The related benchmark fails to confirm further weakness.
A Turtle Soup Long may form.
The opposite can happen during a bearish Quarterly Shift.
Price moves above an old high from the IPDA lookback.
Buy-side liquidity is taken.
The benchmark indicates underlying weakness.
A Turtle Soup Sell may develop.
The IPDA Data Range helps the trader know which highs and lows to study before the liquidity run occurs.
IPDA Data Ranges and SMT Divergence
SMT divergence is an important part of identifying accumulation and distribution inside Quarterly Shifts.
Suppose DXY has shifted bullish.
EUR/USD should show corresponding weakness.
Inside the projected 20 to 60-day data range, DXY creates lower lows.
EUR/USD fails to create higher highs.
The euro is showing relative weakness.
This can indicate heavy distribution.
The trader may anticipate lower EUR/USD prices.
The important part is that the SMT divergence is not viewed randomly.
It appears inside a calibrated Quarterly Shift and IPDA Data Range.
This gives the divergence a broader macro context.
How to Use ICT Quarterly Shifts for Daily Bias
A trader does not need to be a position trader to use Quarterly Shifts.
Suppose Daily analysis indicates a bearish Quarterly Shift.
The next 20 to 60-day range is expected to deliver lower prices.
Sell-side liquidity remains below the marketplace.
An intraday trader can use this information as a directional filter.
The trader may focus on:
- Selling 4-hour bearish order blocks
- Selling 1-hour retracements
- Turtle Soup Sell setups
- Premium entries
- New York session short setups
The trader may ignore many counter-trend long setups.
The Quarterly Shift provides the macro framework.
The lower timeframe provides the execution.
How to Mark ICT IPDA Data Ranges
A simple marking process can be followed.
Step 1. Open the Daily Chart
The Quarterly Shift and IPDA process is primarily a higher timeframe concept.
Step 2. Identify the Previous Completed Month
Use the first trading day of the most recent completed calendar month as the initial reference.
Step 3. Mark 20 Trading Days Back
This represents approximately one trading month.
Step 4. Mark 40 Trading Days Back
This represents approximately two trading months.
Step 5. Mark 60 Trading Days Back
This represents approximately three trading months.
Step 6. Determine Recent Institutional Order Flow
Was price collectively trading higher or lower?
Step 7. Identify the Significant Intermediate-Term High or Low
Find the obvious origin or extreme associated with recent price delivery.
Step 8. Look for a Market Structure Shift
Identify where the previous Institutional Order Flow was interrupted.
Step 9. Mark Institutional Reference Points
Study old highs, old lows, order blocks, Fair Value Gaps, liquidity voids, and Rejection Blocks.
Step 10. Cast Forward 20, 40 and 60 Trading Days
Create the future IPDA time horizon.
Step 11. Compare the Underlying and Benchmark
Look for accumulation or distribution through SMT divergence.
Step 12. Wait for the Daily Setup
The final trade should still be supported by price action.
The time range alone is not an entry signal.
A Simple Bullish Quarterly Shift Example
Suppose the previous 60 trading days were bearish.
Price moved lower from a significant Daily high.
During the recent data range, several old highs remain above the market.
Price then breaks above an important Daily high.
Institutional Order Flow shifts bullish.
The trader calibrates the Quarterly Shift.
Now cast forward 20, 40 and 60 trading days.
During the future data range, look for:
- Sell-side liquidity runs
- Daily bullish order blocks
- Bullish Fair Value Gaps
- Benchmark divergence showing relative strength
- Accumulation
Price may retrace lower.
But the trader does not automatically become bearish.
The Quarterly Shift suggests a potential buy program.
A run below an old low may create a Turtle Soup Long.
The higher objectives may be the old highs identified during the IPDA lookback.
A Simple Bearish Quarterly Shift Example
Suppose the previous 60 trading days were bullish.
Price moved higher from a significant Daily low.
Several old lows remain below the marketplace.
Price then breaks below an important Daily low.
Institutional Order Flow shifts bearish.
The trader calibrates the Quarterly Shift.
Cast forward 20, 40 and 60 trading days.
During the projected data range, look for:
- Buy-side liquidity runs
- Daily bearish order blocks
- Bearish Fair Value Gaps
- Relative weakness
- Distribution
Price may retrace higher to close a liquidity void.
This retracement does not necessarily indicate renewed bullishness.
If the bearish Quarterly Shift remains valid, the retracement can provide a selling opportunity.
The lower objectives may be old lows and sell-side liquidity identified during the lookback.
Common Mistakes With ICT IPDA Data Ranges
The first mistake is counting calendar days instead of trading days.
ICT uses trading days.
The second mistake is treating day 20, 40 or 60 as an automatic reversal date.
The time range gives context. Price must still form an institutional setup.
The third mistake is ignoring Institutional Order Flow.
The trader must understand what price did during the previous 60 trading days.
The fourth mistake is marking every high and low.
Focus on the most important institutional reference points.
The fifth mistake is using lower timeframes to define the Quarterly Shift.
The concept is primarily calibrated from Daily and higher timeframe price action.
The sixth mistake is assuming a Quarterly Shift always reverses the primary trend.
A shift can produce consolidation or an intermediate retracement.
The seventh mistake is ignoring the benchmark relationship.
SMT divergence can reveal accumulation or distribution inside the IPDA range.
What ICT Quarterly Shifts Really Tell the Trader
The concept does not tell the trader:
Buy exactly on day 20.
It does not say:
Sell exactly on day 60.
The real purpose is to create a measurable macro framework.
The lookback tells the trader where important price references were created.
The Market Structure Shift tells the trader that Institutional Order Flow may be changing.
The cast forward gives a time horizon for the next important setup.
SMT divergence helps identify accumulation or distribution.
Liquidity and institutional reference points tell the trader where price may move.
The concept combines:
Time
Price
Market structure
Liquidity
Institutional Order Flow
This is why ICT Quarterly Shift analysis can support many different styles of trading.
Final Thoughts
The ICT Quarterly Shifts & IPDA Data Ranges concept teaches traders to analyse the market in three-to-four-month segments and study recent Daily price data through 20, 40 and 60 trading-day ranges.
The process begins with the lookback.
Use the previous completed calendar month as an initial reference.
Look back 20, 40 and 60 trading days.
Determine whether recent Institutional Order Flow was bullish or bearish.
Identify the significant intermediate-term high or low.
Mark liquidity, order blocks, Fair Value Gaps, liquidity voids, and Rejection Blocks.
Then look for a Market Structure Shift.
Once the shift is calibrated, cast forward 20, 40 and 60 trading days.
The future IPDA Data Range creates a time horizon where another important Daily setup may develop.
Inside that future range, compare the underlying with its benchmark.
Study SMT divergence.
Look for smart money accumulation or distribution.
Anticipate Turtle Soup setups around old highs and lows.
Most importantly, do not treat the 20, 40 and 60-day measurements as automatic trade signals.
They provide context.
Michael J. Huddleston explains the core process as looking back to find where liquidity is resting and looking forward to anticipate the next setup.
That is the real purpose of the ICT Quarterly Shifts & IPDA Data Ranges concept.
Look back to understand the recent institutional price delivery.
Calibrate the Market Structure Shift.
Identify the liquidity.
Cast forward into the next 20, 40 and 60 trading days.
Then wait for price to reveal the next institutional setup.