The ICT Suspension Block is a PD Array introduced by Michael J. Huddleston, the founder of ICT or Inner Circle Trader, during his 2025 Lecture Series. He explained the concept in his September 30, 2025 lecture titled “ICT Suspension Block & Review.”
The concept describes a particular candle that sits between two volume imbalances. One volume imbalance forms below its body and another forms above it. The wick of the candle immediately to its left overlaps the body of the Suspension Block candle, which prevents the structure from forming a traditional Fair Value Gap.
When price returns to this area, the complete structure may behave like support in bullish conditions or resistance in bearish conditions. However, the Suspension Block is not a standalone entry signal. Its value comes from where it forms, why price is moving and what liquidity the market is likely to target next.
What Is an ICT Suspension Block?
An ICT Suspension Block is a single candle positioned between two body-to-body volume imbalances.
The candle before it creates the first volume imbalance. The candle after it creates the second volume imbalance. This leaves the middle candle suspended between two inefficiently delivered price ranges.
Three features must be present:
- A volume imbalance below the Suspension Block candle
- A volume imbalance above the Suspension Block candle
- The wick of the candle on the left must completely overlap the body of the Suspension Block candle
The third condition is important. Without the wick overlap, the structure may create a Fair Value Gap or simply represent two nearby volume imbalances. It would not match the Suspension Block formation taught by ICT.
The candle body and the two surrounding volume imbalances form the complete Suspension Block zone.
Understanding Volume Imbalance
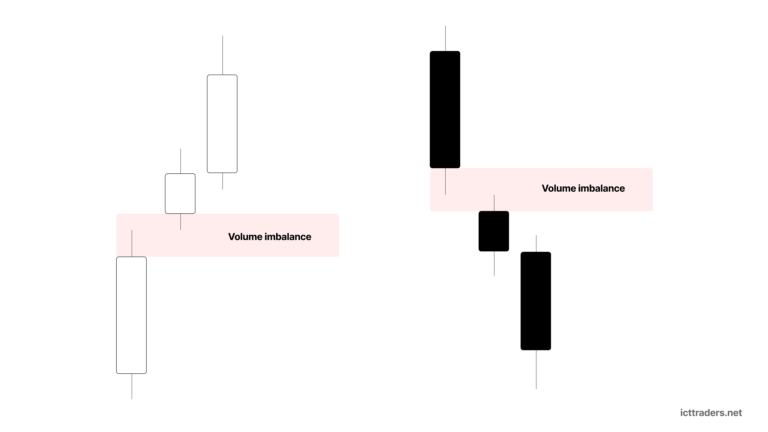
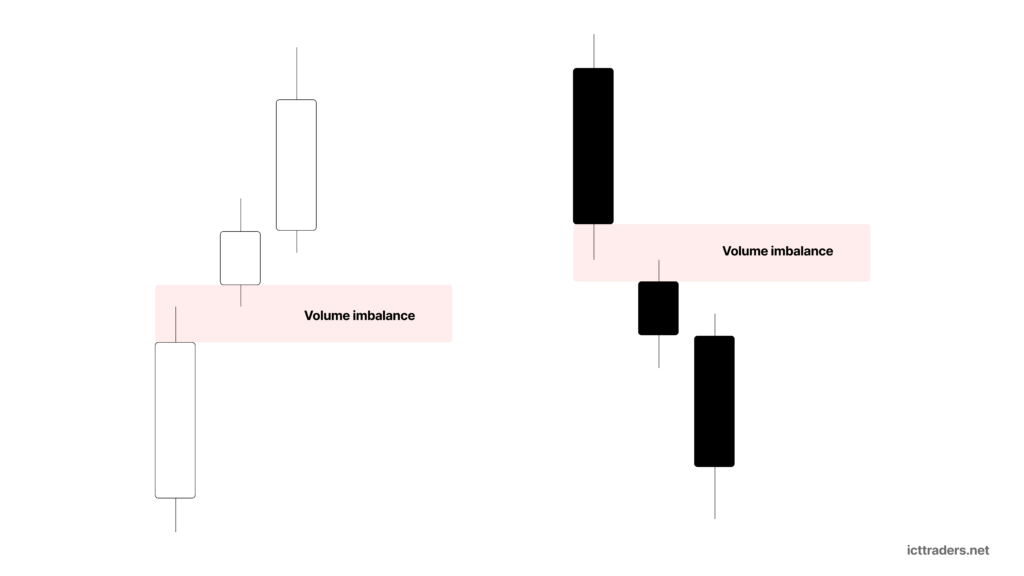
A volume imbalance is different from a Fair Value Gap.
A volume imbalance appears when there is separation between the bodies of two consecutive candles. It is measured using the close of one candle and the open of the following candle.
A bullish volume imbalance forms when the next candle opens above the previous candle’s close.
A bearish volume imbalance forms when the next candle opens below the previous candle’s close.
The candle wicks are allowed to overlap. The imbalance exists because there is separation between the candle bodies, not because there is an empty space between their wicks.
This distinction matters because the Suspension Block is built around two volume imbalances. Traders who only look for wick gaps will often miss the formation.
How an ICT Suspension Block Forms
A Suspension Block requires three candles, but the middle candle is the actual Suspension Block.
The first candle creates the volume imbalance on one side of the middle candle. The third candle creates the volume imbalance on the other side.
The first candle’s wick must also extend across the complete body of the middle candle. This wick overlap means there is no traditional Fair Value Gap surrounding the middle candle.
Depending on the direction of the middle candle, the structure can be classified as bullish or bearish.
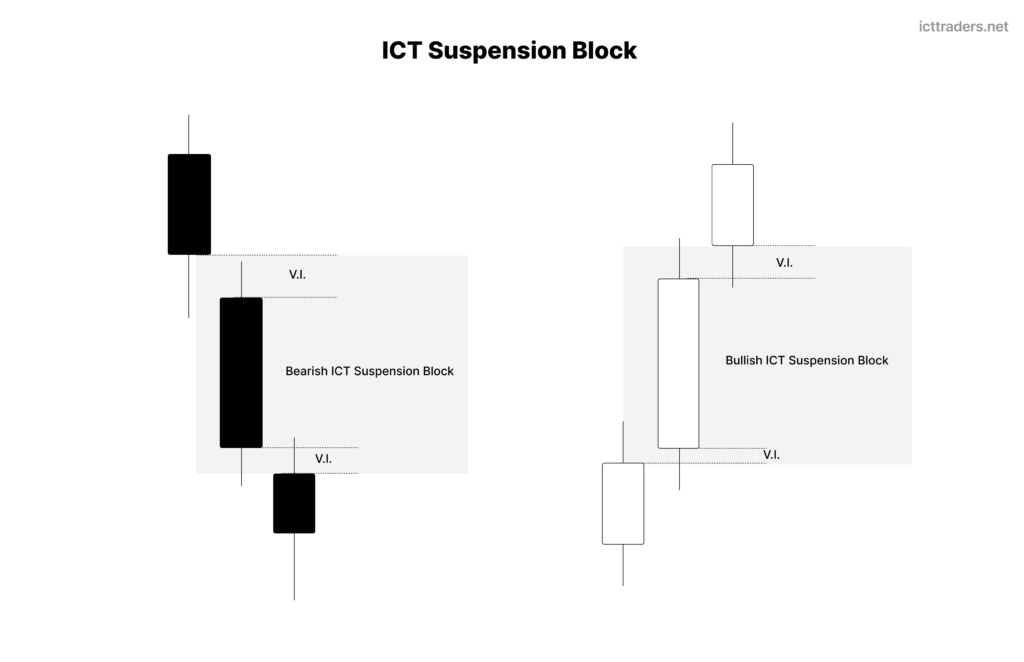
Bullish ICT Suspension Block
A bullish Suspension Block has a bullish middle candle.
The formation contains the following conditions:
- The middle candle closes above its opening price
- The middle candle opens above the close of the candle on its left
- The candle on the right opens above the close of the middle candle
- The wick of the candle on the left overlaps the complete body of the bullish middle candle
The separation between the first candle’s close and the middle candle’s open creates the lower volume imbalance.
The separation between the middle candle’s close and the third candle’s open creates the upper volume imbalance.
The bullish candle is therefore sitting between two bullish volume imbalances.
Although the first candle’s body closes below the middle candle’s opening price, its wick extends upward and covers the middle candle’s body. This is the detail that distinguishes the Suspension Block from a normal three-candle imbalance.
A bullish Suspension Block is mainly used as a potential support area. Traders watch for price to retrace from above and react within the block.
Bearish ICT Suspension Block
A bearish Suspension Block has a bearish middle candle.
The formation contains the following conditions:
- The middle candle closes below its opening price
- The middle candle opens below the close of the candle on its left
- The candle on the right opens below the close of the middle candle
- The wick of the candle on the left overlaps the complete body of the bearish middle candle
The separation between the first candle’s close and the middle candle’s open creates the upper volume imbalance.
The separation between the middle candle’s close and the third candle’s open creates the lower volume imbalance.
The bearish candle is suspended between these two bearish volume imbalances.
A bearish Suspension Block is mainly treated as a potential resistance area. Traders watch for price to retrace from below and reject the block.
How to Identify an ICT Suspension Block
Start by looking for a clear body-to-body volume imbalance.
Once you find one, inspect the candle beside it and determine whether another volume imbalance exists on the opposite side of that candle.
Do not immediately mark the formation. First check the wick of the candle on the left. That wick must overlap the complete body of the possible Suspension Block candle.
For a bullish Suspension Block, the left candle’s upper wick should reach across the body of the bullish middle candle.
For a bearish Suspension Block, the left candle’s lower wick should reach across the body of the bearish middle candle.
The easiest way to identify the pattern is to check the chart in this order:
- Find a body-to-body volume imbalance.
- Check whether the next candle creates another volume imbalance.
- Identify the candle positioned between those two imbalances.
- Confirm whether that middle candle is bullish or bearish.
- Check whether the previous candle’s wick completely overlaps its body.
- Study the market context before treating the formation as a tradeable PD Array.
The wick-overlap requirement should not be ignored. A candle with a volume imbalance above and below it is not automatically a valid Suspension Block.
How to Draw an ICT Suspension Block on the Chart
The complete Suspension Block includes the middle candle’s body and both surrounding volume imbalances.
To draw it, use the close of the first candle and the open of the third candle.
For a bullish Suspension Block, the close of the first candle forms the lower boundary. The open of the third candle forms the upper boundary.
For a bearish Suspension Block, the close of the first candle forms the upper boundary. The open of the third candle forms the lower boundary.
Draw a rectangle between these two prices and extend it toward the right side of the chart.
This complete zone contains:
- The first volume imbalance
- The body of the Suspension Block candle
- The second volume imbalance
Do not mark only the body of the middle candle. The surrounding volume imbalances are part of the structure and help define the complete price range that may later support or resist price.
You can also mark the midpoint of the zone. In ICT terminology, this 50 percent level is called Consequent Encroachment.
The midpoint can be calculated by adding the upper and lower boundaries and dividing the result by two.
Price may react from the beginning of the zone, from its midpoint or after trading deeper into the block. The midpoint is a useful reference, but it should not be treated as a guaranteed reversal level.
ICT Suspension Block and Fair Value Gap Difference
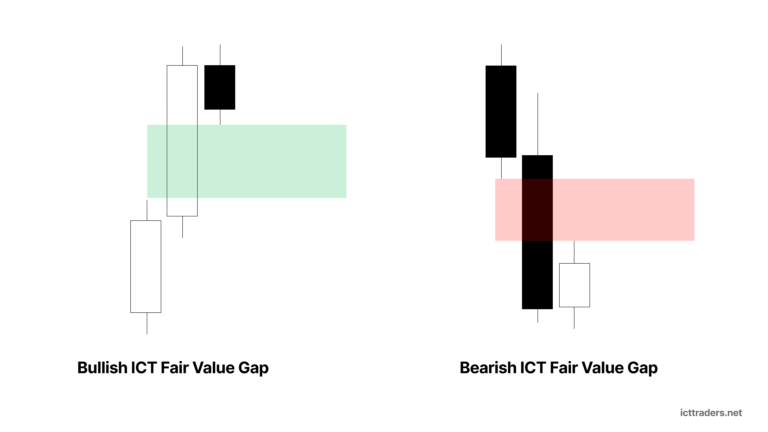
A Fair Value Gap is based on the relationship between the wicks of the first and third candles in a three-candle formation.
In a bullish Fair Value Gap, the high of the first candle remains below the low of the third candle.
In a bearish Fair Value Gap, the low of the first candle remains above the high of the third candle.
A Suspension Block is different because the wick of the candle on the left overlaps the body of the middle candle. This overlap prevents the formation from becoming a standard Fair Value Gap.
The inefficiency is found between the candle bodies instead.
A Fair Value Gap is therefore identified through wick-to-wick separation, while a Suspension Block is built around two body-to-body volume imbalances and one wick-overlapped candle.
Why the Suspension Block Matters
Price does not always leave a clean Fair Value Gap during displacement.
Sometimes the candle wicks overlap, but the opens and closes still reveal inefficient price delivery. The Suspension Block helps traders recognise this less obvious form of imbalance.
The structure can become an area where price may rebalance before continuing in the direction of the larger move.
A bullish Suspension Block may support price during a retracement.
A bearish Suspension Block may resist price during a retracement.
Its presence tells the trader that price moved through the area with body-to-body inefficiency, even though the overlapping wick hides the structure from traders who only study traditional Fair Value Gaps.
How to Use a Bullish Suspension Block
A bullish Suspension Block should be used when the broader market narrative supports higher prices.
Begin with the higher timeframe. Determine whether price is trading in discount, whether sell-side liquidity has recently been taken and whether there is a logical draw on buy-side liquidity.
After the bullish narrative has been established, move to the execution timeframe and look for bullish displacement or a Market Structure Shift.
If a bullish Suspension Block forms during that displacement, mark the complete zone and wait for price to retrace.
The first touch of the block is not always enough to enter. A conservative trader can wait for price to react inside the block and produce lower-timeframe confirmation.
Useful confirmation may include:
- A sweep of short-term sell-side liquidity
- A bullish Market Structure Shift
- A bullish Change in State of Delivery
- Strong bullish displacement
- A lower-timeframe Fair Value Gap
- Rejection from the midpoint of the Suspension Block
A protective stop may be placed below the Suspension Block candle, below the complete zone or below the low responsible for the bullish reversal. The correct placement depends on the market structure and the trader’s risk model.
The profit target should be based on the next logical draw on liquidity. This may include an old high, equal highs, the previous session high or another higher-timeframe objective.
How to Use a Bearish Suspension Block
A bearish Suspension Block should be used when the broader market narrative supports lower prices.
Look for price trading in premium, a recent sweep of buy-side liquidity or a higher-timeframe bearish PD Array. There should also be a clear sell-side liquidity target below the market.
Once the bearish narrative is established, wait for bearish displacement or a Market Structure Shift.
If a bearish Suspension Block forms during that move, mark the complete zone and wait for price to retrace from below.
When price returns, watch whether the block acts as resistance.
Possible bearish confirmation includes:
- A sweep of short-term buy-side liquidity
- A bearish Market Structure Shift
- A bearish Change in State of Delivery
- Strong bearish displacement
- A lower-timeframe bearish Fair Value Gap
- Rejection from the midpoint or upper section of the block
A protective stop may be placed above the Suspension Block candle, above the complete zone or above the high responsible for the bearish reversal.
Possible targets include old lows, equal lows, the previous session low or another sell-side liquidity pool.
ICT-related trading guides commonly combine the Suspension Block with higher-timeframe premium or discount, a Market Structure Shift and a retracement into the block before entry.
Aggressive and Conservative Entry Methods
An aggressive entry involves placing an order directly inside the Suspension Block.
The trader may use the beginning of the zone, the candle body or the midpoint as the entry price. This method can offer a tighter stop and a better reward-to-risk ratio, but it provides less confirmation.
A conservative entry requires price to enter the Suspension Block and then show evidence of rejection.
The trader may wait for a lower-timeframe liquidity sweep, market structure shift or displacement before entering. This often produces a later entry, but it reduces the risk of entering while price is simply moving through the zone.
Neither approach is automatically better. The entry style should match the trader’s experience, risk tolerance and understanding of the larger market narrative.
What Makes a Suspension Block High Probability?
The pattern itself is not enough. Several factors can improve its importance.
A stronger bullish Suspension Block usually forms after sell-side liquidity has been taken and price begins delivering toward a clear buy-side target.
A stronger bearish Suspension Block usually forms after buy-side liquidity has been taken and price begins delivering toward sell-side liquidity.
The block becomes more useful when it forms:
- Inside a higher-timeframe premium or discount area
- Near a higher-timeframe PD Array
- During clear displacement
- After a liquidity sweep
- During an active trading session
- In line with the daily or intraday bias
- Before price reaches its main liquidity objective
A Suspension Block that appears in the middle of random consolidation has less meaning. Choppy price action can produce many small body imbalances without showing genuine directional delivery.
When the Suspension Block Fails
A bullish Suspension Block becomes weak when price trades through the complete zone and closes below its lower boundary.
A bearish Suspension Block becomes weak when price trades through the zone and closes above its upper boundary.
A wick through the block does not always invalidate it. Price may trade beyond the body while still respecting the larger swing low or swing high.
The wider market structure should decide whether the trade idea remains valid.
The block should no longer be trusted when:
- Price closes decisively beyond its far boundary
- The market breaks the swing supporting the setup
- The higher-timeframe bias changes
- The expected liquidity target is no longer valid
- Price repeatedly trades through the zone without reacting
Repeated testing can also reduce the importance of the area because more of the original imbalance has already been rebalanced.
Common Mistakes
The most common mistake is marking every candle positioned between two body gaps as a Suspension Block. The wick of the previous candle must overlap the complete body of the middle candle.
Another mistake is looking only at candle wicks. The two volume imbalances are identified through opens and closes.
Some traders mark only the middle candle body. This leaves out the two volume imbalances that form the complete structure.
Traders also confuse the pattern with a Fair Value Gap. The Suspension Block contains wick overlap, while the Fair Value Gap requires wick separation.
The final mistake is trading every Suspension Block without considering liquidity, premium and discount, displacement or directional bias. A PD Array identifies a possible reaction area. It does not tell the trader that every reaction is worth trading.
ICT Suspension Block Checklist
Before marking the pattern, confirm the following:
- There is a clear middle candle.
- A body-to-body volume imbalance exists below the middle candle.
- Another body-to-body volume imbalance exists above the middle candle.
- The wick of the candle on the left completely overlaps the middle candle’s body.
- The structure is not a traditional Fair Value Gap.
- The complete zone has been drawn from the first candle’s close to the third candle’s open.
- The midpoint of the zone has been identified when refinement is needed.
Before entering a trade, confirm the following:
- The higher-timeframe direction is clear.
- Price is positioned logically in premium or discount.
- Relevant buy-side or sell-side liquidity has been taken.
- The Suspension Block formed during meaningful displacement.
- Price has retraced into the zone rather than already moving far away from it.
- The block supports the expected market direction.
- Lower-timeframe confirmation is present when required.
- The invalidation level is clear.
- The stop loss is outside the normal price movement of the setup.
- A logical liquidity target has been selected before entry.
- The expected reward justifies the risk.
- The trade follows the trader’s risk-management rules.
Final Thoughts
The ICT Suspension Block gives traders another way to study inefficient price delivery when a clean Fair Value Gap is not present.
Its structure is built around one candle, two volume imbalances and a wick from the previous candle that overlaps the entire body of the Suspension Block candle.
The block can later provide support in bullish market conditions or resistance in bearish conditions. Its usefulness increases when it agrees with higher-timeframe direction, liquidity, premium and discount, displacement and market structure.
The most important part is identifying the formation correctly. A candle sitting between two volume imbalances is not enough. The wick-overlap condition must also be present.
Once the structure is confirmed, draw the complete range, wait for price to return and judge the reaction within the wider market narrative. The Suspension Block shows a potential location for price to respond, but liquidity and directional context explain whether the response is worth trading.