ICT SIBI and BISI are directional price imbalances used in the ICT (Inner Circle Trader) trading framework developed by Michael J. Huddleston. These concepts help traders identify areas where price has moved aggressively in one direction and created inefficient price delivery.
In simple terms:
BISI = Buy Side Imbalance Sell Side Inefficiency
SIBI = Sell Side Imbalance Buy Side Inefficiency
Both are closely related to the ICT Fair Value Gap (FVG) concept. Michael J. Huddleston teaches Fair Value Gaps in the official ICT Mentorship Core Content – Month 4, and his official channel has continued to teach FVG application in later mentorship material.
The main difference is direction.
BISI → Bullish Imbalance
SIBI → Bearish Imbalance
Understanding these two terms makes it easier to read directional price delivery, identify inefficiencies and frame retracement entries within an ICT trading model.
What Is an Imbalance in ICT Trading?
Before understanding SIBI and BISI, first understand price imbalance.
In a balanced market, price should theoretically provide opportunities for both buying and selling transactions.
Price trades upward and downward.
Buyers interact with sellers.
Sellers interact with buyers.
However, sometimes price moves aggressively in one direction.
For example:
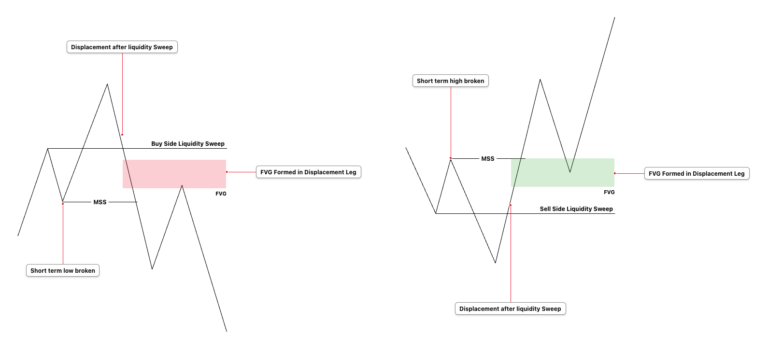
Sell-Side Liquidity Taken → Strong Bullish Displacement → Rapid Price Expansion Higher
During the aggressive bullish move, price spends very little time trading at certain price levels.
The market delivers aggressively toward the buy side.
As a result, the price range may show an imbalance.
The same can happen in the opposite direction:
Buy-Side Liquidity Taken → Strong Bearish Displacement → Rapid Price Expansion Lower
This aggressive delivery creates a bearish imbalance.
The three-candle Fair Value Gap framework is one of the primary ways ICT traders visually identify these inefficient price-delivery areas. The official ICT Mentorship Core Content includes a dedicated Fair Value Gap lesson in Month 4.
These directional imbalances are described as:
BISI during bullish delivery
SIBI during bearish delivery
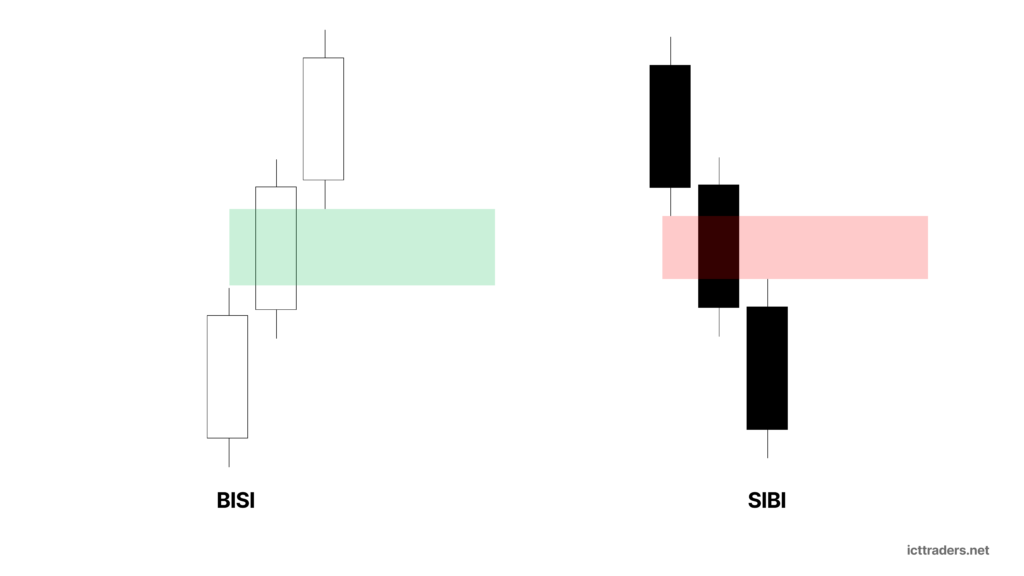
What Is ICT BISI?
BISI stands for Buy Side Imbalance Sell Side Inefficiency.
It is a bullish price imbalance.
A BISI forms when price expands aggressively higher and leaves an inefficiently traded price range behind.
The basic sequence is:
Price Trades Lower → Strong Bullish Displacement → Price Expands Higher → BISI Forms
The aggressive buying pressure causes price to move upward rapidly.
Buy-side price delivery dominates.
However, there is insufficient opposing sell-side delivery within a portion of the move.
Therefore:
Buy Side = Imbalanced
Sell Side = Inefficiently Delivered
This creates the term:
Buy Side Imbalance Sell Side Inefficiency
Or:
BISI
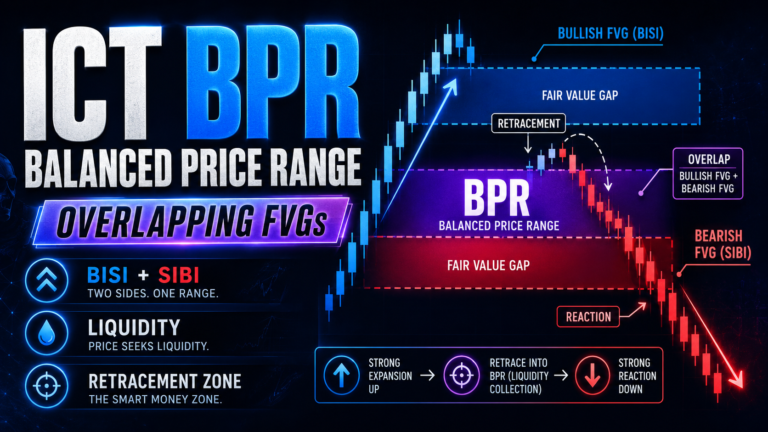
A BISI is generally viewed as a bullish Fair Value Gap.
How to Identify a BISI on the Chart
A BISI commonly appears within a three-candle price formation.
We can identify the candles as:
Candle 1
Candle 2
Candle 3
Candle 2 is generally the strong bullish displacement candle.
The BISI exists when:
The high of Candle 1 does not overlap with the low of Candle 3.
The space between these two prices forms the bullish imbalance.
The structure looks like:
Candle 1 High → BISI/FVG → Candle 3 Low
Suppose:
Candle 1 High = 21,100
Candle 3 Low = 21,110
There is no overlap between:
21,100 and 21,110
Therefore, the price range between these two levels is a BISI.
The BISI range is:
Lower Boundary = Candle 1 High
Upper Boundary = Candle 3 Low
Price moved upward too aggressively to provide balanced two-sided delivery within this area.
Why Does a BISI Form?
A BISI commonly forms during strong bullish displacement.
For example:
Sell-Side Liquidity Taken → Bullish Market Structure Shift → Aggressive Buying → BISI Created
Price may have a reason to reprice higher.
Possible market conditions include:
A liquidity sweep.
A shift in market structure.
Higher timeframe bullish order flow.
Price moving toward buy-side liquidity.
Price repricing from a discount PD Array.
A bullish macro or session price-delivery objective.
The aggressive movement creates an area of inefficient price delivery.
The BISI becomes evidence that price delivered strongly toward the buy side.
However, the BISI itself does not automatically tell the trader why price moved.
The trader must understand the broader ICT market narrative.
How to Use BISI in ICT Trading
A BISI is generally used during a bullish trading narrative.
Suppose the higher timeframe suggests that price is drawing toward buy-side liquidity.
The trader may wait for:
Sell-Side Liquidity Sweep → Bullish MSS → Bullish Displacement → BISI Forms
Instead of chasing bullish displacement, the trader marks the BISI.
Price may later retrace into the imbalance.
The sequence becomes:
Bullish Displacement → BISI Created → Price Expands Higher → Retracement Into BISI → Bullish Reaction
The trader may look for a long entry when the BISI agrees with the broader bullish narrative.
A basic bullish BISI model is:
1. Identify bullish higher timeframe bias
2. Determine the bullish draw on liquidity
3. Wait for sell-side liquidity to be taken
4. Identify bullish displacement
5. Mark the BISI
6. Wait for price to retrace
7. Look for bullish confirmation
8. Target buy-side liquidity
The BISI is the PD Array used for retracement or entry refinement.
It should not replace directional bias.
What Is ICT SIBI?
SIBI stands for Sell Side Imbalance Buy Side Inefficiency.
It is a bearish price imbalance.
A SIBI forms when price expands aggressively lower and leaves inefficient price delivery behind.
The basic sequence is:
Price Trades Higher → Strong Bearish Displacement → Price Expands Lower → SIBI Forms
During this movement, sell-side delivery dominates.
Price moves lower rapidly.
There is insufficient opposing buy-side delivery within a portion of the bearish expansion.
Therefore:
Sell Side = Imbalanced
Buy Side = Inefficiently Delivered
This creates the term:
Sell Side Imbalance Buy Side Inefficiency
Or:
SIBI
A SIBI is generally viewed as a bearish Fair Value Gap.
How to Identify a SIBI on the Chart
SIBI also uses the common three-candle imbalance structure.
The candles are:
Candle 1
Candle 2
Candle 3
Candle 2 generally shows strong bearish displacement.
A SIBI exists when:
The low of Candle 1 does not overlap with the high of Candle 3.
The inefficient price range exists between:
Candle 3 High → SIBI/FVG → Candle 1 Low
For example:
Candle 1 Low = 6,200
Candle 3 High = 6,190
There is no overlap between:
6,190 and 6,200
The 10-point range forms a SIBI.
The boundaries are:
Upper Boundary = Candle 1 Low
Lower Boundary = Candle 3 High
Price delivered aggressively lower without balanced buying and selling within the range.
Why Does a SIBI Form?
A SIBI commonly appears during strong bearish displacement.
For example:
Buy-Side Liquidity Taken → Bearish Market Structure Shift → Aggressive Selling → SIBI Created
The bearish expansion may occur because price is seeking lower liquidity.
Possible conditions include:
Buy-side liquidity has been taken.
Price is trading from a premium PD Array.
The higher timeframe draw is lower.
Bearish institutional order flow is present.
Price has shifted from bullish to bearish delivery.
The market is repricing toward sell-side liquidity.
The SIBI shows strong bearish price delivery.
But similar to a BISI, it should be analyzed within the complete market narrative.
How to Use SIBI in ICT Trading
A SIBI is generally used within a bearish trading narrative.
Suppose the Daily and 4H analysis suggests that price is seeking sell-side liquidity.
The trader may wait for:
Buy-Side Liquidity Sweep → Bearish MSS → Bearish Displacement → SIBI Forms
The trader does not need to chase the bearish expansion.
Instead:
Mark SIBI → Wait for Retracement → Observe Price Reaction
The complete sequence may look like:
Bearish Displacement → SIBI Created → Price Expands Lower → Price Retraces Into SIBI → Bearish Reaction
A basic bearish SIBI model is:
1. Identify bearish higher timeframe bias
2. Determine the bearish draw on liquidity
3. Wait for buy-side liquidity to be taken
4. Identify bearish displacement
5. Mark the SIBI
6. Wait for price to retrace higher
7. Look for bearish confirmation
8. Target sell-side liquidity
The SIBI acts as a bearish PD Array for trade refinement.
ICT SIBI vs BISI
The easiest way to understand the difference is direction.
| Concept | Full Form | Direction | FVG Type | Expected Reaction |
|---|---|---|---|---|
| BISI | Buy Side Imbalance Sell Side Inefficiency | Bullish | Bullish FVG | Price may react higher |
| SIBI | Sell Side Imbalance Buy Side Inefficiency | Bearish | Bearish FVG | Price may react lower |
Remember:
BISI → Bullish
SIBI → Bearish
Another simple way to identify them:
Strong move upward leaves a gap below price → BISI
Strong move downward leaves a gap above price → SIBI
BISI supports a bullish price-delivery idea.
SIBI supports a bearish price-delivery idea.
Consequent Encroachment of SIBI and BISI
The Consequent Encroachment, or CE, is the 50% midpoint of the imbalance.
For a BISI:
BISI Low → 50% CE → BISI High
For a SIBI:
SIBI Low → 50% CE → SIBI High
Suppose a BISI exists between:
21,100 and 21,110
The total BISI range is:
10 points
The midpoint is:
21,105
Therefore:
BISI CE = 21,105
The trader may monitor how price behaves around this midpoint.
Bullish Example:
BISI Created → Price Expands Higher → Retraces Into BISI → Reaches CE → Bullish Reaction
Bearish Example:
SIBI Created → Price Expands Lower → Retraces Into SIBI → Reaches CE → Bearish Reaction
The CE does not guarantee a reversal.
It is simply an internal midpoint of the Fair Value Gap.
Michael J. Huddleston’s official channel continues to treat Fair Value Gap execution as a concept requiring correct application and market context, including dedicated FVG teaching in both the Core Content and later mentorship material.
Rebalancing SIBI and BISI
Price may later return to an imbalance.
This process is commonly called rebalancing the inefficiency.
Suppose bullish displacement creates a BISI.
The original movement is:
100 → 101 → 105 → 110
Price moved aggressively higher.
A portion of the range was inefficiently delivered.
Later:
110 → 108 → 106 → BISI
Price returns to the imbalance.
The market is trading back into the inefficient range.
The trader may describe this as price rebalancing the BISI.
For a SIBI:
Bearish Expansion → SIBI Created → Price Moves Lower → Retracement Higher → SIBI Revisited
Price can partially rebalance the FVG.
Price can reach Consequent Encroachment.
Price can completely fill the imbalance.
Therefore, do not assume price must always completely fill every SIBI or BISI.
The reaction may occur from different depths within the PD Array.
What Happens When a BISI Fails?
Suppose a bullish BISI forms.
Normally, a bullish trader expects the BISI to support price.
But instead:
Price Retraces Into BISI → Trades Completely Through BISI → Strong Bearish Displacement Continues
The bullish imbalance may fail to support price.
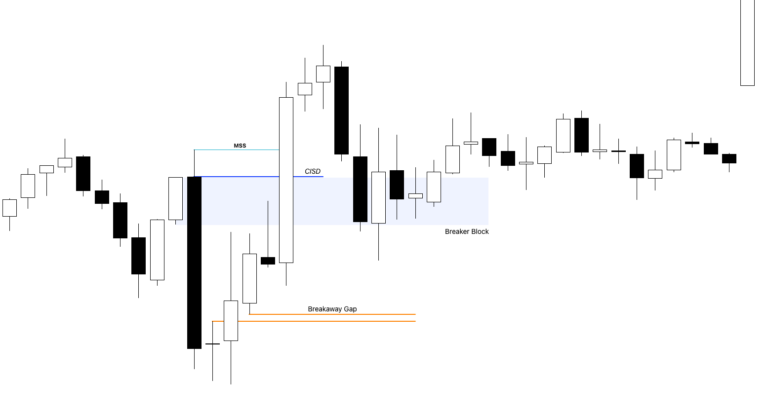
In certain market conditions, a failed Fair Value Gap can later become an Inversion Fair Value Gap.
For example:
Bullish BISI Fails → Price Trades Bearishly Through BISI → Price Retraces From Below → Former BISI Acts as Bearish Resistance
The original bullish PD Array has changed its practical function within price delivery.
However, a trader should not label a BISI failed simply because price trades a few ticks beyond its Consequent Encroachment.
Study:
The entire FVG range.
Candle closes.
Displacement.
Market structure.
The protected high or low.
The higher timeframe narrative.
A meaningful failure generally requires stronger evidence than a simple CE penetration.
What Happens When a SIBI Fails?
The opposite applies to a SIBI.
Suppose a bearish SIBI forms.
The expectation is bearish.
However:
Price Retraces Higher → Trades Through SIBI → Strong Bullish Displacement Continues
The bearish imbalance may no longer act as resistance.
A possible sequence is:
Bearish SIBI Fails → Bullish Displacement Through SIBI → Retracement From Above → Former SIBI Supports Price
The original bearish FVG may function as an inversion structure.
Again, context is important.
Do not automatically trade every failed SIBI as an inversion.
The trader should look for:
Liquidity event.
Directional displacement.
Market Structure Shift.
Change in the State of Delivery.
Higher timeframe alignment.
A clear draw on liquidity.
Higher Timeframe SIBI and BISI
SIBI and BISI can appear on every timeframe.
For example:
Monthly.
Weekly.
Daily.
4H.
1H.
15 Minute.
5 Minute.
1 Minute.
However, the purpose of the imbalance changes depending on the timeframe.
A Daily BISI may act as a higher timeframe bullish PD Array.
A 1-minute BISI may simply refine an intraday entry.
For example:
Daily BISI → Higher Timeframe Bullish PD Array
15-Minute Sell-Side Liquidity Sweep → Bullish MSS
1-Minute BISI → Entry Refinement
The trader is combining multiple layers of price delivery.
Another example:
4H SIBI → Higher Timeframe Bearish PD Array
New York Buy-Side Liquidity Sweep → Bearish MSS
1-Minute SIBI → Short Entry Refinement
The lower timeframe imbalance should ideally agree with the higher timeframe narrative.
How to Trade SIBI and BISI With Liquidity
SIBI and BISI become more useful when combined with liquidity.
A bullish trade model may look like:
Sell-Side Liquidity → Sweep → Bullish Displacement → BISI → Retracement → Buy-Side Liquidity
A bearish trade model may look like:
Buy-Side Liquidity → Sweep → Bearish Displacement → SIBI → Retracement → Sell-Side Liquidity
The liquidity event provides context.
The displacement provides directional evidence.
The BISI or SIBI provides the retracement PD Array.
The opposing liquidity provides the objective.
Therefore:
Liquidity → Displacement → Imbalance → Retracement → Liquidity Target
This is more useful than simply scanning the chart for Fair Value Gaps.
Best SIBI and BISI to Trade
Not every imbalance should be traded.
A higher-quality BISI generally has several supporting conditions.
High-Quality BISI
Higher timeframe bias is bullish.
Price has taken sell-side liquidity.
Bullish displacement is obvious.
The BISI forms during the displacement.
The imbalance agrees with the draw on liquidity.
Price is moving toward buy-side liquidity.
The BISI forms at the correct trading time.
The BISI may be located in discount or within a bullish PD Array.
High-Quality SIBI
Higher timeframe bias is bearish.
Price has taken buy-side liquidity.
Bearish displacement is obvious.
The SIBI forms during the displacement.
The imbalance agrees with the draw on liquidity.
Price is moving toward sell-side liquidity.
The SIBI forms at the correct trading time.
The SIBI may be located in premium or within a bearish PD Array.
The official ICT material specifically dedicates lessons to Fair Value Gaps and to trading FVGs correctly, reinforcing that the existence of a gap alone is not the complete execution framework.
Common Mistakes When Trading SIBI and BISI
Confusing BISI and SIBI
Remember:
BISI = Bullish
SIBI = Bearish
Do not reverse their directional meaning.
Marking Every Three-Candle Gap
A visible Fair Value Gap does not automatically create a high-probability setup.
Study the displacement that created it.
Ignoring Liquidity
Ask:
What liquidity was taken before the imbalance formed?
Where is price drawing next?
Without liquidity context, the FVG may simply be a random chart imbalance.
Trading Against Higher Timeframe Delivery
A 1-minute BISI does not automatically override a strong Daily bearish narrative.
Similarly, a small SIBI does not automatically invalidate a major bullish higher timeframe objective.
Chasing Displacement
Do not buy simply because a BISI has formed during a fast bullish candle.
Do not sell simply because a SIBI has formed during a fast bearish candle.
The imbalance may be used as a retracement reference.
Expecting Every Imbalance to Fill Completely
Price can:
Touch the edge.
Trade partially into the FVG.
Reach Consequent Encroachment.
Completely rebalance it.
Trade through and invert the FVG.
The market does not need to provide the exact same reaction from every imbalance.
Final Thoughts
ICT SIBI and BISI are directional Fair Value Gap concepts used to study bullish and bearish price imbalance.
The definitions are simple:
BISI = Buy Side Imbalance Sell Side Inefficiency
SIBI = Sell Side Imbalance Buy Side Inefficiency
A BISI forms during bullish price delivery when aggressive upward displacement leaves an inefficient range.
A SIBI forms during bearish price delivery when aggressive downward displacement leaves an inefficient range.
The easiest trading framework is:
Bullish Model:
Sell-Side Liquidity Taken → Bullish Displacement → BISI Created → Retracement Into BISI → Bullish Reaction → Buy-Side Liquidity
Bearish Model:
Buy-Side Liquidity Taken → Bearish Displacement → SIBI Created → Retracement Into SIBI → Bearish Reaction → Sell-Side Liquidity
The most important point is that SIBI and BISI should not be traded as random gaps.
First understand the higher timeframe bias.
Determine the draw on liquidity.
Wait for the liquidity event.
Study displacement.
Then use the relevant SIBI or BISI as a PD Array for retracement and trade execution.