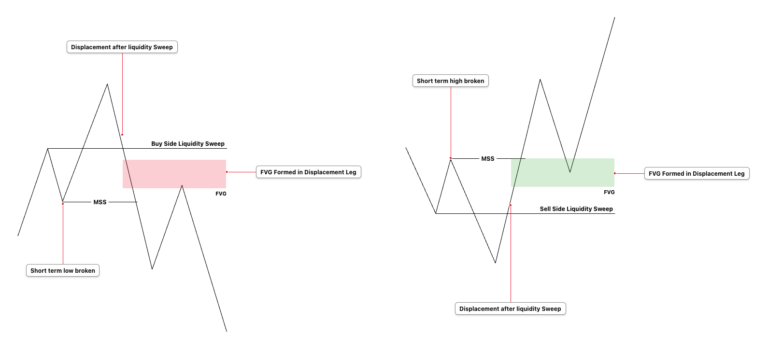
The ICT Breakaway Gap is an advanced fair value gap concept developed by Michael J. Huddleston, the creator of ICT (Inner Circle Trader). It explains why some fair value gaps remain completely or partially open while price continues delivering aggressively toward its next liquidity objective.
Many traders assume that every fair value gap must eventually be filled. This belief often causes them to wait for a deep retracement that never happens.
Price may create a strong displacement, leave a fair value gap behind and continue moving without returning to rebalance it. When the market decisively moves away from an area of consolidation or an important PD array and leaves the gap unmitigated, that imbalance can be classified as an ICT Breakaway Gap.
The breakaway gap is not simply an old FVG that has not yet been filled. Its significance comes from the market narrative surrounding its formation.
A valid breakaway-gap setup normally includes displacement, a clear draw on liquidity, higher-timeframe context, supporting PD arrays, candle-body confirmation and the correct time of day.
What Is an ICT Breakaway Gap?
An ICT Breakaway Gap is a fair value gap formed during an aggressive repricing move that remains completely or partially unmitigated as price continues in the same direction.
In a bullish market, price displaces higher and creates a bullish fair value gap. Instead of retracing deeply into that gap, the market finds support at another PD array positioned above it and continues toward buy-side liquidity.
In a bearish market, price displaces lower and creates a bearish fair value gap. Price finds resistance before reaching the original gap and continues toward sell-side liquidity.
The term “breakaway” describes how price breaks away from:
- A consolidation
- A dealing-range midpoint
- A higher-timeframe PD array
- A significant swing point
- An area of balanced price action
The gap left behind becomes evidence of strong directional delivery.
A breakaway gap can remain completely untouched, or price may trade slightly into it while leaving a meaningful portion open. The important point is that price does not fully rebalance the inefficiency before continuing toward its higher-priority objective.
Understanding the Fair Value Gap Behind the Concept
A fair value gap is a three-candle price imbalance created when aggressive buying or selling prevents the market from offering balanced delivery on both sides.
Bullish fair value gap
A bullish fair value gap forms when the low of the third candle remains above the high of the first candle.
The range between the first candle’s high and the third candle’s low is known as a BISI, or Buy-Side Imbalance Sell-Side Inefficiency.
A bullish FVG represents aggressive buying and insufficient sell-side delivery.
Bearish fair value gap
A bearish fair value gap forms when the high of the third candle remains below the low of the first candle.
The range between the first candle’s low and the third candle’s high is known as a SIBI, or Sell-Side Imbalance Buy-Side Inefficiency.
A bearish FVG represents aggressive selling and insufficient buy-side delivery.
A regular fair value gap is commonly treated as a potential retracement area. Price may return to its boundary, consequent encroachment or opposite side.
A breakaway gap behaves differently because another area of support or resistance prevents price from reaching the deeper imbalance.
How an ICT Breakaway Gap Forms
A high-quality ICT Breakaway Gap normally develops through a sequence of liquidity, consolidation and displacement.
Basic formation process
- Price trades into an important higher-timeframe location.
- A clear liquidity objective exists above or below the market.
- Price consolidates around a PD array, dealing-range midpoint or consequent encroachment level.
- Buy-side or sell-side liquidity may be taken.
- The market produces strong displacement away from the consolidation.
- A fair value gap forms inside the displacement.
- Price retraces toward the gap.
- Another PD array provides support or resistance before the entire gap can be rebalanced.
- Candle bodies confirm that price is being accepted away from the deeper portion of the FVG.
- Price continues toward the next draw on liquidity.
The fair value gap left behind becomes the breakaway gap.
The strongest examples are not random gaps formed in the middle of unclear price action. They usually appear when price leaves an identifiable consolidation positioned around an important higher-timeframe level.
Bullish ICT Breakaway Gap
A bullish ICT Breakaway Gap is a bullish fair value gap that remains open while price continues delivering higher.
A typical bullish model begins after price trades into a discount area or takes sell-side liquidity.
Price may sweep:
- Relative equal lows
- A previous day low
- A previous week low
- An Asian session low
- A London session low
- An old swing low
- Sell-side liquidity below a consolidation
After taking liquidity, price produces bullish displacement.
The displacement should ideally break a meaningful short-term or intermediate-term high. A bullish fair value gap forms inside the expansion.
Price may then retrace toward the BISI but react from:
- A bullish inversion fair value gap
- A bullish breaker block
- A bullish order block
- A balanced price range
- A higher-timeframe bullish FVG
- A discount wick quadrant
- A redelivered-rebalanced price area
If price responds from one of these areas and continues higher, the deeper BISI remains open as a bullish breakaway gap.
The next objective may be:
- Relative equal highs
- A previous day high
- A previous week high
- An old swing high
- A session high
- Buy-side liquidity
- A higher-timeframe inefficiency
The open gap shows that price is more interested in reaching the bullish objective than returning to rebalance the previous inefficiency.
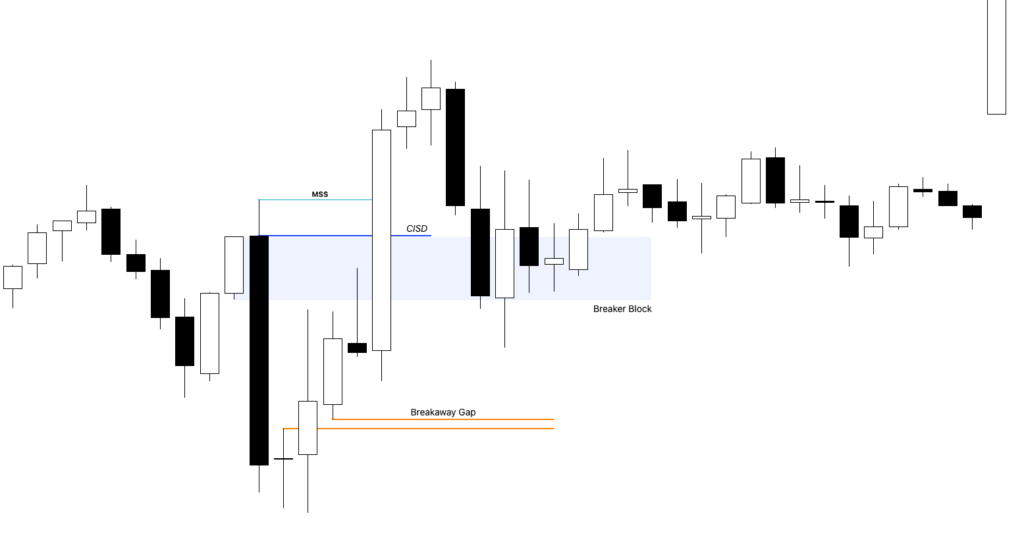 Bullish ICT Breakaway Gap
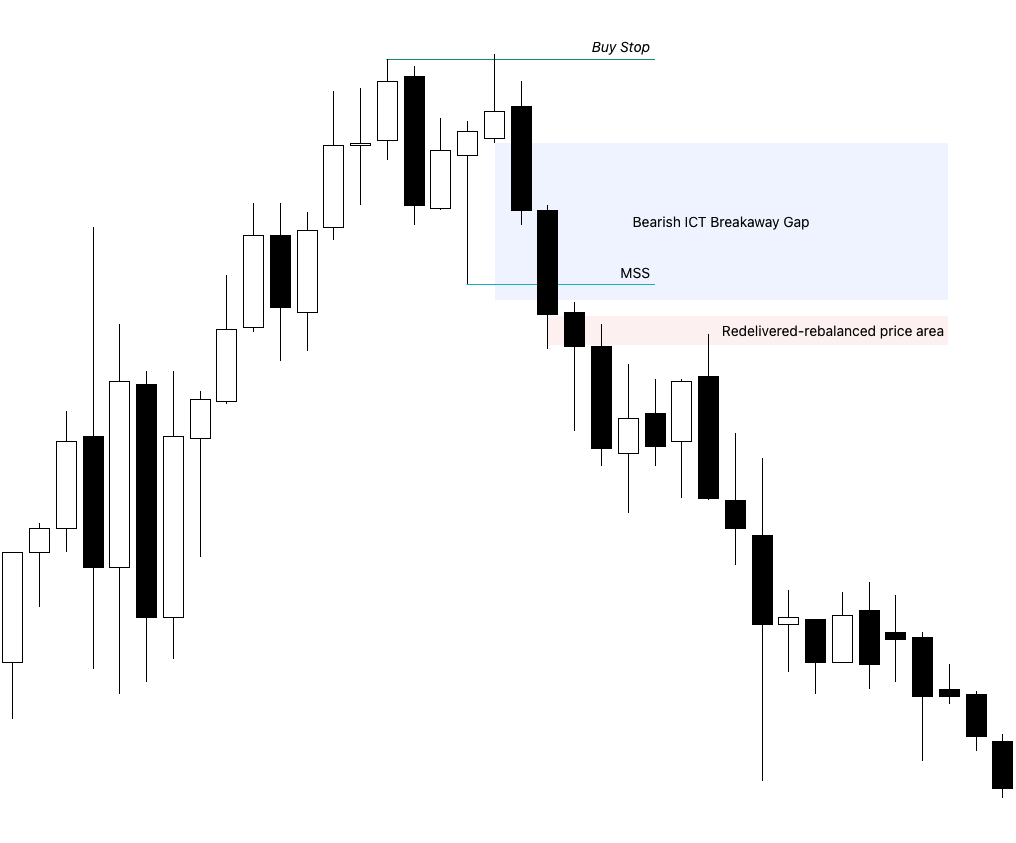
Bearish ICT Breakaway Gap
A bearish ICT Breakaway Gap is a bearish fair value gap that remains open while price continues delivering lower.
The bearish model commonly begins after price reaches a premium location or takes buy-side liquidity.
Price may sweep:
- Relative equal highs
- A previous day high
- A previous week high
- An Asian session high
- A London session high
- An old swing high
- Buy-side liquidity above a consolidation
Bearish displacement follows the liquidity event.
The displacement should ideally break a meaningful low and create a bearish fair value gap.
Price may retrace toward the SIBI but encounter resistance at:
- A bearish inversion fair value gap
- A bearish breaker block
- A bearish order block
- A balanced price range
- A higher-timeframe bearish FVG
- A premium wick quadrant
- A redelivered-rebalanced price area
If the resistance holds, price continues lower without fully trading into the original SIBI.
The open SIBI becomes a bearish breakaway gap.
The next draw may be:
- Relative equal lows
- A previous day low
- A previous week low
- An old swing low
- A session low
- Sell-side liquidity
- A higher-timeframe inefficiency
Why Some Fair Value Gaps Remain Open
A fair value gap remains open when the market has no immediate reason to return to it.
The gap itself is not necessarily preventing the retracement. In many cases, another PD array positioned before the FVG provides enough support or resistance to continue the movement.
Higher-timeframe PD array
Higher-timeframe PD arrays generally carry more significance than lower-timeframe imbalances.
Suppose a bullish FVG forms on the five-minute chart. A one-hour or four-hour bullish PD array is positioned above that five-minute gap.
Price retraces into the higher-timeframe array, forms supportive candle-body closes and continues higher.
The lower-timeframe FVG remains open because the higher-timeframe array has already provided sufficient support.
The opposite applies in bearish conditions.
A lower-timeframe bearish FVG may remain open because price reacts from a higher-timeframe premium PD array before reaching it.
This is why every FVG must be studied within the larger dealing range.
Consolidation around consequent encroachment
Breakaway gaps frequently form when price leaves a consolidation positioned around the consequent encroachment of a higher-timeframe PD array.
Consequent encroachment is the midpoint of an imbalance or price range.
When price consolidates around that midpoint, the market may be balancing orders before the next directional expansion.
Once the correct time arrives, price displaces away from the consolidation and leaves a fair value gap inside the movement.
That gap has a stronger probability of remaining open because it marks the transition from balance into directional delivery.
Inversion fair value gap
An Inversion Fair Value Gap, or IFVG, is a failed fair value gap that begins functioning in the opposite direction.
For example, price may displace above a bearish fair value gap. Once the bearish FVG is traded through, it can become bullish support.
If a bullish fair value gap is positioned immediately below the new bullish IFVG, price may not need to retrace deeply into the lower BISI.
The inversion fair value gap supports price first.
If candle bodies respect the IFVG or the consequent encroachment of the BISI, part or all of the bullish gap may remain open as a breakaway gap.
The bearish model works in reverse.
Price trades below a bullish FVG, converting it into bearish resistance. A bearish FVG positioned above the inversion level may remain open while price continues lower.
Breaker block
A breaker block can protect a fair value gap from being filled.
In a bullish model, price may break above a failed bearish order block. The area becomes a bullish breaker.
When price retraces, the breaker provides support above the original bullish FVG.
If the breaker holds, price continues higher and leaves the deeper imbalance open.
In a bearish model, a bearish breaker provides resistance below the original bearish FVG.
The breaker block is not the breakaway gap. It is the supporting PD array that prevents price from reaching the gap.
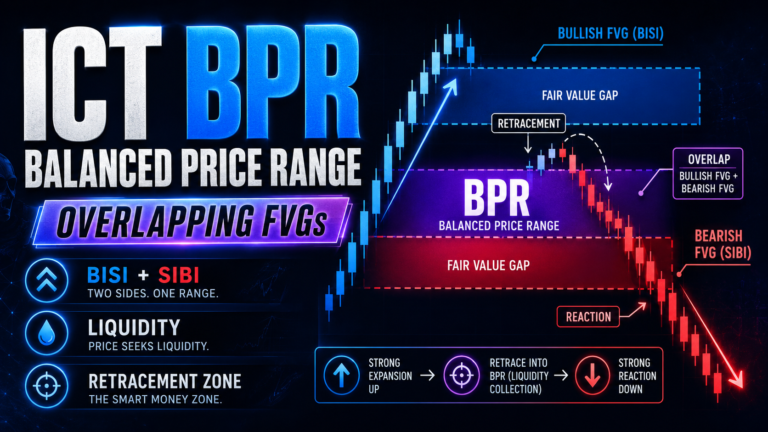
Balanced Price Range
A Balanced Price Range, or BPR, forms where opposing fair value gaps overlap.
The overlapping delivery represents an area where price has already offered both buy-side and sell-side movement.
When price returns to the BPR, it may find enough support or resistance to continue without reaching a deeper FVG.
The deeper imbalance may then remain open as a breakaway gap.
Redelivered-rebalanced price area
A redelivered-rebalanced area is a section of price in which delivery has already occurred in both directions.
In a bullish model, price may deliver upward, downward and upward again through approximately the same range.
That area has been relatively balanced.
When price returns to it, the market may find support without needing to trade into the deeper bullish fair value gap.
In a bearish model, price may deliver downward, upward and downward again.
The balanced area can provide resistance and leave the bearish FVG above it unmitigated.
This is not a mechanical signal. The trader should still look for liquidity, higher-timeframe alignment, candle closure and lower-timeframe confirmation.
SMT between correlated markets
SMT divergence can help explain why one market’s FVG remains open.
Suppose Nasdaq, the S&P 500 and Dow futures are delivering higher.
During a retracement, Dow trades into its bullish fair value gap, while Nasdaq refuses to trade into its corresponding FVG.
Dow has completed the rebalancing for the correlated group, while Nasdaq shows relative strength.
Nasdaq’s fair value gap may remain open as a bullish breakaway gap.
In a bearish example, one index may trade into its SIBI while another market fails to reach the corresponding imbalance. The weaker market may leave its gap open and continue lower.
SMT should support an existing narrative. It should not replace higher-timeframe analysis, liquidity or displacement.
Candle Bodies, Wicks and Consequent Encroachment
One of the most important details in the ICT Breakaway Gap concept is the difference between candle wicks and candle bodies.
Wicks can temporarily penetrate a level without confirming acceptance beyond it.
The candle body shows where price actually opened and closed. It provides stronger evidence of whether the market is accepting or rejecting a PD array.
Bullish candle-body confirmation
Price may wick into a bullish FVG or briefly trade below its consequent encroachment.
The setup can remain valid if the candle body closes at or above:
- The high of the bullish FVG
- Consequent encroachment
- A bullish inversion fair value gap
- A supporting order block
- A bullish breaker
- A discount wick quadrant
A wick below the level may perform the liquidity work, while the body close confirms bullish acceptance.
Bearish candle-body confirmation
Price may wick into a bearish FVG or briefly trade above its midpoint.
The setup can remain valid if the candle body closes at or below:
- The low of the bearish FVG
- Consequent encroachment
- A bearish inversion fair value gap
- A bearish order block
- A bearish breaker
- A premium wick quadrant
The body close shows that price is still being accepted below resistance.
Complete and partial breakaway gaps
A breakaway gap does not always need to remain completely untouched.
Price may:
- Touch the FVG boundary
- Trade slightly inside it
- Reach consequent encroachment
- Wick through CE and close back outside
- Leave only the upper or lower portion open
If price fails to fully rebalance the FVG and continues aggressively toward the expected objective, the remaining open portion can still represent breakaway delivery.
However, repeated candle-body closes through the entire gap weaken the concept.
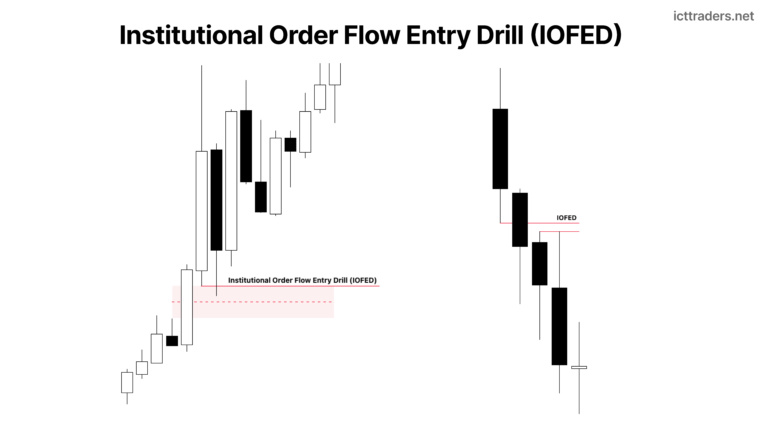
Institutional Order Flow Entry Drill
A shallow retracement into a fair value gap is sometimes described as an Institutional Order Flow Entry Drill.
Instead of trading to consequent encroachment, price may only touch the boundary of the FVG or enter a small distance into it.
This shallow retracement reflects strong directional order flow.
Bullish example
Price creates a bullish fair value gap.
The retracement touches the high of the FVG or trades slightly inside it.
Price fails to reach consequent encroachment.
Candle bodies hold above the protected level.
The market then expands toward buy-side liquidity.
Bearish example
Price creates a bearish fair value gap.
The retracement touches the low of the gap or trades slightly inside it.
Price fails to reach consequent encroachment.
Candle bodies remain below the protected level.
Price then expands toward sell-side liquidity.
The unmitigated portion of the FVG may become the breakaway gap.
This explains why waiting for a perfect midpoint retracement can cause a trader to miss a strong continuation move.
How Wicks Can Help Create a Breakaway Gap
A large wick can be divided into gradient levels or quadrants.
These internal levels may include:
- Wick high
- Upper quadrant
- Consequent encroachment
- Lower quadrant
- Wick low
Wick gradients can become highly sensitive when they overlap with another PD array.
For example, a wick quadrant may align with:
- A fair value gap
- An inversion fair value gap
- An order block
- A breaker block
- A balanced price range
- Consequent encroachment
When several levels overlap, the area can provide enough support or resistance to prevent price from reaching a deeper fair value gap.
Premium wick
A premium wick can be used as a resistance framework.
If a bearish FVG, order block or IFVG aligns with the upper quadrant or midpoint of a premium wick, price may react there and continue lower.
The bearish fair value gap above the reaction point may remain open.
Discount wick
A discount wick can be used as a support framework.
If a bullish FVG, order block or IFVG aligns with the lower quadrant or midpoint of a discount wick, price may react there and continue higher.
The bullish fair value gap below the reaction point may remain open.
Selecting between nearby wicks
When two nearby wicks are potential reference points, the wick with the greater range or more extreme reach may provide the more useful gradient.
In premium conditions, the higher-reaching wick may offer the more relevant resistance range.
In discount conditions, the lower-reaching wick may offer the more relevant support range.
Wick gradients should not be used alone. Their value increases when they overlap with established PD arrays and appear at the correct time.
The Importance of Time
Price location does not provide the entire setup.
Time helps determine when price is likely to leave consolidation and begin directional delivery.
A breakaway gap becomes more meaningful when it forms during:
- London Open Kill Zone
- New York Open Kill Zone
- An ICT Macro
- A major session transition
- A scheduled economic release
- A higher-timeframe candle opening
- A meaningful day-of-week profile
- A period when the market commonly seeks liquidity
Price may remain inside consolidation for a long period before the correct time arrives.
When time and price align, the market may begin moving aggressively in one direction. The FVG created during that expansion can remain open because the market has entered a directional delivery phase.
The complete narrative is not simply an FVG.
It is:
Liquidity, location, PD array, displacement, candle closure and time.
How to Identify an ICT Breakaway Gap in Real Time
A gap can only be confirmed as a breakaway gap after price has continued without fully rebalancing it.
However, traders can identify a potential breakaway gap before the entire move develops.
Determine the higher-timeframe draw
Begin with the daily, four-hour or one-hour chart.
Ask where price is most likely being drawn.
Possible objectives include:
- Buy-side liquidity
- Sell-side liquidity
- Previous day high or low
- Previous week high or low
- Old swing highs or lows
- Relative equal highs or lows
- Higher-timeframe fair value gaps
- Order blocks
- Liquidity voids
- Opening gaps
A bullish breakaway gap is more likely when the higher-timeframe draw remains above current price.
A bearish breakaway gap is more likely when the higher-timeframe draw remains below current price.
Identify the higher-timeframe PD array
Determine where the movement is beginning.
Price may be reacting from:
- A premium or discount FVG
- An order block
- A breaker block
- A mitigation block
- A balanced price range
- An inversion fair value gap
- A wick quadrant
- Consequent encroachment
This location provides the foundation for the directional narrative.
Look for consolidation
Study whether price is consolidating around the higher-timeframe array.
A breakaway gap frequently forms as price leaves this balance.
The consolidation may show:
- Narrow candles
- Repeated tests of CE
- Accumulation around an IFVG
- Candle bodies holding at a PD array
- Relative equal highs or lows
- Compression before a kill zone or macro
Wait for displacement
The movement away from the consolidation should be decisive.
Strong displacement commonly includes:
- Large candle bodies
- Little overlap between candles
- A break of a meaningful swing point
- One or more fair value gaps
- Acceleration toward liquidity
A small imbalance inside choppy price action is less likely to become a meaningful breakaway gap.
Mark the FVG created during displacement
Mark the fair value gap created as price leaves the consolidation.
This is the initial breakaway-gap candidate.
Do not assume immediately that it will stay open.
Identify the protective PD array
Look between current price and the candidate FVG.
Ask whether another PD array can stop the retracement before the entire gap is filled.
Possible protective arrays include:
- IFVG
- Breaker block
- Order block
- Balanced price range
- Wick quadrant
- Higher-timeframe FVG
- Redelivered-rebalanced area
Study candle-body closes
When price retraces, watch where the candle bodies close.
A supportive body close at the FVG boundary, CE or protective PD array strengthens the expectation that the deeper portion of the gap may remain open.
Check correlated markets
When relevant, compare correlated instruments.
One market may complete the rebalancing while another leaves its FVG open.
This SMT relationship can provide confirmation that the market showing relative strength or weakness may continue without returning to the original gap.
How to Draw an ICT Breakaway Gap
The gap is drawn in the same way as a normal fair value gap.
Bullish breakaway gap
Identify the three-candle bullish imbalance.
Mark the range from the high of the first candle to the low of the third candle.
Extend the range forward.
Monitor whether price:
- Remains completely above the gap
- Touches only the upper boundary
- Trades slightly inside it
- Respects consequent encroachment
- Leaves the lower portion open
The remaining unmitigated area represents the bullish breakaway gap.
Bearish breakaway gap
Identify the three-candle bearish imbalance.
Mark the range from the low of the first candle to the high of the third candle.
Extend the range forward.
Monitor whether price:
- Remains completely below the gap
- Touches only the lower boundary
- Trades slightly inside it
- Respects consequent encroachment
- Leaves the upper portion open
The remaining unmitigated area represents the bearish breakaway gap.
Do not redraw the original boundaries simply to make the setup appear cleaner. Keep the full FVG marked and separately note the portion that has been mitigated.
How to Trade the ICT Breakaway Gap
The ICT Breakaway Gap is mainly a continuation concept.
The common mistake is waiting to enter from the original FVG. If it becomes a genuine breakaway gap, price may never return to that level.
The better approach is to identify the PD array protecting the gap and use it to refine the entry.
Bullish trade model
Establish a bullish higher-timeframe bias.
Identify the next buy-side objective.
Wait for price to trade into discount or take sell-side liquidity.
Look for bullish displacement that breaks a meaningful high.
Mark the bullish FVG created during the displacement.
Identify the bullish IFVG, breaker, order block, BPR, wick quadrant or higher-timeframe array positioned above the gap.
Wait for price to retrace into that protective area.
Study the candle-body closes.
Move to a lower timeframe and wait for:
- Bullish displacement
- A market structure shift
- A lower-timeframe BISI
- A bullish IFVG
- A small liquidity sweep
Enter from the lower-timeframe continuation array.
Place the stop below the structure that invalidates the setup.
Target the next buy-side liquidity or higher-timeframe inefficiency.
Bearish trade model
Establish a bearish higher-timeframe bias.
Identify the next sell-side objective.
Wait for price to trade into premium or take buy-side liquidity.
Look for bearish displacement that breaks a meaningful low.
Mark the bearish FVG created during the displacement.
Identify the bearish IFVG, breaker, order block, BPR, wick quadrant or higher-timeframe array positioned below the gap.
Wait for price to retrace into that resistance.
Study the candle-body closes.
Move to a lower timeframe and wait for:
- Bearish displacement
- A market structure shift
- A lower-timeframe SIBI
- A bearish IFVG
- A small liquidity sweep
Enter from the lower-timeframe continuation array.
Place the stop above the structure that invalidates the setup.
Target the next sell-side liquidity or higher-timeframe inefficiency.
Stop-Loss Placement
The stop loss should be positioned beyond the structure that proves the continuation idea is wrong.
For a bullish trade, the stop may be placed below:
- The bullish breaker
- The bullish IFVG
- The order block
- The balanced price range
- The wick quadrant
- The liquidity sweep low
- The low responsible for bullish displacement
For a bearish trade, the stop may be placed above:
- The bearish breaker
- The bearish IFVG
- The order block
- The balanced price range
- The wick quadrant
- The liquidity sweep high
- The high responsible for bearish displacement
Avoid placing the stop directly on an obvious boundary without considering normal market fluctuation.
The invalidation point should be based on market structure, not an arbitrary number of points or pips.
Profit Targets
A breakaway gap indicates that price is prioritising another liquidity objective.
The target should be selected from the next logical draw on price.
Bullish targets
- Relative equal highs
- Previous day high
- Previous week high
- Session high
- Old swing high
- Buy-side liquidity
- Higher-timeframe bearish PD array
- Unfilled inefficiency above price
Bearish targets
- Relative equal lows
- Previous day low
- Previous week low
- Session low
- Old swing low
- Sell-side liquidity
- Higher-timeframe bullish PD array
- Unfilled inefficiency below price
A lower-timeframe liquidity pool may only be an intermediate target.
For example, price may take relative equal highs and continue higher if a more important higher-timeframe PD array remains untraded.
Do not automatically expect a reversal simply because a nearby liquidity pool has been taken.
ICT Breakaway Gap vs Other Gap Concepts
Breakaway Gap vs regular FVG
A regular FVG is monitored as a possible retracement area.
A breakaway gap is an FVG that price leaves completely or partially open during continued directional delivery.
With a regular FVG trade, the trader may wait for price to return to the gap.
With a breakaway-gap trade, waiting for the original imbalance may cause the trader to miss the movement. The entry may form at a closer protective PD array.
Breakaway Gap vs Inversion Fair Value Gap
A breakaway gap remains unmitigated.
An inversion fair value gap has been traded through and begins functioning in the opposite direction.
An IFVG can help create a breakaway gap by supporting or resisting price before it reaches another FVG.
The IFVG is the protective array. The deeper untouched FVG becomes the breakaway gap.
Breakaway Gap vs liquidity void
A fair value gap is a specific three-candle imbalance.
A liquidity void is a broader area of one-sided price delivery that may contain several individual fair value gaps.
One FVG inside the liquidity void may remain open as a breakaway gap, while other parts of the void are rebalanced.
Breakaway Gap vs NDOG and NWOG
A New Day Opening Gap, or NDOG, forms between the previous trading day’s closing price and the new trading day’s opening price.
A New Week Opening Gap, or NWOG, forms between Friday’s closing price and the new trading week’s opening price.
An ICT Breakaway Gap is different.
It is a fair value gap created by displacement and left unmitigated during directional price delivery.
NDOG and NWOG are opening-price gaps. A breakaway gap is an unmitigated three-candle imbalance.
Common Mistakes
Calling every open FVG a breakaway gap
An FVG may remain open temporarily and still be filled later.
A potential breakaway gap should have supporting context, including displacement, liquidity, higher-timeframe direction and a reason price may not return.
Believing every FVG must fill
Fair value gaps often attract price, but they are not required to fill immediately.
Some remain open for days, weeks or longer.
Ignoring consolidation
The location from which price breaks away matters.
An FVG created while leaving consolidation around a meaningful PD array is generally more significant than a random imbalance created in the middle of choppy price action.
Ignoring candle-body closes
A wick through a level does not always invalidate the setup.
The closing location of the candle body provides stronger information about acceptance and rejection.
Waiting only for consequent encroachment
Strong institutional order flow may produce only a shallow retracement.
Price may touch the FVG boundary and continue without reaching its midpoint.
Ignoring the protective PD array
The original FVG may not be the entry level.
The trade may form at an IFVG, breaker, BPR, order block or wick quadrant positioned before it.
Ignoring time
A valid price level may do nothing outside the appropriate session or macro.
Time helps determine when the market is likely to begin directional delivery.
Treating SMT as a standalone entry
SMT is supporting evidence.
It should not replace liquidity analysis, higher-timeframe direction, displacement or a valid entry model.
Chasing displacement
Recognising a potential breakaway gap does not mean buying or selling after several large candles.
Wait for a retracement into a logical continuation array. If the market does not offer a controlled entry, let the trade go.
ICT Breakaway Gap Checklist
Before classifying an FVG as a potential breakaway gap, confirm the following:
- Is the higher-timeframe direction clear?
- Is there a clear draw on liquidity?
- Has price reached a premium or discount PD array?
- Has meaningful liquidity been taken?
- Is price leaving a visible consolidation?
- Is the consolidation located around CE or a higher-timeframe PD array?
- Did strong displacement form?
- Did the displacement break a meaningful swing point?
- Did a clean FVG form inside the displacement?
- Is another PD array positioned before the original gap?
- Is an inversion fair value gap supporting the move?
- Is a breaker, order block or BPR adding confluence?
- Does a wick quadrant overlap with the reaction area?
- Are candle bodies respecting the boundary or CE?
- Are only the wicks penetrating the level?
- Did the retracement fail to reach consequent encroachment?
- Is price showing an Institutional Order Flow Entry Drill?
- Does SMT support continuation?
- Is the move occurring during an important time window?
- Does a higher-timeframe objective remain untraded?
- Can the stop be placed beyond logical invalidation?
- Is sufficient reward available before the final target?
The breakaway-gap narrative becomes stronger when several of these conditions appear together.
Can a Breakaway Gap Fill Later?
Yes.
A breakaway gap is not guaranteed to remain open forever.
The term describes its behaviour during the current phase of price delivery.
Price may return later after:
- The liquidity objective has been reached
- Higher-timeframe structure has changed
- The directional move has completed
- A new dealing range has formed
- The market begins rebalancing older inefficiencies
A breakaway gap should not be treated as permanent support or resistance.
Its importance depends on the current market narrative.
Final Thoughts
The ICT Breakaway Gap explains why price sometimes refuses to return to an apparently obvious fair value gap.
The market does not need to rebalance every imbalance immediately.
When price leaves consolidation, respects a higher-timeframe PD array and begins moving toward a higher-priority liquidity objective, the FVG created during that expansion may remain open.
The strongest breakaway-gap setups combine:
- Higher-timeframe direction
- A clear draw on liquidity
- Premium or discount location
- Consolidation around a PD array
- Displacement
- A structural break
- A protective IFVG, breaker, order block or BPR
- Candle-body confirmation
- Consequent encroachment
- Wick gradients
- SMT
- Time of day
The most important lesson is that every fair value gap is not automatically an entry level.
Sometimes the open gap is evidence that the market has already repriced and is committed to reaching its next objective. Instead of waiting for price to return to the original FVG, the trader should study the closer PD array that is protecting it and look for a continuation entry in alignment with the broader ICT narrative.