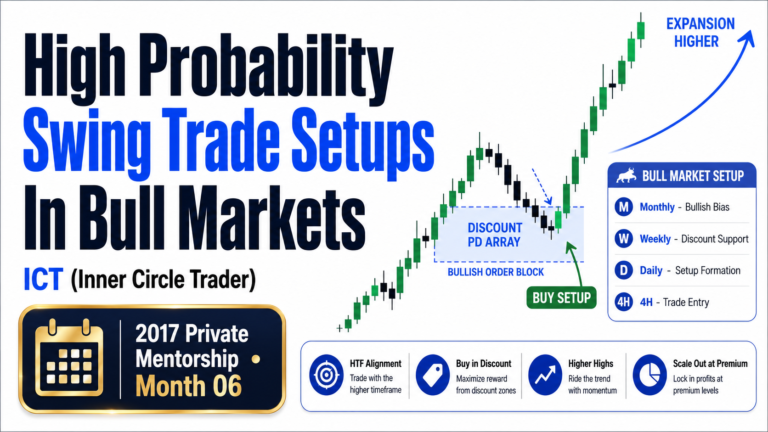
High Probability Swing Trade Setups In Bear Markets are built around one central idea: sell from premium when the higher timeframes support lower prices.
This approach was taught by Michael J. Huddleston, founder of ICT (Inner Circle Trader), in the 2017 ICT Private Mentorship Core Content Month 06. The method combines monthly, weekly, daily, and four-hour analysis to locate bearish premium arrays, refine entries, and target discount arrays below the market.
The purpose is not to sell every rally. A trader should first confirm that the higher-timeframe structure, institutional order flow, and PD Arrays all support bearish price delivery.
As Michael J. Huddleston explains:
“You’re just looking for the monthly, the weekly, the daily, four hour, all those levels that go in concert with one another to overlap, to converge.”
The more bearish levels that overlap near the same price, the more likely that area may produce a meaningful reaction.
Understanding the Bearish PD Array Sequence
In a bearish market, traders focus primarily on the premium side of the PD Array Matrix.
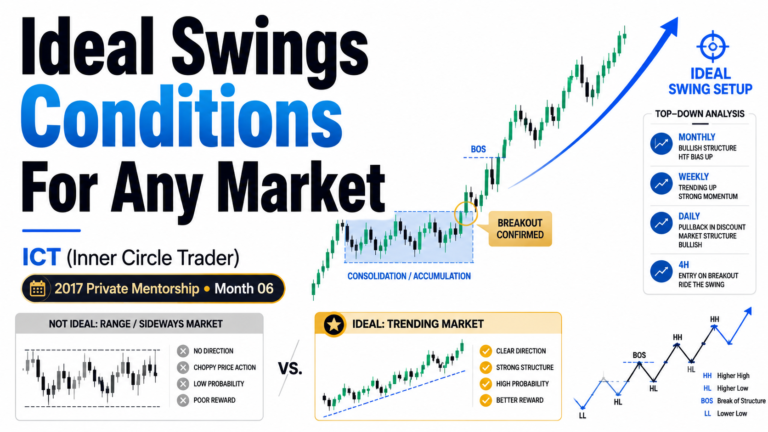
The ideal condition is a bearish monthly, weekly, and daily sequence.
This means:
- Monthly premium arrays are producing lower prices
- Weekly premium arrays are acting as resistance
- Daily premium arrays are supporting bearish continuation
- Up-close candles are repeatedly becoming resistance
- Price shows little sustained strength above institutional levels
When all three higher timeframes are bearish, the trader can focus on selling daily and four-hour bearish premium arrays.
The monthly and weekly charts establish the larger bearish framework. The daily chart helps identify active premium zones, while the four-hour chart provides more precise entry opportunities.
The Monthly, Weekly and Daily Bearish Sequence
The condition of each timeframe determines which bearish setups should be considered.
Monthly Bearish, Weekly Bearish, Daily Bearish
This is the clearest bearish alignment.
When all three timeframes support lower prices, traders can look to sell:
- Daily bearish order blocks
- Daily bearish breakers
- Daily mitigation blocks
- Daily fair value gaps
- Daily liquidity voids
- Daily rejection blocks
- Old highs acting as premium arrays
- Four-hour bearish premium arrays
In this environment, rallies are generally viewed as opportunities to sell rather than signs of a lasting reversal.
Monthly Bearish, Weekly Bearish, Daily Bullish
This usually indicates that the daily chart is correcting higher inside a broader bearish trend.
The bullish daily movement may be delivering price into a weekly premium array before the larger bearish trend resumes.
In this condition, traders can look to:
- Sell daily bearish premium arrays nested inside weekly premium arrays
- Sell four-hour bearish arrays inside daily or weekly resistance
- Wait for the daily correction to reach a logical premium level
However, traders should avoid selling immediately after the daily chart has created a lower low and strongly rejected it. That reaction may form a bullish breaker and produce a deeper correction before the bearish trend resumes.
Monthly Bearish, Weekly Bullish, Daily Bullish
In this situation, both the weekly and daily charts may be correcting higher within the larger monthly bearish framework.
The trader should generally focus on:
- Daily bearish premium arrays inside monthly premium zones
- Four-hour bearish setups inside weekly or monthly resistance
- Monthly bearish order blocks and mean thresholds
- Areas where weekly and monthly arrays overlap
A bearish position should not be forced simply because the monthly chart is bearish. Price may need to complete the weekly correction before a high-probability selling opportunity appears.
Important Bearish Premium Arrays
A high-probability bearish swing setup should originate from a logical premium array.
Bearish Order Block
A bearish order block is usually the final up-close candle, or group of up-close candles, before a significant bearish displacement.
When price returns to that candle range, it may act as resistance and offer a selling opportunity.
The most important reference points may include:
- The open of the bullish candle
- The low of the bullish candle
- The candle body
- The mean threshold of the order block
- The full range of several consecutive bullish candles
Larger-bodied candles often provide more useful reference points than very small candles hidden inside a larger candle range.
Bearish Breaker
A bearish breaker may form when price trades through a previously significant level and later returns to it from below.
In a bearish environment, a failed bullish structure can become resistance when price retraces back into it.
Breakers become more important when they overlap with:
- Monthly resistance
- Weekly order blocks
- Old highs
- Premium portions of a larger dealing range
Bearish Mitigation Block
A bearish mitigation block forms when institutions use a retracement to offset or mitigate earlier positions before continuing lower.
Price may retrace into a down-close candle or another institutional reference point before expanding lower.
Mitigation blocks can provide refined four-hour entries when they appear inside a larger monthly or weekly premium zone.
Fair Value Gap
A bearish fair value gap is an imbalance created during strong downward displacement.
When price retraces into the gap, the imbalance may act as resistance.
A fair value gap becomes more significant when it is:
- Located above equilibrium
- Inside a monthly or weekly bearish order block
- Near an old high
- Aligned with a bearish market structure
- Followed by a clear discount objective below
Rejection Block
A bearish rejection block may form above candle bodies where price briefly trades higher but is strongly rejected.
These areas can become premium resistance when price returns to them.
The rejection should be supported by broader bearish order flow rather than treated as a standalone signal.
Old Highs and Old Lows
An old high is a premium PD Array because buy-side liquidity may be resting above it.
Price may trade above the old high, collect liquidity, and then reverse lower.
An old low can also become relevant after price trades below it and later returns from underneath. In that case, the old low may operate as resistance.
Focus on Premium, Target Discount
Bearish swing trading requires a clear understanding of the dealing range.
The trader should identify a meaningful high and low, then determine whether price is trading above or below equilibrium.
When price is above equilibrium, it is in the premium half of the range. This is where bearish setups are preferred.
When price moves lower, it typically seeks a discount PD Array.
Possible bearish objectives include:
- Old lows
- Equal lows
- Sell-side liquidity
- Bullish order blocks below price
- Liquidity voids below price
- Fair value gaps below price
- Rejection blocks beneath candle bodies
- Monthly or weekly discount arrays
The entry should come from premium, while the target should be located in discount.
Use Monthly and Weekly Levels as the Main Framework
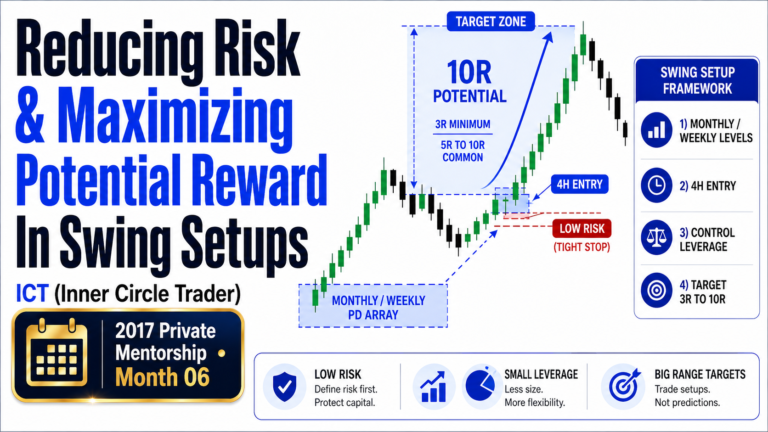
Monthly and weekly PD Arrays are the strongest components of the model because larger positions are commonly built around higher-timeframe levels.
Michael J. Huddleston explains:
“You want to focus primarily on the monthly and weekly levels because they’re going to be the biggest catalysts for big moves.”
These levels may be revisited several times before price finally expands lower.
A trader should not assume that a monthly or weekly order block must produce an exact reaction on the first touch. Higher-timeframe zones can be wide, and price may trade through the open, low, or mean threshold before reversing.
Several retracements into the same level do not automatically invalidate it.
This is because larger institutional positions may require multiple passes into the same area before the bearish move develops fully.
Refine Entries on the Four-Hour Chart
After identifying monthly, weekly, and daily resistance, the trader can transfer those levels to the four-hour chart.
The four-hour timeframe is used to locate more precise bearish setups such as:
- Four-hour bearish order blocks
- Four-hour mitigation blocks
- Four-hour breakers
- Four-hour fair value gaps
- False breaks above old highs
- Short-term buy-side liquidity raids
- Bearish displacement from higher-timeframe resistance
This refinement can reduce the required stop distance and place the trader closer to the point where price may begin expanding lower.
The higher-timeframe level creates the reason for the trade. The four-hour setup creates the entry.
A four-hour bearish order block in the middle of nowhere is less meaningful than one located inside a weekly or monthly premium array.
Look for Confluence Between Bearish Levels
The strongest bearish setups often occur where multiple PD Arrays converge.
For example, one price area may contain:
- A monthly bearish order block
- A weekly bearish order block
- A weekly mean threshold
- A daily fair value gap
- A four-hour mitigation block
- An old high containing buy-side liquidity
This layered resistance can increase the probability of a bearish reaction.
Huddleston states:
“The more levels that converge around a specific price level, the more likely it’s going to probably be sensitive.”
Confluence does not guarantee that every trade will work. However, it provides a stronger reason to anticipate resistance than relying on a single isolated candle.
Up-Close Candles Should Act as Resistance
One of the clearest signs of bearish institutional order flow is the repeated use of up-close candles as resistance.
When price retraces higher during a bearish trend, previous bullish candles should limit the rally and help produce lower prices.
Traders should observe whether:
- Price enters an up-close candle and rejects
- The candle open acts as resistance
- The mean threshold causes a reaction
- Price expands lower after touching the candle
- New lower lows follow the rejection
As Huddleston explains:
“All green candles are basically resistance levels.”
This statement applies within a valid bearish context. It does not mean every bullish candle on every chart should be sold.
The higher-timeframe bearish framework must already be present.
Use Old Highs for Liquidity-Based Entries
Old highs can produce strong bearish setups because they often contain buy stops.
Price may trade above an old high, trigger the resting liquidity, and then reverse lower.
This creates a classic false breakout or liquidity raid.
A high-probability version of this setup may include:
- Monthly or weekly bearish bias
- Price trading in premium
- An old high above current price
- A brief move through the old high
- Bearish displacement back below it
- A four-hour bearish order block or breaker
- A clear sell-side liquidity target below
The old high provides the liquidity, while the nearby premium array provides the institutional resistance.
Identify Logical Profit Objectives
A bearish swing trade should not be held without a defined target.
Possible objectives include:
- Previous daily lows
- Weekly lows
- Equal lows
- Sell-side liquidity pools
- Monthly discount arrays
- Weekly bullish order blocks
- Fair value gaps below price
- The next major imbalance
Some setups may last several days, while others can remain open for several weeks.
A trade does not need to last a particular number of days to be profitable. However, true swing trades generally seek a meaningful higher-timeframe move rather than a small intraday reaction.
Partial profits may be taken at the first logical discount array, while a remaining portion can be held for a deeper objective.
Accept That Some Setups Will Fail
Not every bearish order block, mitigation block, or fair value gap will produce a winning trade.
Even in a strongly bearish market, some entries may be stopped out before price eventually moves lower.
The important question is whether the original bearish framework remains valid.
A losing entry does not always mean the entire analysis was wrong. Price may simply be reaching for a deeper premium array before beginning the larger decline.
However, traders should not repeatedly enter without a clear rule-based process.
A second entry should only be considered when:
- Monthly and weekly bearish order flow remains intact
- Price is still in premium
- A stronger higher-timeframe level has been reached
- A new valid four-hour setup forms
- Risk limits permit another position
The goal is not to avoid every loss. The goal is to keep losses controlled while remaining prepared for the larger bearish move.
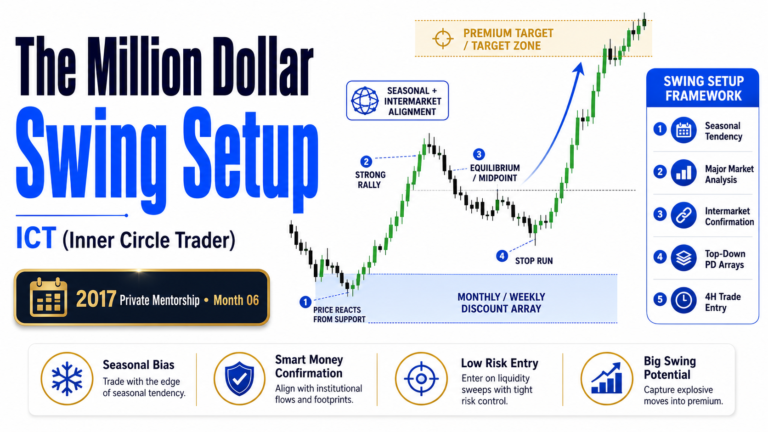
High Probability Bear Market Swing Setup Model
A practical bearish swing-trading process can be organised as follows.
Step 1: Establish the Higher-Timeframe Bias
Study the monthly, weekly, and daily charts.
Confirm that premium arrays are producing resistance and that price is generally delivering lower.
Step 2: Mark Monthly and Weekly Premium Arrays
Identify:
- Bearish order blocks
- Mean thresholds
- Old highs
- Breakers
- Mitigation blocks
- Fair value gaps
- Rejection blocks
These become the primary areas where selling may occur.
Step 3: Determine Whether Price Is in Premium
Use a clear dealing range and locate equilibrium.
Prefer bearish setups above equilibrium.
Step 4: Transfer the Levels to the Daily Chart
Observe how price responds to the monthly and weekly levels.
Add relevant daily bearish PD Arrays.
Step 5: Refine the Entry on the Four-Hour Chart
Wait for a bearish four-hour setup inside the higher-timeframe resistance.
This may include a bearish order block, breaker, mitigation block, or fair value gap.
Step 6: Confirm Bearish Displacement
Price should show an ability to move away from the premium array with strength.
Weak reactions may indicate that price is reaching for a higher premium level.
Step 7: Select a Discount Objective
Target old lows, equal lows, sell-side liquidity, or another discount PD Array below price.
Step 8: Define Risk Before Entry
The stop should be positioned where the bearish idea is invalidated, not at an arbitrary distance.
The potential reward should justify the risk.
Bear Market Swing Trade Checklist
Before selling a bearish swing setup, confirm:
- The monthly chart supports lower prices
- The weekly chart is bearish or correcting into monthly resistance
- The daily chart is bearish or retracing into premium
- Price is above equilibrium
- A monthly or weekly premium array is present
- A daily bearish PD Array supports the idea
- A four-hour bearish setup provides the entry
- Up-close candles are acting as resistance
- Buy-side liquidity has been taken or remains nearby
- Bearish displacement confirms selling pressure
- A logical discount objective exists below price
- The reward-to-risk ratio is acceptable
- Total account risk remains within the trading plan
Final Thoughts
High Probability Swing Trade Setups In Bear Markets are created through top-down analysis, not by blindly selling every bullish candle.
The trader begins with monthly and weekly bearish order flow, identifies premium PD Arrays, studies how the daily chart interacts with those levels, and then refines the entry on the four-hour chart.
The highest-quality setups usually appear where multiple bearish arrays overlap. Monthly and weekly order blocks, daily resistance, four-hour entry models, and old highs can combine to create a logical area for institutional selling.
The key is patience. Traders should wait for price to return to premium, confirm that higher-timeframe resistance remains valid, and target discount arrays below the market.
When the monthly, weekly, daily, and four-hour charts work together, bearish swing trades become easier to frame, manage, and execute with discipline.