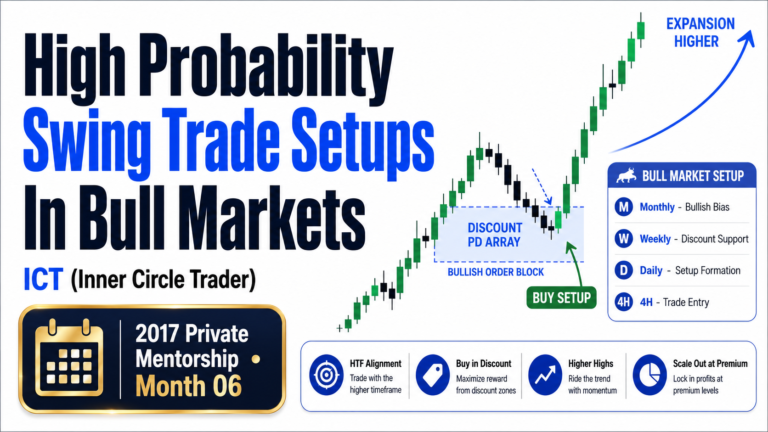
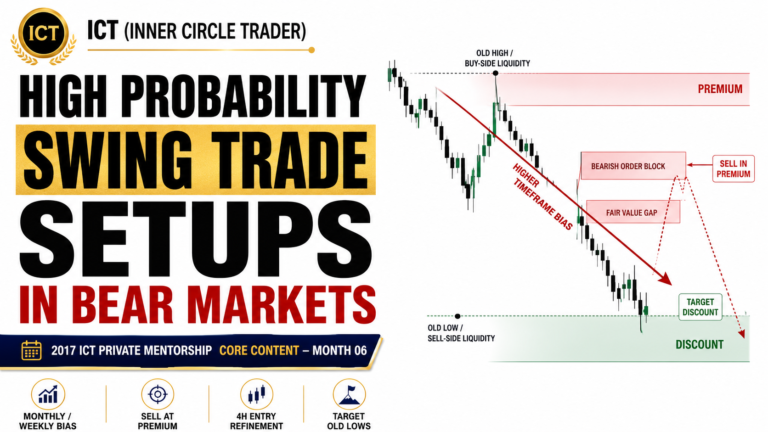
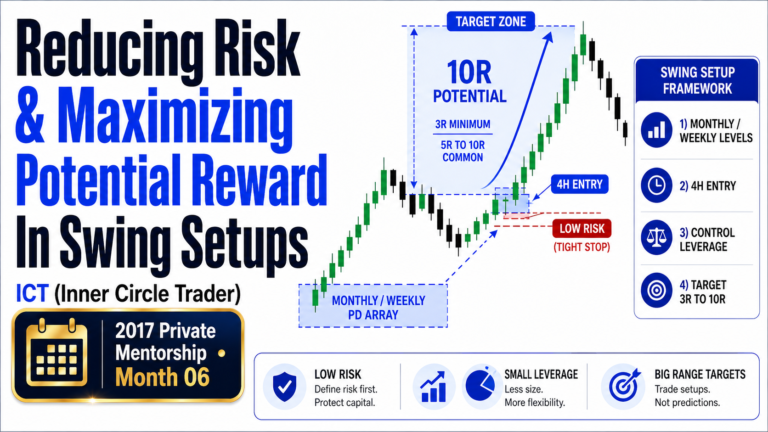
Ideal Swings Conditions For Any Market is a framework taught by Michael J. Huddleston, founder of the ICT (Inner Circle Trader) methodology, in the 2017 ICT Private Mentorship Core Content Month 06. The lesson explains how traders can identify markets with the strongest potential for sustained directional movement instead of wasting time in slow, range-bound conditions.
Swing trading is not simply holding a position for several days. It involves selecting a market where higher-timeframe price action supports a large directional move, waiting for a favorable retracement, and entering in the direction of institutional order flow.
As Michael J. Huddleston explains:
“Every market isn’t ideal for setups for swing trading.”
The first responsibility of a swing trader is therefore not finding an entry. It is finding the right market.
What Is Swing Trading in ICT?
In the ICT methodology, swing trading is the practice of trading predictable intermediate-term price movements with a high degree of consistency.
A swing trader generally:
- Buys during bullish market conditions
- Sells short during bearish market conditions
- Holds positions for approximately two weeks or longer
- Looks for larger price objectives rather than small intraday moves
- Uses monthly and weekly charts to establish direction
- Uses daily and four-hour charts to locate setups and entries
Because the position may remain open for several weeks, a properly selected swing trade can capture a substantial portion of a higher-timeframe move. In currency markets, this may produce opportunities of approximately 200 to 500 pips, although the actual result depends on volatility and market conditions.
The goal is to capitalize on the effects of larger institutional participants entering a market and creating significant price displacement.
The Best Swing Markets Are Already Moving
The most important condition behind Ideal Swings Conditions For Any Market is a clear higher-timeframe trend.
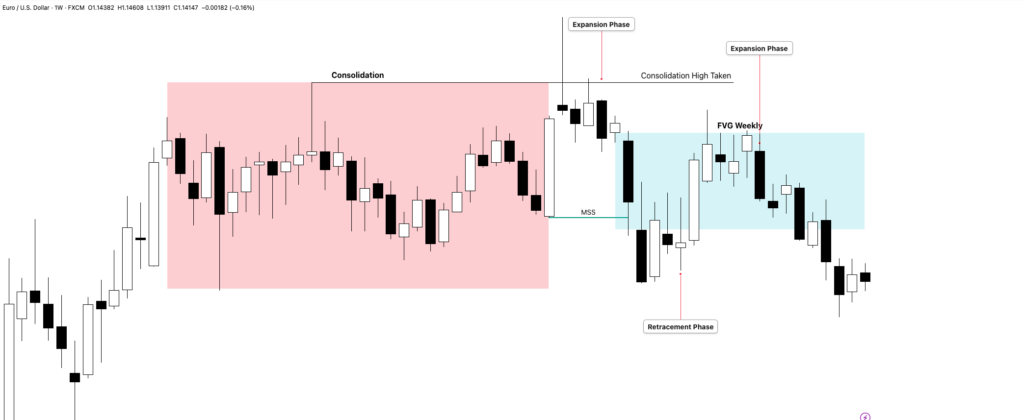
Swing traders should focus on markets showing directional movement on the monthly and weekly charts. A market that has already moved away from consolidation demonstrates that buyers or sellers have enough influence to push price toward a larger higher-timeframe objective.
A bullish swing-trading market may show:
- Higher highs and higher lows
- Strong bullish monthly or weekly candles
- Expansion away from consolidation
- Retracements that fail to break the bullish structure
- Price moving toward higher-timeframe buy-side liquidity
- Price targeting a premium PD Array or liquidity objective
A bearish swing-trading market may show:
- Lower highs and lower lows
- Strong bearish monthly or weekly candles
- Expansion below consolidation
- Retracements that fail to break the bearish structure
- Price moving toward higher-timeframe sell-side liquidity
- Price targeting a discount PD Array or liquidity objective
The presence of a trend suggests that larger participants are already active in the market. This institutional participation creates the potential energy needed for a meaningful swing move.
Understand the Three Main Market Profiles
ICT traders should study the current market profile before searching for a swing setup. The three primary profiles are consolidation, trending and reversal.
Consolidation Profile
A consolidation forms when price remains trapped inside a defined range. The market is unwilling to make sustained progress in either direction.
This condition usually indicates neutrality or insufficient institutional interest. Buyers are not strong enough to force price higher, while sellers are not strong enough to force price lower.
Although traders may find short-term opportunities inside the range, consolidation is generally not the ideal environment for directional swing trading.

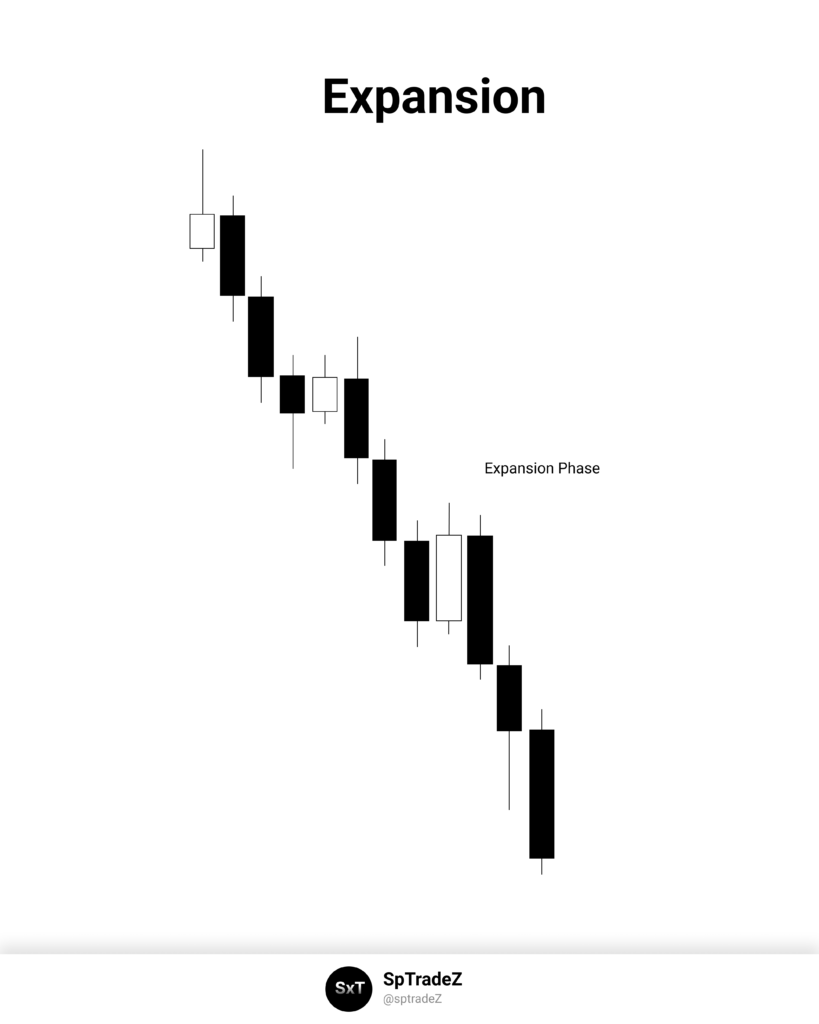
Trending Profile
A trending market consistently expands in one direction while producing temporary retracements.
This is the preferred profile for swing traders because it reflects large directional flows. The trader can wait for price to retrace into a favorable location and then participate in the continuation of the higher-timeframe trend.
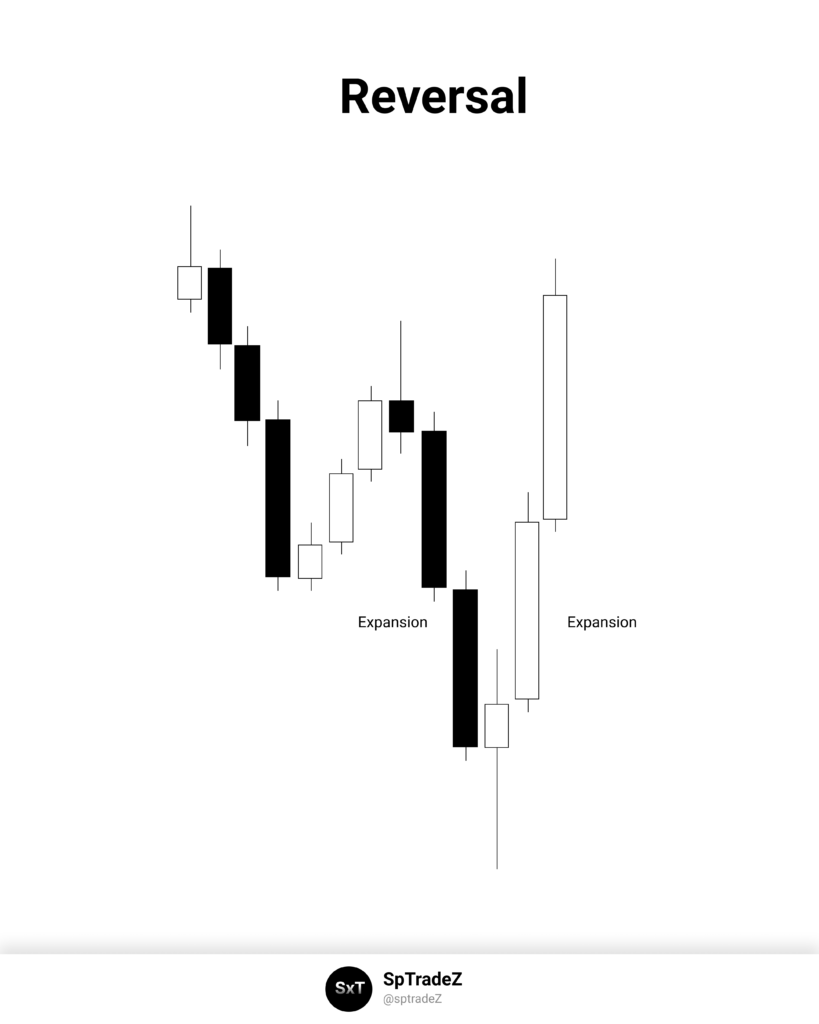
Reversal Profile
A reversal profile develops when an existing trend begins to weaken and price starts transitioning in the opposite direction.
Reversals can produce excellent swing opportunities, but they require more confirmation. Traders should avoid attempting to pick a major top or bottom simply because price appears overextended.
Michael J. Huddleston emphasizes:
“Be willing to err on the direction.”
In practical terms, this means it is usually better to trade with an established trend than to repeatedly anticipate its reversal.
Avoid Slow and Range-Bound Markets
A market may be popular, heavily traded or familiar, but that does not automatically make it suitable for swing trading.
The ICT swing trader should avoid markets that have shown little movement over the previous several months. A narrow monthly or weekly range often signals limited participation and a lack of directional commitment.
Warning signs include:
- Several overlapping monthly candles
- Weekly candles repeatedly trading through the same area
- No clear sequence of higher highs or lower lows
- Frequent movement above and below the same price level
- Failed attempts to leave the range
- Limited separation between major liquidity objectives
- Price remaining in the middle of a large consolidation
A market trapped in a holding pattern may continue to move back and forth without delivering the sustained expansion required for a high-probability swing trade.
The objective is not to force a setup in a favorite market. The objective is to locate the market currently offering the clearest directional opportunity.
Swing Opportunities Rotate Between Markets
There is no permanent best market for swing trading.
Large price movements rotate between currencies, commodities, indices and other financial instruments. A market that produced excellent swing trades during one period may become slow and unproductive during the next.
Michael J. Huddleston teaches that traders should regularly reassess the market and look for new opportunities forming over approximately three-month intervals.
This does not mean every market will reverse every three months. It means that quarterly periods often reveal changes in volatility, institutional participation and directional opportunity.
The trader should review multiple markets and ask:
- Which market has recently left consolidation?
- Which market is trending clearly on the monthly chart?
- Which market is also showing direction on the weekly chart?
- Which market has enough space to reach the next liquidity objective?
- Which market is currently retracing against its established trend?
This process creates a watchlist based on current conditions rather than personal preference.
Start With the Monthly and Weekly Charts
The Ideal Swings Conditions For Any Market model begins with top-down analysis.
The monthly chart reveals the broad market profile and the strongest long-term direction. The weekly chart provides additional detail about structure, expansion and retracement.
When both charts support the same direction, the trader gains a clearer framework.
For a bullish swing setup:
- Monthly price action should support higher prices
- Weekly structure should remain bullish
- Price should have room to move toward a higher objective
- The trader should wait for a retracement into discount
- Daily or four-hour price action should provide confirmation
For a bearish swing setup:
- Monthly price action should support lower prices
- Weekly structure should remain bearish
- Price should have room to move toward a lower objective
- The trader should wait for a retracement into premium
- Daily or four-hour price action should provide confirmation
The higher-timeframe direction removes much of the uncertainty about which side of the market to trade.
As Huddleston states:
“Focus on the long-term trend and the market tide will carry your trade to the winner’s circle more often than not.”
Wait for Price to Retrace Into a Favorable Location
A trending market does not mean the trader should enter immediately.
After identifying a bullish or bearish higher-timeframe condition, the next step is waiting for price to retrace into an area offering favorable risk and reward.
In bullish conditions, the trader should generally look for price to move into discount. Potential reference points may include:
- Bullish Order Blocks
- Fair Value Gaps
- Breaker Blocks
- Previous resistance acting as support
- Sell-side liquidity below short-term lows
- The discount portion of a dealing range
- Higher-timeframe bullish PD Arrays
In bearish conditions, the trader should generally look for price to move into premium. Potential reference points may include:
- Bearish Order Blocks
- Fair Value Gaps
- Breaker Blocks
- Previous support acting as resistance
- Buy-side liquidity above short-term highs
- The premium portion of a dealing range
- Higher-timeframe bearish PD Arrays
The retracement allows the trader to enter closer to invalidation while maintaining a larger potential target.
Use the Daily and Four-Hour Charts for Execution
Monthly and weekly charts establish the market and direction, but they do not always provide a precise entry.
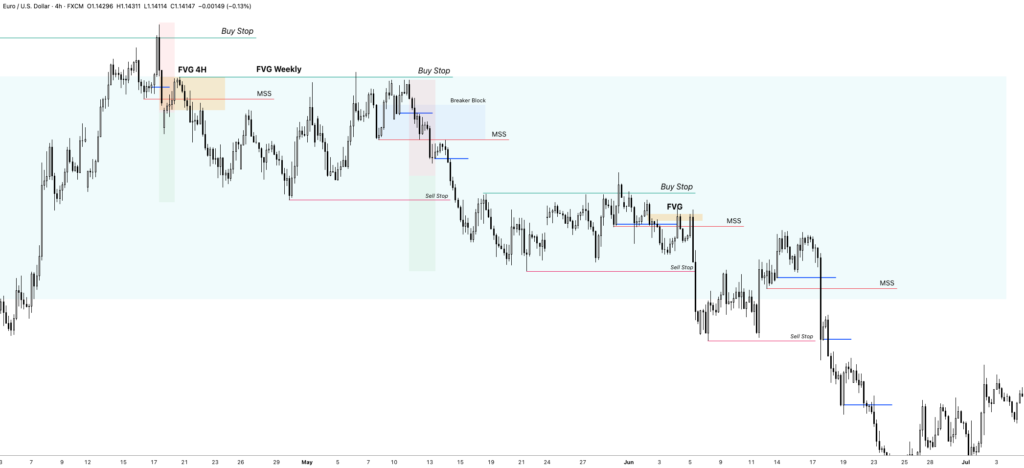
The daily chart can be used to identify the developing setup, while the four-hour chart can provide execution.
A bullish four-hour entry may develop after:
- Price reaches a higher-timeframe discount area
- Sell-side liquidity is taken
- Bullish displacement appears
- Market structure shifts higher
- A bullish Fair Value Gap or Order Block forms
- Price retraces into the newly created PD Array
A bearish four-hour entry may develop after:
- Price reaches a higher-timeframe premium area
- Buy-side liquidity is taken
- Bearish displacement appears
- Market structure shifts lower
- A bearish Fair Value Gap or Order Block forms
- Price retraces into the newly created PD Array
The lower-timeframe setup should support the monthly and weekly direction. It should not be used to argue against the higher-timeframe trend without strong evidence of a genuine reversal.
Do Not Try to Pick Every Top and Bottom
One of the most common swing-trading mistakes is attempting to trade against a strong monthly or weekly trend.
A market may look overbought or oversold for a long time while continuing to expand. Trying to predict the exact end of the move can lead to repeated losses.
When monthly and weekly price action is bullish, the primary objective should be finding buying opportunities. When those charts are bearish, the primary objective should be finding selling opportunities.
This does not guarantee that every trade will succeed. It simply places the trader on the side supported by the strongest available evidence.
A trader should be willing to accept a loss while following a valid higher-timeframe framework. Taking a properly planned loss in the direction of the dominant trend is different from taking a random trade against institutional order flow.
What Repeated Failed Setups Can Reveal
Even a strong higher-timeframe trend eventually weakens.
Suppose the monthly and weekly charts remain bullish, but two well-structured bullish swing setups fail consecutively. This may indicate that the trend is losing momentum or approaching an intermediate-term shift.
Repeated failures can provide useful feedback:
- The existing trend may be exhausted
- Institutional sponsorship may be weakening
- Price may be approaching a higher-timeframe objective
- A reversal profile may be developing
- The market may be transitioning into consolidation
This does not mean the trader should immediately reverse direction. It means the existing bias should be reassessed before taking another setup.
Ideal Swing Trading Checklist
Before entering a swing trade, confirm the following conditions.
Market Selection
- Is the market moving clearly on the monthly or weekly chart?
- Has price recently left a consolidation?
- Is there evidence of sustained institutional participation?
- Has the market avoided prolonged lethargic conditions?
- Is this market stronger than the other markets on the watchlist?
Directional Bias
- Are the monthly and weekly charts aligned?
- Is price forming higher highs and higher lows for bullish conditions?
- Is price forming lower highs and lower lows for bearish conditions?
- Is the planned trade aligned with the dominant trend?
- Is there a clear higher-timeframe draw on liquidity?
Setup Location
- Is a bullish setup forming in discount?
- Is a bearish setup forming in premium?
- Has price reached a meaningful PD Array?
- Has nearby liquidity been taken?
- Is there enough distance available to justify the trade?
Execution
- Has daily or four-hour price action confirmed the idea?
- Is there displacement in the intended direction?
- Has market structure shifted?
- Is there a logical entry PD Array?
- Is the invalidation level clearly defined?
Trade Management
- Can the position be held for two weeks or longer if necessary?
- Is the risk appropriate for a longer-duration trade?
- Is the target based on liquidity or a higher-timeframe PD Array?
- Can normal retracements be tolerated without emotional interference?
- Is the trade being managed according to the original higher-timeframe idea?
Final Thoughts
The foundation of Ideal Swings Conditions For Any Market is proper market selection. The trader should not begin by searching for an entry pattern. The process begins by locating a market that is already demonstrating strong higher-timeframe direction.
Trending monthly and weekly charts reveal the presence of large directional flows. Once the correct market and direction have been identified, the trader waits for a retracement into premium or discount, studies the relevant PD Arrays, and uses the daily or four-hour chart to execute.
The ICT (Inner Circle Trader) swing-trading approach is therefore built around patience, direction and selectivity. The best opportunity may not be in the trader’s favorite market, and it may not appear every week. However, when higher-timeframe direction, institutional participation, favorable location and lower-timeframe confirmation align, the conditions exist for a meaningful swing trade.