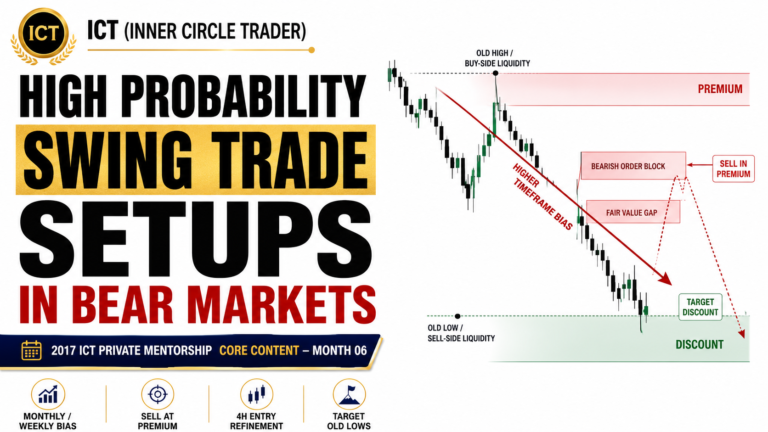
High Probability Swing Trade Setups In Bull Markets is a framework taught by Michael J. Huddleston, founder of the ICT (Inner Circle Trader) methodology, in the 2017 ICT Private Mentorship Core Content Month 06.
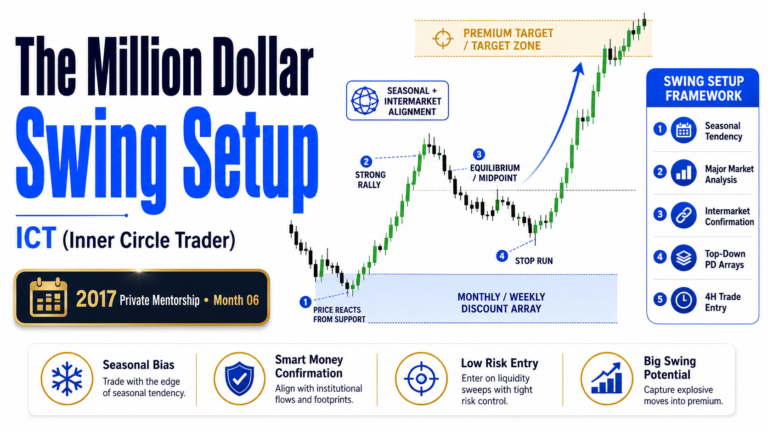
The model explains how traders can identify bullish swing opportunities by aligning the monthly, weekly and daily charts, locating active Discount PD Arrays, and using the four-hour chart to refine entries.
The central idea is simple: when higher-timeframe price action shows clear bullish displacement, the trader should wait for price to retrace into discount rather than chase the rally.
Michael J. Huddleston explains:
“When the monthly, weekly and daily are all indicating higher prices, you’re going to be looking for daily and four-hour discount arrays to trade at.”
This is the foundation of high-probability swing trading in a bull market.
What Defines a Bull Market in ICT?
A bullish market is not identified only because price is moving higher on a lower timeframe.
In the ICT framework, a bull market should show evidence of buying on the higher-timeframe charts.
The trader wants to see:
- Bullish displacement on the monthly chart
- Bullish displacement on the weekly chart
- Bullish structure or support on the daily chart
- Higher highs and higher lows
- Down candles acting as support
- Bearish PD Arrays failing to resist price
- Price expanding toward Premium PD Arrays
The most important evidence is displacement from a Discount PD Array.
This may occur after price reacts from:
- A bullish Order Block
- A bullish Breaker
- A bullish Mitigation Block
- A Fair Value Gap
- A Liquidity Void
- An old low
- An old high acting as support
- A bullish Rejection Block
When price moves away from one of these levels with speed and strength, it suggests institutional buying.
The Bullish Monthly, Weekly and Daily Sequence
The highest-probability bullish swing setups occur when the monthly, weekly and daily charts support higher prices.
The trader studies the market in sequence:
Monthly
Weekly
Daily
Four-hour execution
Each timeframe provides a different part of the trading idea.
Monthly Chart
The monthly chart establishes the larger market condition.
The trader looks for:
- A long-term bullish market profile
- Displacement away from a monthly Discount PD Array
- A broken monthly swing high
- A clear draw toward a monthly Premium PD Array
- Evidence that price has left consolidation
The monthly chart tells the trader whether the market is predisposed to trade higher.
Weekly Chart
The weekly chart reveals whether the monthly bullish condition is being supported or whether price is currently correcting.
The trader marks weekly Discount PD Arrays such as:
- Weekly bullish Order Blocks
- Weekly Fair Value Gaps
- Weekly Breakers
- Weekly Mitigation Blocks
- Weekly old lows
- Weekly Rejection Blocks
These levels may become important buying locations during a retracement.
Daily Chart
The daily chart is used to locate more precise bullish levels.
The trader should mark the high and opening price of important down candles that formed before strong bullish displacement.
These candles may become bullish Order Blocks and provide support when price returns to them.
Four-Hour Chart
The four-hour chart is the primary execution timeframe.
It allows the trader to refine the higher-timeframe levels and reduce the distance between the entry and invalidation point.
Scenario One: Monthly, Weekly and Daily Are Bullish
This is the clearest bullish swing-trading condition.
The monthly chart has moved higher from discount.
The weekly chart has also produced bullish displacement.
The daily chart is making higher highs and higher lows.
In this condition, the trader can look to buy active bullish Discount PD Arrays on the daily and four-hour charts.
Potential buying locations include:
- Bullish Order Blocks
- Bullish Breakers
- Bullish Mitigation Blocks
- Fair Value Gaps below price
- Liquidity Voids
- Rejection Blocks
- Old lows containing sell-side liquidity
- Previous highs acting as support
Each retracement into a valid daily or four-hour Discount PD Array may provide another buying opportunity.
The expectation is that buying volatility will enter the market and price will expand higher.
Scenario Two: Monthly and Weekly Are Bullish, Daily Is Correcting
A daily correction does not automatically make the market bearish.
When the monthly and weekly charts remain bullish but the daily chart is trading lower, the trader should look for daily bullish Discount PD Arrays located inside or near a weekly Discount PD Array.
This is known as nesting.
Examples include:
- A daily bullish Order Block inside a weekly bullish Order Block
- A daily Fair Value Gap inside a weekly liquidity void
- A four-hour bullish Breaker inside a daily and weekly discount area
- A daily old low aligned with a weekly bullish PD Array
The overlapping levels create a stronger area of interest.
In this condition, the trader should avoid buying every random daily level. The best setup usually forms when the daily retracement reaches a meaningful weekly location.
Scenario Three: Monthly Is Bullish, Weekly and Daily Are Correcting
The market may still offer a bullish swing trade even when the weekly and daily charts appear bearish.
If the monthly chart has already shown strong bullish displacement, the weekly and daily decline may simply be a deeper retracement into a monthly Discount PD Array.
The trader should then focus on:
- Monthly bullish Order Blocks
- Monthly Fair Value Gaps
- Monthly Liquidity Voids
- Monthly Breakers
- Monthly Mitigation Blocks
- Monthly old highs or lows
- Deep discount within the monthly range
The daily and four-hour charts can then be used to find a bullish entry after price reaches the monthly level.
The trader must be patient because the weekly and daily charts may continue lower before the monthly level is reached.
Nested Discount PD Arrays
One of the strongest conditions for High Probability Swing Trade Setups In Bull Markets is the presence of nested Discount PD Arrays.
A nested setup forms when bullish levels from different timeframes overlap.
For example:
- A monthly bullish Order Block
- A weekly bullish Order Block inside the monthly level
- A daily Fair Value Gap inside the weekly level
- A four-hour bullish Order Block inside the daily gap
The more relevant higher-timeframe levels that overlap, the more sensitive the area may become.
However, traders should not force confluence. The levels should form naturally within the current dealing range.
How to Mark Bullish Order Blocks
In bullish conditions, down candles that form before strong upward displacement may act as support.
The trader may mark:
- The opening price of the down candle
- The high of the down candle
- The body of the candle
- The entire range when necessary
Michael J. Huddleston emphasizes that these are specific price levels, not vague zones.
The trader should pay attention to how price reacts when it returns to these levels.
A strong reaction may include:
- Immediate bullish displacement
- A break above a short-term high
- A new higher high
- A Fair Value Gap forming during the rally
- Limited trading below the level
The Role of Sell-Side Liquidity
Bullish swing setups frequently form after price trades below an old low.
The move below the low allows larger buyers to use sell stops as counterparties for their long positions.
This may appear as:
- A sweep below a short-term low
- A false break below support
- A Turtle Soup long setup
- A move below the bodies of long-wicked candles
- A rejection from a higher-timeframe Discount PD Array
The liquidity sweep becomes more meaningful when it occurs inside a valid daily, weekly or monthly discount area.
Buying below an old low without a supporting higher-timeframe framework is not enough.
Using Premium and Discount Correctly
The trader must understand where price is located inside the active dealing range.
The range is measured from an important low to an important high.
The midpoint represents equilibrium.
Below equilibrium is discount.
Above equilibrium is premium.
In bullish conditions, the trader wants to buy in discount and avoid initiating new long positions deep in premium.
Huddleston explains that bullish Order Blocks located in premium may cause small reactions, but they are generally less reliable than bullish Order Blocks located in discount.
The best long opportunities usually appear in the lower portion of the dealing range.
Deep Discount Areas
A deeper retracement may offer a more favorable buying price, but the trader should not assume that price must reach the deepest level.
Common reference points inside the range include:
- 20 percent
- 30 percent
- 50 percent equilibrium
- 80 percent
- 90 percent
For bullish trades, the lower portion represents the Discount Spectrum.
The 20 and 30 percent areas may represent deep discount, while the 50 percent level represents equilibrium.
The purpose of these levels is not to create an automatic Fibonacci entry. They help the trader understand where the active PD Arrays are located relative to the current range.
Four-Hour Entry Procedure
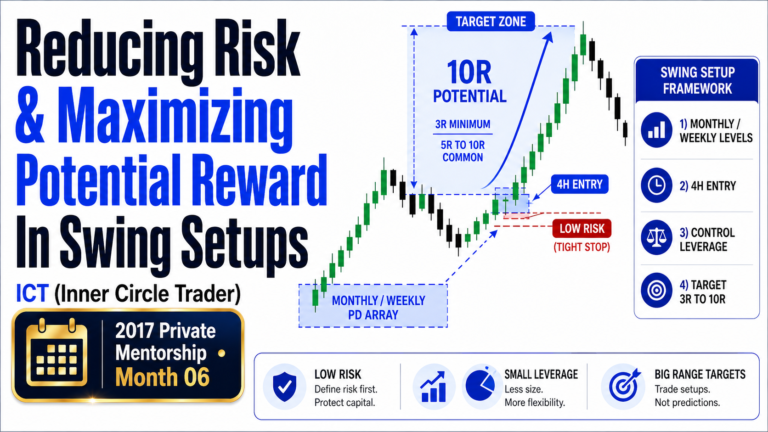
Once the higher-timeframe bullish condition has been established, the trader can move to the four-hour chart.
The entry procedure may include the following steps:
- Identify the monthly, weekly and daily Discount PD Arrays.
- Transfer those levels to the four-hour chart.
- Wait for price to retrace into one of the levels.
- Look for a liquidity sweep or reaction.
- Confirm bullish displacement.
- Look for a break above a short-term high.
- Enter from a four-hour bullish PD Array.
- Place the stop below a logical invalidation level.
- Target opposing Premium PD Arrays.
The trade should be framed as a swing trade, not managed like an intraday scalp.
Confirmation Through a Higher High
A bullish reaction becomes more convincing when price breaks a previous short-term high.
This confirms that real buying may be entering the market.
After the high is broken, the trader can study the down candles inside the new bullish impulse move.
These candles may become new four-hour bullish Order Blocks.
The sequence may continue as follows:
Price reacts from discount
Bullish displacement forms
A short-term high is broken
Price retraces into a new bullish Order Block
Price creates another higher high
This repeated process reflects bullish institutional order flow.
When to Avoid Buying
A bullish higher-timeframe outlook does not mean every Discount PD Array should be bought.
The trader should avoid buying when price creates evidence of a bearish structural shift.
One warning sign is:
Price creates a higher high
The higher high is strongly rejected
Price breaks down through market structure
A bearish Breaker begins to form
When this occurs on the daily chart, it may temporarily invalidate daily buying opportunities.
When it occurs on the weekly chart, the warning is more significant.
The trader should wait for a deeper higher-timeframe Discount PD Array or reassess the bullish idea.
Bullish Setup Invalidation
A bullish setup may weaken or fail when:
- Price breaks through an important Discount PD Array without reacting
- The daily chart forms a bearish Breaker
- The weekly chart rejects a higher high and breaks structure
- Bullish displacement fails to create a new high
- Down candles stop supporting price
- Bearish Order Blocks begin holding as resistance
- Price remains below the expected support level
A failed four-hour Order Block does not always invalidate the monthly bullish bias.
Price may simply be seeking a lower daily, weekly or monthly Discount PD Array.
The trader must distinguish between a failed entry and a failed higher-timeframe idea.
Confirming Institutional Buying
As the trade moves higher, the trader should observe how price interacts with bearish PD Arrays.
In a strong bull market:
- Bearish Order Blocks should fail
- Up candles that could act as resistance should be broken
- Old highs should be violated
- Down candles should provide support
- Retracements should remain limited
- Price should continue forming higher highs and higher lows
Michael J. Huddleston explains:
“You want to be seeing all bearish order blocks or up candles right before down moves being broken as potential resistance points.”
When bearish resistance repeatedly gives way, it supports the idea that institutional buyers remain active.
Profit Objectives in a Bull Market
Bullish swing trades should target Premium PD Arrays above price.
Potential objectives include:
- Four-hour Fair Value Gaps
- Daily liquidity voids
- Weekly bearish Order Blocks
- Monthly Premium PD Arrays
- Old highs
- Buy-side liquidity
- Historical highs
- Unfilled price ranges
The trader should identify these objectives before entering.
The nearest Premium PD Array may become the first target.
Additional positions may be held for higher daily, weekly or monthly objectives.
Scaling Out of the Trade
Swing trades may take several days or weeks to reach their final target.
The trader does not need to hold the full position until the highest objective is reached.
A practical approach is to scale out at:
- The first four-hour Premium PD Array
- A daily Premium PD Array
- A weekly objective
- A monthly objective
The position should become smaller as price moves deeper into premium.
This protects open profit and reduces the impact of a larger retracement.
Swing Trading Requires Time
Swing trading is not designed to produce immediate results.
A setup may take:
- Several days to form
- Two weeks to develop
- A month or longer to reach its final objective
Huddleston states:
“That’s swing trading. It’s not overnight, it’s not intraday.”
The trader must allow the higher-timeframe idea enough time to develop.
Constantly checking the chart or managing the position like a day trade may cause the trader to exit too early.
High Probability Bull Market Checklist
Before entering a bullish swing trade, confirm the following.
Higher-Timeframe Bias
- Has the monthly chart shown bullish displacement?
- Has a monthly swing high been broken?
- Is the weekly chart bullish or correcting into monthly discount?
- Is the daily chart bullish or approaching a higher-timeframe level?
- Is there a clear Premium PD Array above price?
Entry Location
- Is price inside discount?
- Is there a daily or weekly Discount PD Array?
- Are multiple bullish PD Arrays nested?
- Has sell-side liquidity been taken?
- Is the four-hour entry located near a higher-timeframe level?
Bullish Confirmation
- Has price reacted strongly from the level?
- Has bullish displacement appeared?
- Has a short-term high been broken?
- Are down candles supporting price?
- Are bearish PD Arrays failing?
Risk Management
- Is the stop below a logical invalidation point?
- Is the position sized for a swing trade?
- Is there sufficient distance to the first Premium PD Array?
- Can profits be scaled out at several objectives?
- Can the trade be held for two weeks or longer?
Reasons to Avoid the Trade
- Has the daily chart formed a bearish Breaker?
- Has the weekly chart rejected a higher high?
- Is price already deep in premium?
- Is the market trapped in consolidation?
- Is there no clear higher-timeframe objective?
Final Thoughts
The foundation of High Probability Swing Trade Setups In Bull Markets is higher-timeframe alignment.
The trader begins with the monthly chart, studies the weekly and daily corrections, and then uses the four-hour chart to refine the entry.
The strongest bullish opportunities appear when price retraces into a daily, weekly or monthly Discount PD Array and then shows renewed bullish displacement.
The basic sequence is:
Bullish higher-timeframe condition
Retracement into discount
Liquidity sweep
Bullish reaction
Break above a short-term high
Entry from a four-hour Discount PD Array
Expansion toward premium
The ICT (Inner Circle Trader) approach does not teach traders to buy every Order Block or every old low. A valid swing trade must be supported by the larger market condition, the current dealing range, the location of price and the behavior of institutional order flow.
When these elements align, the trader can participate in the bullish move while keeping the entry precise and the risk controlled.