The Million Dollar Swing Setup is a rule-based swing-trading framework taught by Michael J. Huddleston, founder of the ICT (Inner Circle Trader) methodology, in the 2017 ICT Private Mentorship Core Content Month 06.
The name does not mean that every trade will make one million dollars. It describes what Huddleston considers one of the strongest combinations of technical, seasonal and intermarket conditions for finding major swing opportunities.
Michael J. Huddleston explains:
“We are not stating that you’re making a million dollars on this. It just means that this is the best condition I have found in my technical tools.”
The setup is not a single entry pattern. It is a complete analytical process that begins with seasonal tendency and continues through major market analysis, intermarket confirmation, top-down analysis, trade execution and position management.
What Is The Million Dollar Swing Setup?
The Million Dollar Swing Setup is a filtering process used to identify markets that are most likely to produce sustained directional moves.
The process follows this sequence:
Seasonal tendency
Major market analysis
Intermarket analysis
Top-down analysis
Trade setup
Trade entry
Trade management
Each stage must provide enough confirmation to continue to the next.
When the necessary conditions are missing, the trader does not force a swing trade. The correct decision is to wait or focus on a shorter-term trading model.
This filtering process is what makes the setup selective.
The Importance of Seasonal Tendency
The first condition is seasonal tendency.
A seasonal tendency is a recurring period when a market has historically shown a greater probability of moving higher or lower.
The first question is:
- Is there a seasonal tendency to buy or sell now?
- Is a seasonal tendency expected to begin soon?
If the answer is yes, the trader continues to major market analysis.
If the answer is no, the trader considers another market or waits for a new seasonal opportunity.
Huddleston states:
“Without a seasonal tendency, I don’t trade it.”
Seasonality does not guarantee a move. It provides a historical framework that can be combined with other technical and fundamental conditions.
Major Market Analysis
After identifying a seasonal tendency, the trader studies the broader market environment.
The four major asset classes are:
- Interest rates and bonds
- Currencies
- Commodities
- Stocks
The purpose is to determine whether the markets are trending or consolidating and whether the environment supports swing trading.
The trader asks:
- Are interest-rate markets trending?
- Is the US Dollar Index trending?
- Are commodity markets trending?
- Are stock markets trending?
- Is the environment risk-on or risk-off?
At least one market from the interest-rate or currency group and one market from the commodity or stock group should show a meaningful trend.
When these markets are range-bound or unclear, the conditions may be more suitable for day trading than swing trading.
Why Trending Markets Matter
Swing trades need sustained institutional participation.
A trending bond, currency, commodity or stock market suggests that large capital is moving through the financial system.
This creates the potential for:
- Strong displacement
- Larger price ranges
- Multi-week directional moves
- Cleaner higher-timeframe targets
- Better reward-to-risk setups
A market trapped in consolidation may still offer short-term trades, but it is less likely to deliver the type of expansion required for The Million Dollar Swing Setup.
Intermarket Analysis
The next stage is intermarket analysis.
The trader studies the relationship between different asset classes and correlated markets.
Important relationships may include:
- The US Dollar Index and foreign currencies
- The US Dollar Index and metals
- Commodities and inflation-sensitive assets
- Interest rates and currency strength
- Stocks and risk sentiment
- Closely correlated currency pairs
- SMT Divergence between related markets
The purpose is to determine whether surrounding markets support the intended direction.
Bullish Currency or Metal Setup
For a bullish foreign currency or metal swing setup, the trader looks for several supporting conditions.
These may include:
- A bullish seasonal tendency
- Commercial traders buying or reducing short positions
- A bearish US Dollar Index
- Commodities breaking old highs
- Commodities rejecting old lows
- Open interest declining significantly
- Higher-timeframe Discount PD Arrays supporting price
The Dollar Index should generally support weakness when the trader expects a foreign currency or metal to rise.
This relationship may be confirmed through SMT Divergence.
Bearish Currency or Metal Setup
For a bearish foreign currency or metal setup, the trader looks for the opposite conditions.
These may include:
- A bearish seasonal tendency
- Commercial traders selling or holding strong short positions
- A bullish US Dollar Index
- Commodities breaking old lows
- Commodities rejecting old highs
- Open interest rising significantly
- Higher-timeframe Premium PD Arrays resisting price
The Dollar Index should generally support strength when the trader expects a foreign currency or metal to decline.
Commitment of Traders Analysis
The Commitment of Traders report can help determine what large commercial participants are doing.
The trader studies the commercial position over approximately the previous 12 months.
The analysis should not focus only on whether commercials are technically net long or net short.
Instead, the trader should examine whether commercials are:
- Increasing long exposure
- Reducing short exposure
- Increasing short exposure
- Reducing long exposure
- Moving toward the upper or lower portion of their 12-month range
Commercials may still be net short while actively buying through short covering.
Similarly, they may remain net long while reducing exposure.
The direction of the hedging program is often more informative than the absolute position alone.
Open Interest as a Filter
Open interest can provide additional confirmation.
For bullish metal or currency conditions, declining open interest may indicate commercial short covering.
For bearish conditions, rising open interest may indicate new commercial short selling.
A change of approximately 10 to 15 percent or more may be significant enough to study.
Open interest should not be used alone. It should agree with seasonality, commercials, correlation and price structure.
Top-Down Analysis
Once the seasonal, major market and intermarket conditions align, the trader begins top-down chart analysis.
The process includes:
- Reviewing the previous 9 to 18 months
- Identifying the current market profile
- Marking monthly PD Arrays
- Marking weekly PD Arrays
- Marking daily PD Arrays
- Marking four-hour PD Arrays
- Transferring all important levels to the four-hour chart
This allows the trader to see the complete higher-timeframe framework on the execution chart.
IPDA Data Ranges
The trader should also study IPDA data ranges.
Common lookback periods include:
- 20 trading days
- 40 trading days
- 60 trading days
The process begins with the 20-day range.
If the important PD Arrays in that range have already been traded to or exhausted, the trader expands the analysis to 40 days and then 60 days.
The strongest levels may appear where:
- IPDA data ranges overlap
- Higher-timeframe PD Arrays converge
- Liquidity objectives align
- Institutional order flow supports the same direction
This convergence helps identify high-probability swing locations.
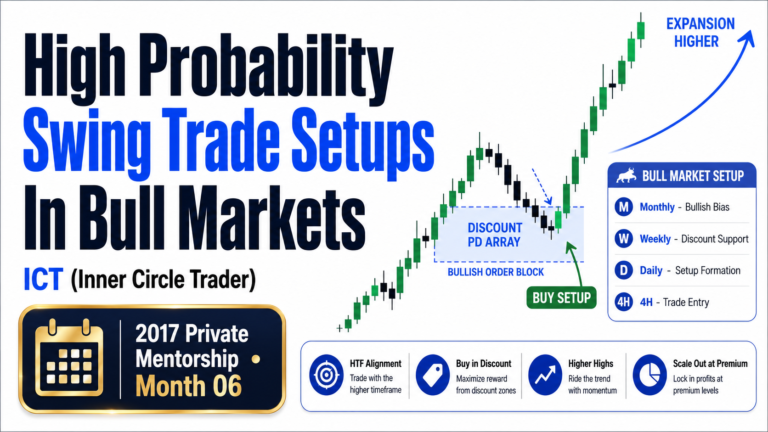
Bullish Trade Setup
For a bullish Million Dollar Swing Setup, the trader marks monthly and weekly Discount PD Arrays.
Possible bullish arrays include:
- Bullish Order Blocks
- Bullish Breakers
- Bullish Mitigation Blocks
- Fair Value Gaps
- Liquidity Voids
- Rejection Blocks
- Old lows
- Old highs acting as support
The best conditions occur when price reacts explosively from one of these levels.
The trader then looks for:
- A monthly or weekly discount location
- Daily support
- US Dollar Index weakness
- SMT Divergence
- Bullish displacement
- A four-hour entry model
The setup should have a clear Premium PD Array as the upside objective.
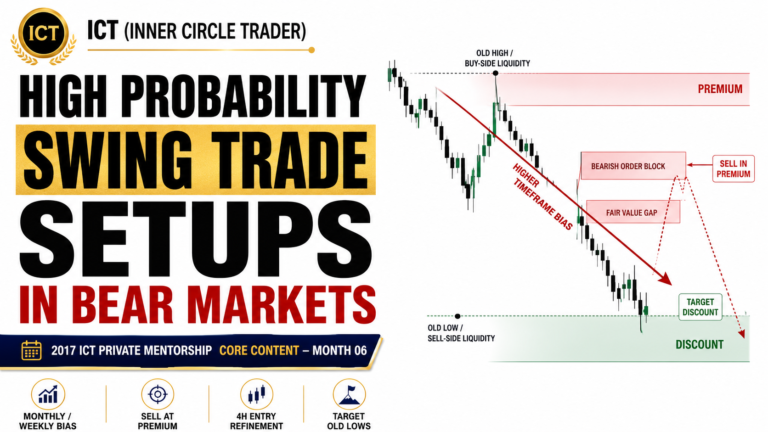
Bearish Trade Setup
For a bearish setup, the trader marks monthly and weekly Premium PD Arrays.
Possible bearish arrays include:
- Bearish Order Blocks
- Bearish Breakers
- Bearish Mitigation Blocks
- Fair Value Gaps
- Liquidity Voids
- Rejection Blocks
- Old highs
- Old lows acting as resistance
The trader then looks for:
- A monthly or weekly premium location
- Daily resistance
- US Dollar Index strength
- SMT Divergence
- Bearish displacement
- A four-hour execution model
The target should be a clearly defined Discount PD Array below price.
Choosing Between Stop and Limit Entries
The entry method depends on the type of PD Array being traded.
Bullish Entry Techniques
A buy stop may be preferred when buying:
- A bullish Breaker
- A bullish Mitigation Block
- A bullish Liquidity Void
- A bullish Fair Value Gap
A buy limit may be preferred when buying:
- A bullish Order Block
- A bullish Rejection Block
- Below an old low
The difference is based on how price is expected to confirm the setup.
Some arrays require price to show momentum before entry. Others allow entry directly at the expected support level.
Bearish Entry Techniques
A sell stop may be preferred when shorting:
- A bearish Breaker
- A bearish Mitigation Block
- A bearish Liquidity Void
- A bearish Fair Value Gap
A sell limit may be preferred when shorting:
- A bearish Order Block
- A bearish Rejection Block
- Above an old high
The entry technique should match the behavior expected from the PD Array.
Trade Management for Long Positions
Once a bullish swing trade is active, the trader manages it according to the intended objective.
The basic procedure is:
- Identify monthly, weekly and daily Premium PD Arrays
- Leave the initial stop unchanged at first
- Wait until price completes approximately one-third of the intended move
- Take partial profit after price reaches around one-quarter of the objective
- Scale out approximately 20 to 30 percent
- Move the stop to breakeven only after partial profit is secured
- Look for possible re-entry near the midpoint
- Take full profit at the intended Premium PD Array
- Alternatively, close 75 to 80 percent and trail the remainder
The stop may be trailed below the most recent four-hour short-term low.
Trade Management for Short Positions
For a bearish swing trade, the process is reversed.
The trader should:
- Identify monthly, weekly and daily Discount PD Arrays
- Keep the original stop in place initially
- Wait until price completes approximately one-third of the intended decline
- Take partial profit after approximately one-quarter of the objective
- Scale out around 20 to 30 percent
- Move the stop to breakeven only after profit has been taken
- Consider adding back after a short-term rally
- Exit at the intended Discount PD Array
- Alternatively, trail a small portion above four-hour short-term highs
The trader should avoid trailing the stop too quickly.
Why the Stop Should Not Move Too Early
Large swing moves usually contain retracements and stop runs.
If the trader moves the stop to breakeven immediately, a normal retracement may close the trade before the main expansion begins.
Huddleston advises:
“Move protective stop loss to break even after first profit is taken, never before.”
This allows the market enough room to develop while still protecting the account after partial profit has been secured.
Understanding the Midpoint Stop Run
The midpoint, or equilibrium, of the intended swing is important.
When price reaches or trades through equilibrium, it may retrace and attack liquidity on the opposite side.
In a bullish setup, price may run sell stops below a recent low near the midpoint.
In a bearish setup, price may run buy stops above a recent high.
This retracement does not necessarily invalidate the swing.
It may be part of the normal progression toward the final objective.
The trader should therefore expect volatility near the midpoint rather than immediately assuming the setup has failed.
The Two-Leg Swing Structure
A large swing often develops in two major legs.
A bullish example may look like:
Initial rally
Move toward equilibrium
Stop run below short-term lows
Expansion through equilibrium
Second retracement
Final expansion toward the Premium target
A bearish setup may develop in the opposite sequence.
Understanding this structure helps the trader avoid exiting during the middle of the move.
The Gold Example
The Million Dollar Swing Setup was demonstrated using gold.
The analysis included:
- A bullish seasonal tendency from December into early-year trading
- Trending bond and currency markets
- A trending stock market
- Commercial traders reducing shorts
- Bearish sentiment
- Declining open interest
- Bullish commodity behavior
- US Dollar Index divergence
- Monthly and weekly Discount PD Arrays
- Higher-timeframe Premium targets
Gold reacted near a monthly bullish Order Block around the lower portion of the range.
The projected objective was determined using weekly PD Arrays and a larger dealing range.
Equilibrium was identified near the middle of the move.
After price moved through the midpoint, a stop run created another opportunity before price expanded toward the final target.
Fibonacci Extension Confluence
Fibonacci extensions may be used to confirm a target already identified through PD Arrays.
Common extension levels include:
- 1.27
- 1.62
These levels should not create the trade idea by themselves.
Their purpose is to provide confluence with:
- Monthly PD Arrays
- Weekly PD Arrays
- Liquidity objectives
- Projected swing targets
When a Fibonacci extension and a higher-timeframe PD Array identify the same area, the target may become more meaningful.
Why It Is Called the Million Dollar Setup
The name refers to the quality of the framework, not a guaranteed financial result.
The setup is valuable because it provides rules for:
- When to look for a swing trade
- Which market to study
- Which direction to trade
- When to wait
- Which PD Arrays to use
- Whether to enter with a stop or limit order
- Where to place the objective
- When to take partial profit
- When to move the stop
- When to consider re-entry
It removes much of the randomness that causes traders to act emotionally.
The Setup Prevents Overtrading
Because the model requires seasonal alignment and several confirmation stages, valid setups are relatively infrequent.
This makes overtrading difficult.
A trader cannot justify taking a new swing position every day when the checklist demands:
- Seasonal tendency
- Trending major markets
- Commercial confirmation
- Correlation confirmation
- Commodity confirmation
- Open-interest confirmation
- Higher-timeframe PD Arrays
- A valid four-hour entry
The scarcity of setups is a strength.
It encourages patience and protects the trader from low-quality market conditions.
What to Do When Conditions Are Missing
If one stage fails, the trader should not force the next stage.
For example:
- No seasonal tendency: wait or study another market
- No major market trend: consider shorter-term trading
- No commercial confirmation: wait
- No Dollar Index confirmation: wait
- No open-interest confirmation: wait
- No higher-timeframe PD Array: wait
- No valid four-hour entry: wait
A missing condition does not mean the idea is permanently invalid.
It means the trader needs new information before continuing.
The Million Dollar Swing Setup Checklist
Seasonal Tendency
- Is there a clear seasonal tendency?
- Is it active now or expected soon?
- Does the tendency repeat consistently?
- Is the direction bullish or bearish?
- Is there another market with a stronger seasonal pattern?
Major Market Analysis
- Are interest-rate markets trending?
- Is the US Dollar Index trending?
- Are commodities trending?
- Are stocks trending?
- Is the environment risk-on or risk-off?
- Is at least one market from each major group trending?
Intermarket Confirmation
- Are commercials buying or selling?
- Are they reducing shorts or reducing longs?
- Does the Dollar Index support the setup?
- Are commodities confirming the direction?
- Is open interest confirming the move?
- Is SMT Divergence present?
Top-Down Analysis
- What is the 9-to-18-month market profile?
- Where are the monthly PD Arrays?
- Where are the weekly PD Arrays?
- Where are the daily PD Arrays?
- Where are the four-hour PD Arrays?
- Have all relevant levels been transferred to the execution chart?
- Do 20-, 40- or 60-day IPDA ranges provide confluence?
Entry
- Is price at premium or discount?
- Does the setup require a stop or limit entry?
- Is the entry aligned with the higher-timeframe bias?
- Has displacement confirmed the idea?
- Is invalidation clearly defined?
- Is there enough room to the opposing PD Array?
Trade Management
- Where is equilibrium?
- Where is the first partial-profit level?
- Has price moved one-quarter of the objective?
- Has the first partial profit been taken?
- Should the stop remain unchanged?
- Is a midpoint stop run likely?
- Is there an opportunity to add back?
- Where is the final Premium or Discount objective?
Final Thoughts
The Million Dollar Swing Setup is a complete analytical process, not a single chart pattern.
It combines:
Seasonal tendency
Major market trends
Commercial positioning
Intermarket relationships
Dollar Index confirmation
Commodity behavior
Open interest
IPDA data ranges
Higher-timeframe PD Arrays
Four-hour execution
Structured trade management
The ICT (Inner Circle Trader) framework gives the trader permission to continue only when the required conditions are present.
When they are not present, the trader waits.
That patience is one of the most important parts of the setup. The trader is not trying to predict every market move. The goal is to participate only when several independent forms of evidence support the same swing-trading idea.