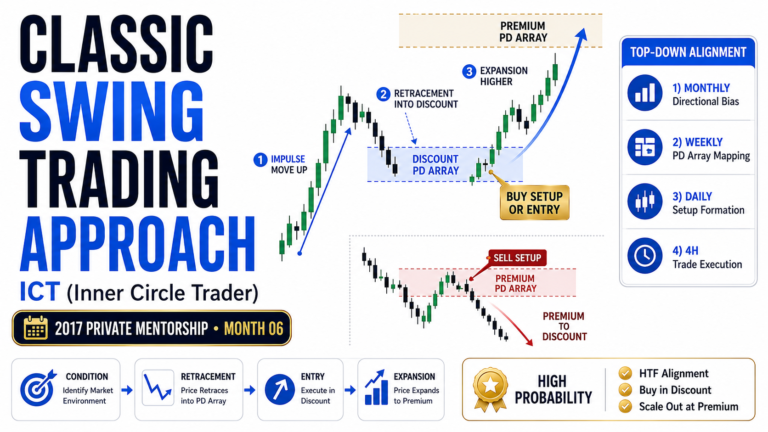
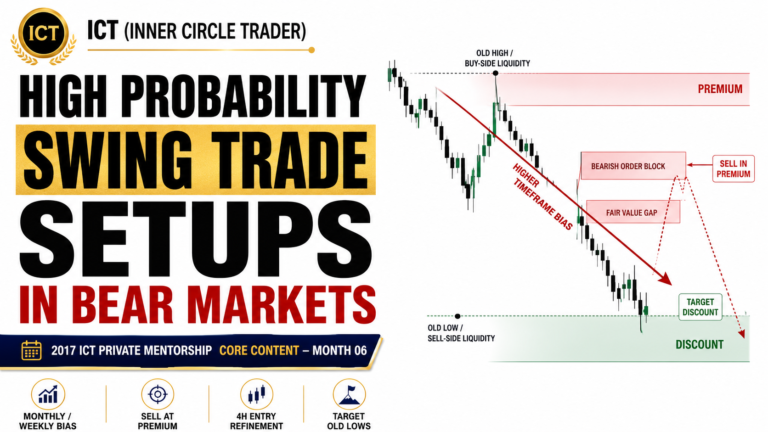
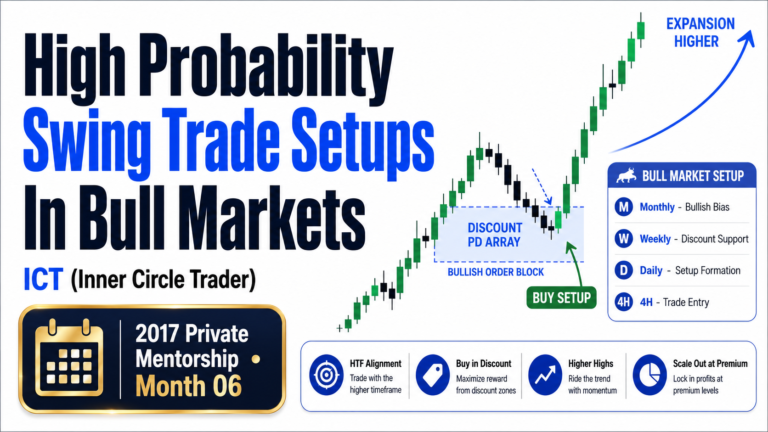
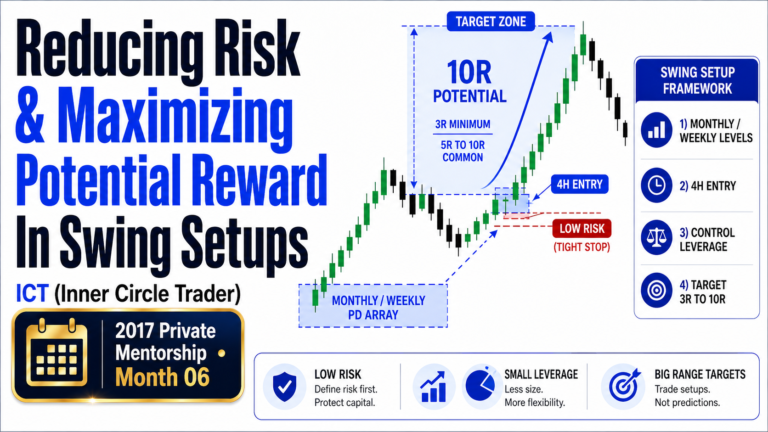
The Keys To Selecting Markets That Will Move Explosively are based on finding markets where several forms of analysis point toward the same directional outcome.
This framework was taught by Michael J. Huddleston, founder of ICT (Inner Circle Trader), in the 2017 ICT Private Mentorship Core Content Month 06. The goal is to identify markets that are not merely drifting higher or lower, but are positioned for strong, one-sided price delivery.
Explosive swing trades usually develop when market structure, intermarket relationships, commercial positioning, seasonality, volatility, sentiment, and higher-timeframe direction all support the same idea.
As Michael J. Huddleston explains:
“You want to be in those types of moves.”
The trader’s task is therefore not to monitor every available market. It is to narrow the list down to the markets showing the strongest evidence of an approaching expansion.
Look for Trending Major Asset Classes
The first step is to study the four major asset classes:
- Interest rates
- Stocks
- Commodities
- Currencies
A favourable swing-trading environment develops when at least two of these four asset classes are clearly trending.
All four do not need to trend at the same time. However, the broader market should not be completely trapped in consolidation or showing conflicting behaviour across every asset class.
ICT separates the four markets into two broad groups:
- Stocks and commodities
- Currencies and interest rates
At least one market from each group should ideally show a trending profile.
For example:
- Stocks may be trending while commodities consolidate
- Currencies may be trending while interest rates consolidate
This condition suggests that the broader market is beginning to deliver directionally rather than remaining balanced.
When several asset classes are moving with clear intent, individual swing trades have a better chance of producing sustained price expansion.
Use Intermarket Analysis for Confirmation
Intermarket analysis helps determine whether other markets support the trade idea.
A market should not be analysed completely in isolation. Related and inversely correlated markets can reveal whether the expected direction is supported by broader capital flows.
Bullish U.S. Dollar Example
When the U.S. Dollar Index is expected to rise, traders may look for:
- Commodities trading from resistance
- Commodities failing to form higher highs
- False breakouts above commodity highs
- Commodity lows being broken easily
- EUR/USD, GBP/USD, AUD/USD, and NZD/USD trading from resistance
- Foreign currencies struggling to sustain rallies
These conditions support the idea that the dollar is strengthening.
Bearish U.S. Dollar Example
When the dollar is expected to weaken, traders may look for:
- Commodities breaking old highs
- Commodity lows acting as strong support
- False breaks below commodity lows
- EUR/USD, GBP/USD, AUD/USD, and NZD/USD holding support
- Foreign currencies breaking highs more easily
The greater the confirmation across related markets, the more confidence the trader can have in the directional idea.
The purpose of intermarket analysis is not to add unnecessary complexity. It is to determine whether the market being traded is aligned with broader market behaviour.
Study COT Hedging Program Alignment
The Commitment of Traders report can help traders understand how commercial participants are positioning.
ICT focuses on commercial activity over the previous 12 months.
The process involves:
- Finding the highest commercial net position during the last 12 months
- Finding the lowest commercial net position during the same period
- Dividing that range in half
- Using the midpoint as an adjusted bullish or bearish reference
This adjusted midpoint is more useful than simply judging whether commercials are above or below the standard zero line.
Commercial traders may remain net short for long periods because of the nature of their business. However, their positioning can still become relatively bullish when they reduce shorts or move toward the upper portion of their 12-month range.
The important question is:
- Are commercials becoming more bullish?
- Are commercials becoming more bearish?
If commercial positioning supports the expected direction, the probability of an explosive move may improve.
Use Open Interest to Track Smart Money Activity
Open interest provides additional information about how positions are being added or removed from the futures market.
It is particularly useful because this information is not directly available from the spot foreign exchange market.
Bullish Open Interest Condition
A bullish condition may appear when:
- Open interest declines significantly
- Commercial traders reduce net short positions
- The commercial positioning line moves higher
- The broader analysis supports higher prices
A decline of approximately 10% to 15% or more in open interest can indicate commercial short covering.
When commercials remove short positions, it may suggest they no longer expect lower prices and are preparing for a substantial move higher.
Bearish Open Interest Condition
A bearish condition may appear when:
- Open interest increases
- Commercial traders increase net selling
- The commercial positioning line moves lower
- The broader analysis supports lower prices
The most useful signals occur when open interest and commercial positioning confirm the same directional idea.
As Huddleston describes it, open interest provides:
“An X-ray view, if you will, of what the smart money is doing.”
Align the Trade With Seasonal Tendencies
Many markets demonstrate recurring tendencies during particular periods of the year.
Seasonality does not guarantee that price will move in the expected direction. However, it can strengthen a trade idea when it agrees with other forms of analysis.
For example, a bullish seasonal tendency becomes more meaningful when:
- The market is already positioned at higher-timeframe support
- Commercial traders are becoming more bullish
- Open interest confirms short covering
- Intermarket relationships support higher prices
- The broader asset classes are trending
When all of these conditions align, the expected move is more likely to be forceful rather than slow and uncertain.
Seasonality should therefore be treated as supporting evidence, not as an independent entry signal.
Look for Volatility Contraction
Explosive price movement is often preceded by reduced volatility.
A volatility contraction occurs when price moves from larger ranges into smaller ranges.
This can appear as:
- An inside candle
- An inside bar
- The smallest range of the previous three days
- The smallest range of the previous seven days
- Several candles forming tight consolidation
- Smaller candle bodies after a large directional move
An inside candle has:
- A lower high than the previous candle
- A higher low than the previous candle
The candle’s direction is not important. It may close higher or lower.
What matters is that the market has moved into contraction.
Huddleston explains:
“It’s like that little wind-up of a spring.”
The contraction suggests that expansion is likely to follow.
However, volatility contraction alone does not reveal direction. The trader must already have a bullish or bearish expectation based on higher-timeframe analysis.
When contraction appears while all other factors support the same direction, the probability of an explosive move increases significantly.
Use Major News Headlines as Contrarian Confirmation
News headlines can provide useful insight into public sentiment.
ICT does not use headlines to predict direction. Instead, headlines are compared with the existing market analysis.
Bullish Setup
When the analysis supports higher prices, bearish headlines can strengthen the setup.
For example, if gold is positioned for a bullish move but financial media continues explaining why gold is weak, retail traders may become increasingly bearish.
This can create an attractive condition because the public may be selling at the same time institutional positioning supports higher prices.
Bearish Setup
When the analysis supports lower prices, bullish headlines may provide similar confirmation.
Examples include headlines describing:
- Historic highs
- Strong economic performance
- Continued bullish momentum
- Reasons the market should keep rising
If price is simultaneously trading into higher-timeframe resistance, this optimistic sentiment may provide fuel for a bearish reversal.
Huddleston states:
“That to me is fuel in the fire.”
The news itself does not create the setup. It helps reveal whether public sentiment is positioned against the expected move.
Measure Retail Market Sentiment
Market sentiment can help determine whether retail traders are overly bullish or bearish.
ICT uses the Williams Percent Range indicator as a simple sentiment tool.
The preferred setting is:
- 15-period Williams %R
- Daily timeframe
Rather than using the traditional overbought and oversold levels, the indicator is divided around the 50 level.
In this framework:
- Below the midpoint is considered an oversold or buying area
- Above the midpoint is considered an overbought or selling area
When the indicator is near the midpoint, the most recent extreme can be used as the guide.
For example:
- If price recently left an oversold condition and reaches the midpoint, bullish sentiment may still be favoured
- If price recently left an overbought condition and reaches the midpoint, bearish sentiment may still be favoured
This tool should not be used as a standalone entry signal. It is simply another way to measure whether retail sentiment supports or opposes the trade idea.
Combine the Eight Hallmarks
The strongest explosive swing setups generally contain several of the following factors:
- Major asset classes are trending
- Intermarket analysis confirms the direction
- COT commercial hedging supports the idea
- Open interest reveals smart money alignment
- Seasonal tendencies support the move
- Volatility is contracting before expansion
- News headlines oppose the expected direction
- Retail market sentiment is positioned incorrectly
A trade does not always require every factor.
However, the more hallmarks that align, the greater the probability that price will move aggressively rather than remain in a narrow range.
For example, a bullish setup may include:
- Commodities trending higher
- A weakening U.S. Dollar Index
- Commercials reducing short positions
- Open interest declining
- A bullish seasonal tendency
- A seven-day volatility contraction
- Bearish financial headlines
- Oversold retail sentiment
This creates a far stronger swing-trading environment than relying on a single support level or chart pattern.
A Practical Market Selection Process
The following process can help traders narrow down markets with explosive potential.
Step 1: Review the Major Asset Classes
Determine whether stocks, commodities, currencies, and interest rates are trending or consolidating.
Demand at least two trending asset classes.
Step 2: Establish a Directional Bias
Use monthly, weekly, and daily charts to determine whether the selected market should move higher or lower.
Step 3: Confirm the Idea Through Intermarket Analysis
Study related and inversely correlated markets.
The broader market should support the directional idea.
Step 4: Review Commercial Positioning
Study the previous 12 months of COT data.
Determine whether commercials are buying, selling, reducing shorts, or increasing shorts.
Step 5: Study Open Interest
Look for meaningful increases or decreases in open interest that confirm commercial behaviour.
Step 6: Check Seasonal Tendencies
Determine whether the time of year historically supports the expected move.
Step 7: Look for Volatility Contraction
Identify inside candles, inside bars, or the smallest range of the previous three or seven sessions.
Step 8: Review News and Sentiment
Look for headlines and retail sentiment that oppose the expected direction.
Step 9: Wait for the Entry Setup
Once the market has been selected, use the appropriate ICT entry model at a logical premium or discount array.
Explosive Swing Trade Checklist
Before selecting a market, confirm:
- At least two major asset classes are trending
- One of stocks or commodities is trending
- One of currencies or interest rates is trending
- The higher-timeframe bias is clear
- Intermarket relationships support the direction
- Commercial positioning is aligned with the trade
- Open interest confirms institutional activity
- Seasonal tendencies favour the expected move
- Volatility has contracted
- Price is positioned at a logical higher-timeframe level
- News headlines oppose the expected move
- Retail sentiment is incorrectly positioned
- A clear liquidity objective is available
- Risk and reward justify the trade
Final Thoughts
The Keys To Selecting Markets That Will Move Explosively are based on alignment.
The ICT approach does not begin with an entry pattern. It begins by determining whether the broader market environment is capable of producing a sustained directional move.
Major asset classes should be trending, intermarket relationships should confirm the bias, commercial positioning should support the idea, and open interest should reveal institutional participation.
Seasonality, volatility contraction, news headlines, and retail sentiment can then strengthen the probability of expansion.
The trader does not need to predict every market move. The objective is to patiently wait until several independent factors point toward the same market and the same direction.
When direction, positioning, timing, volatility, and sentiment all align, price has a greater probability of moving explosively.