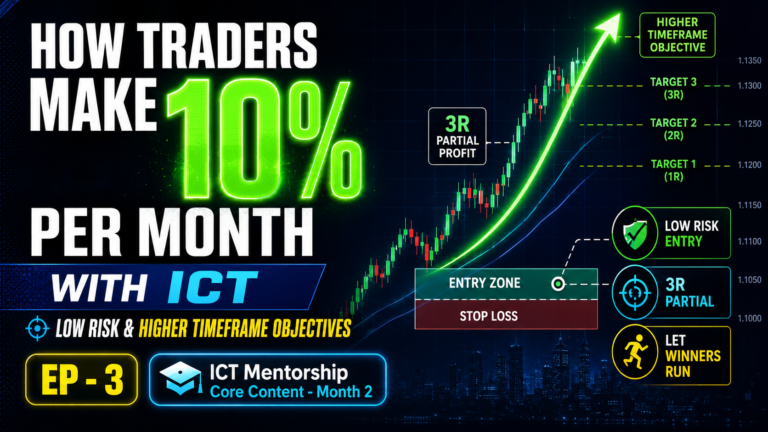
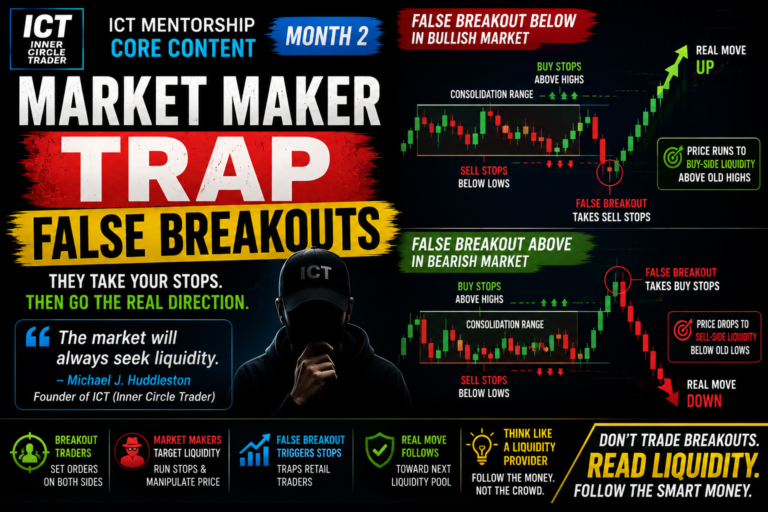
Framing Low Risk Trade Setups is an important trading concept taught by Michael J. Huddleston, the creator of ICT (Inner Circle Trader). This concept is taught in the ICT Mentorship Core Content – Month 2 and explains how traders can start with a higher timeframe trading idea, then refine the same setup on lower timeframes to reduce stop-loss distance and overall risk exposure.
The central idea is not to place an extremely tight stop randomly.
The trader first needs a valid higher timeframe reason for price to react.
Then the setup can be refined.
As Michael J. Huddleston explains:
“The conditions that lend to a trade setup on a higher time frame can be refined to a lower time frame.”
This is the foundation of Framing Low Risk Trade Setups with ICT.
What Does Framing Low Risk Trade Setups Mean?
Framing Low Risk Trade Setups means identifying a high-probability trade idea from a higher timeframe and then using lower timeframe price action to find a more precise entry.
The process can be simplified as:
Higher Timeframe Bias → Key Institutional Level → Lower Timeframe Refinement → Smaller Stop Loss
The trade idea does not begin on the 5-minute chart.
The lower timeframe is only used to refine a trading premise that already exists.
For example, a daily chart may show an important bullish order block.
Price later returns to that daily level.
The trader then moves to the 1-hour, 15-minute or 5-minute chart to study how price reacts.
A lower timeframe bullish order block may provide a more precise entry.
This can reduce the number of pips between the entry and stop loss.
Start With the Higher Timeframe
According to the ICT framework, selecting trade setups on higher timeframe charts is important when looking for high-probability opportunities.
The trader can study:
- Monthly chart
- Weekly chart
- Daily chart
These timeframes help define:
- Directional bias
- Institutional order flow
- Key support or resistance concepts
- Important price levels
- Bullish or bearish trade premise
Michael J. Huddleston explains:
“You have to look at a higher time frame chart to give you the directional bias, to give you the institutional order flow.”
The higher timeframe provides the reason for the trade.
Without a higher timeframe premise, a trader may simply be reacting to random lower timeframe price movement.
Why Higher Timeframes Matter in ICT
Higher timeframe levels can have greater influence on price.
Large market participants and institutions study markets using daily, weekly and monthly data.
Therefore, the ICT trader begins by locating price levels that align with institutional order flow.
Suppose price trades below an old low.
A trader should not automatically buy simply because sell-side liquidity was taken.
The important question is:
Why should price reverse after taking the old low?
There should be another reason.
For example, price may be trading into a daily bullish order block.
Now the setup has context.
The market has:
Old Low → Sell Stops Below Low → Price Trades Lower → Daily Bullish Order Block
This creates a higher timeframe premise for expecting potential buying.
Michael J. Huddleston explains that going below an old low alone is:
“Not enough to expect a reversal.”
The liquidity run becomes more meaningful when it occurs at an important higher timeframe level.
Higher Timeframe Setups Give More Planning Time
One advantage of higher timeframe setups is that they develop more slowly.
This provides more time to study the market.
The trader can:
- Mark important levels
- Determine directional bias
- Identify liquidity
- Calculate potential risk
- Plan the entry
- Mark profit objectives
This can also help traders who cannot watch intraday charts continuously.
A trader with a job, business or other responsibilities does not necessarily need to become a day trader.
Higher timeframe charts can still provide low-risk and high-probability trade ideas.
The trader waits for price to reach the important level and then begins the refinement process.
How ICT Reduces Risk in a Trade Setup
The risk-reduction process is based on timeframe refinement.
Suppose a daily chart identifies a bullish institutional level.
On the hourly chart, a bullish entry may require a 20-pip stop.
The trader can move to the 15-minute chart.
A more precise bullish order block may appear.
The entry can now be placed closer to the higher timeframe level.
The stop may be reduced.
The trader can then move to the 5-minute chart.
Another refined bullish order block may appear.
The same trade idea may now require a stop of less than 10 pips.
The setup progression may look like:
Daily Level → Hourly Setup = 20 Pip Stop
Daily Level → 15-Minute Refinement = 17 Pip Stop
Daily Level → 5-Minute Refinement = About 8 Pip Stop
The directional idea has not changed.
Only the precision of the entry has improved.
Transpose Higher Timeframe Levels to Lower Timeframes
An important step in Framing Low Risk Trade Setups is transferring the higher timeframe level to a lower timeframe chart.
Suppose a daily bullish order block has been identified at a specific price.
The trader marks that exact price level.
Then the trader opens the 1-hour chart.
The daily level remains visible.
Next, the trader can study the 15-minute chart.
The same daily level is still important.
Finally, the trader can move to the 5-minute chart.
The process is:
Daily Institutional Level
↓
Hourly Price Action
↓
15-Minute Refinement
↓
5-Minute Execution
Michael J. Huddleston states:
“Transposing the higher time frame levels to lower time frame charts is important.”
The lower timeframe should always be studied relative to the higher timeframe level.
Example of a Daily Bullish Order Block Setup
Consider a daily chart with a bullish order block around an important price level.
The market previously moved aggressively higher from this area.
This suggests that buying occurred from the level.
Later, price returns.
Before reaching the daily bullish order block, the market trades below an old low.
Sell stops are expected below that low.
Price drives lower.
Sell-side liquidity is taken.
Then price reaches the daily bullish order block.
The trade idea now includes:
- Daily bullish order block
- Old low
- Sell-side liquidity
- Price trading into higher timeframe support
This provides the framework for a possible long position.
The trader does not immediately buy.
The next step is lower timeframe refinement.
Refining the Setup on the Hourly Chart
On the hourly chart, the trader can study the reaction around the daily level.
Price has already traded below an old low and entered the daily bullish order block.
A bullish order block may form on the hourly chart.
The trader can use the appropriate portion of the down candle before bullish price expansion.
An hourly entry may provide a valid trade.
However, the stop-loss distance may still be relatively large.
For example:
Entry → 20 Pip Stop Loss
The trade may still be acceptable.
But ICT teaches that the setup can sometimes be refined further.
The trader moves to a lower timeframe.
Refining the Trade on the 15-Minute Chart
The same price action can be studied on the 15-minute chart.
Nothing about the higher timeframe trading premise changes.
The trader still has:
- Daily bullish order block
- Sell-side liquidity run
- Bullish expectation
But the 15-minute chart provides more price detail.
A smaller bullish order block may become visible near the daily level.
If price trades through the relevant down candle and confirms the bullish order block, the trader can focus on a lower entry.
Instead of buying at the hourly entry price, the trader may enter closer to the daily institutional level.
The stop-loss distance may reduce from 20 pips to approximately 17 pips.
This provides lower exposure while maintaining the same general market objective.
Refining the Entry on the 5-Minute Chart
The refinement process can continue to the 5-minute chart.
The trader studies the exact price action occurring around the daily bullish order block.
A small down candle may form as price reaches the higher timeframe level.
Price then trades through that candle.
This can create a lower timeframe bullish order block.
The trader may now use the lower timeframe order block to frame the entry.
The stop can remain below the important low.
Because the entry is closer to the invalidation point, the stop-loss distance can become very small.
In the example taught by ICT, the risk can be refined to approximately 8 pips.
Michael J. Huddleston explains:
“You don’t have to have big super wide stops.”
However, the trader must understand why price should react at the level.
A tight stop without a valid price-action premise is not a low-risk setup.
It is simply a random tight stop.
Low Risk Does Not Mean Random Tight Stop Loss
This is one of the most important rules in Framing Low Risk Trade Setups.
A trader should not open a random 5-minute chart and place a 5-pip or 8-pip stop.
The small stop is only justified because the setup began with a higher timeframe premise.
The logic is:
Daily Bullish Order Block
↓
Sell-Side Liquidity Taken
↓
Price Reaches Daily Level
↓
Lower Timeframe Bullish Order Block Forms
↓
Refined Long Entry
↓
Small Stop Below Invalidation
The trader understands what price should do.
If the bullish setup is valid, price should move higher from the institutional level.
If price continues aggressively lower through the invalidation area, the trading idea may be incorrect.
This allows the stop to be framed logically.
Framing Low Risk Trade Setups Improves Reward-to-Risk
One of the major advantages of lower timeframe refinement is improved reward-to-risk.
Suppose the hourly setup uses a 20-pip stop.
The market has to move 60 pips to provide a 3R return.
Now suppose the same trading premise is refined to an 8-pip stop.
Price only needs to move 24 pips to provide 3R.
The calculation is:
8 Pip Risk × 3 = 24 Pip Reward
This means price can reach a 3:1 reward-to-risk ratio before reaching some of the larger higher timeframe liquidity targets.
Michael J. Huddleston explains:
“We’re getting a 3 to 1 reward ratio.”
This is why entry precision can be important.
The trader is not changing the expected direction.
The trader is reducing the distance between the entry and the logical invalidation point.
Use Lower Timeframe Liquidity as Initial Objectives
After executing on a lower timeframe, the trader can also study liquidity on that execution timeframe.
Suppose a long position is entered on the 5-minute chart.
Above price, there may be an old 5-minute high.
Buy stops may rest above that high.
This can provide an initial objective.
The trader can measure reward multiples relative to the small stop.
For example:
Entry → 8 Pip Risk
8 Pips Higher = 1R
16 Pips Higher = 2R
24 Pips Higher = 3R
Price may reach 3R before the larger hourly buy-side liquidity target is taken.
This gives the trader several possibilities for trade management.
The lower timeframe can help frame early reward multiples.
The higher timeframe can still provide the larger market objective.
Higher Timeframe Target, Lower Timeframe Entry
The complete ICT model can be summarized as:
Higher Timeframe Determines Why
Lower Timeframe Determines Where
The daily chart tells the trader why a bullish or bearish reaction may occur.
The hourly chart provides additional price structure.
The 15-minute or 5-minute chart can provide a precise entry.
The higher timeframe liquidity may remain the final target.
For a bullish setup:
Daily Bullish Level → Lower Timeframe Buy Entry → Buy-Side Liquidity Target
For a bearish setup:
Daily Bearish Level → Lower Timeframe Sell Entry → Sell-Side Liquidity Target
This allows the trader to combine a larger price objective with smaller risk exposure.
Simple ICT Model for Framing Low Risk Trade Setups
A bullish Framing Low Risk Trade Setups model may look like this:
1. Determine Higher Timeframe Direction
Study the monthly, weekly or daily chart.
Identify institutional order flow.
2. Mark a Higher Timeframe Price Level
Look for an important institutional price level such as a daily order block.
3. Identify Nearby Liquidity
Find old highs, old lows, equal highs or equal lows.
4. Wait for Price to Reach the Level
Do not chase price before the higher timeframe setup develops.
5. Move to a Lower Timeframe
Study the hourly, 15-minute or 5-minute chart.
6. Look for Lower Timeframe Confirmation
Identify an order block or price-action development supporting the higher timeframe premise.
7. Refine the Entry
Enter closer to the important institutional level.
8. Place the Stop at Logical Invalidation
The stop should be based on what price should not do if the setup is correct.
9. Measure Reward Multiples
Calculate 1R, 2R and 3R from the refined risk.
10. Target Logical Liquidity
Use short-term and higher timeframe liquidity as potential profit objectives.
Common Mistakes When Framing Low Risk Trade Setups
The first mistake is starting on the 5-minute chart.
The lower timeframe should refine a higher timeframe setup.
The second mistake is buying only because an old low was taken.
A liquidity run alone may not provide enough reason for reversal.
The third mistake is using a tight stop without understanding price action.
Small stop loss does not automatically mean low risk.
The fourth mistake is ignoring institutional order flow.
The trade should align with the higher timeframe premise.
The fifth mistake is refining the timeframe too early.
Price should first approach the important higher timeframe level.
The sixth mistake is forgetting the larger target.
A lower timeframe entry can still target higher timeframe liquidity.
Final Thoughts on Framing Low Risk Trade Setups
Framing Low Risk Trade Setups with ICT (Inner Circle Trader) is based on combining higher timeframe analysis with lower timeframe entry precision.
Michael J. Huddleston teaches traders to begin with the monthly, weekly or daily chart to understand directional bias and institutional order flow.
The trader then identifies a higher timeframe price level where a trade setup may develop.
Once price reaches the level, the same setup can be refined on the hourly, 15-minute or 5-minute chart.
The main process is:
Higher Timeframe Premise → Liquidity → Institutional Level → Lower Timeframe Refinement → Smaller Stop → Improved Reward-to-Risk
The key is not simply finding the smallest possible stop.
The trader must first understand why price should react at a specific level.
When the higher timeframe trading premise is valid and lower timeframe price action supports the idea, the trader may be able to enter closer to the institutional level, reduce risk exposure and frame a more favorable reward-to-risk setup.