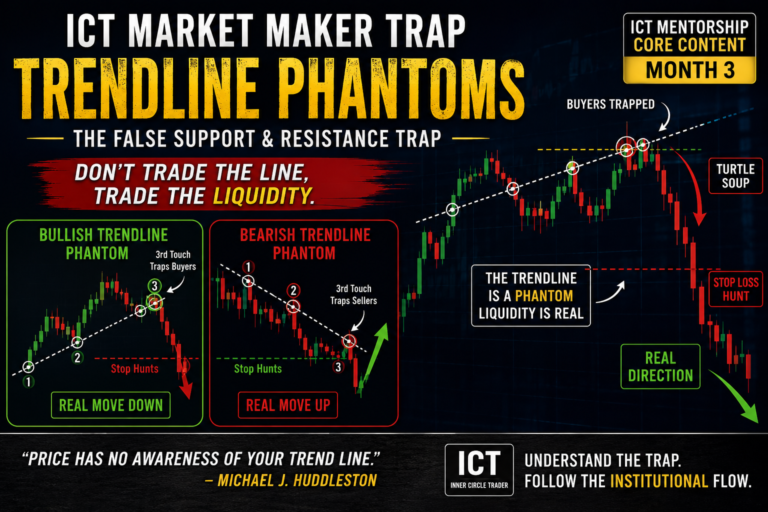
The ICT Market Maker Trap Head Shoulders Pattern concept is an important price action framework taught by Michael J. Huddleston, the founder of ICT (Inner Circle Trader). This concept is taught in ICT Mentorship Core Content – Month 3 and explains how classical Head and Shoulders patterns can become false tops or false bottoms when the higher timeframe Institutional Order Flow supports the opposite direction.
Retail traders are commonly taught to see a Head and Shoulders pattern as bearish and an Inverted Head and Shoulders pattern as bullish.
ICT does not automatically accept that interpretation.
The first question is not:
Is there a Head and Shoulders pattern?
The first question is:
What does the higher timeframe indicate price should do?
When the higher timeframe is bullish but a lower timeframe Head and Shoulders appears, the bearish pattern may become a retail trap.
When the higher timeframe is bearish but an Inverted Head and Shoulders appears, the bullish pattern may also become a trap.
As Michael J. Huddleston explains:
“You look for the pattern because retail will look for the pattern, but you’re going to fade that pattern based on what you see on the higher time frames.”
This is the main idea behind the ICT Market Maker Trap Head Shoulders Pattern concept.
What is the ICT Market Maker Trap Head Shoulders Pattern Concept?
The ICT Market Maker Trap Head Shoulders Pattern concept teaches traders how classical chart patterns can create predictable pools of retail liquidity.
Retail traders see the pattern.
They anticipate a breakout.
They enter around the neckline.
They place stop losses around obvious highs or lows.
ICT studies those orders as liquidity.
The pattern itself is not necessarily the trade signal.
The trader must first understand:
- Higher timeframe Institutional Order Flow
- Bullish or bearish order blocks
- Fair Value Gaps
- Liquidity objectives
- Buy-side and sell-side liquidity
If the higher timeframe supports the opposite direction of the classical pattern, ICT may treat the pattern as a Market Maker Trap.
Understanding the Classical Head and Shoulders Pattern
A traditional Head and Shoulders pattern is considered a bearish reversal formation.
The pattern generally forms with three price peaks.
The first peak is the left shoulder.
Price retraces.
The second peak trades higher and forms the head.
Price retraces again.
The third peak forms below the head and creates the right shoulder.
The lows between these price peaks are used to define the neckline.
Traditional technical analysis expects price to break below the neckline.
Some traders then wait for price to retrace to the neckline and sell.
The classical price objective is calculated by measuring the distance between the neckline and the head.
That range is projected below the neckline.
The expected sequence is:
Left shoulder
Then:
Head
Then:
Right shoulder
Then:
Neckline breakdown
Then:
Bearish continuation
This is the classical retail interpretation.
Understanding the Inverted Head and Shoulders Pattern
The Inverted Head and Shoulders is traditionally considered a bullish reversal pattern.
The pattern begins with a short-term low.
This forms the left shoulder.
Price rallies and then creates a lower low.
This lower low becomes the head.
Price rallies again and later creates a higher low.
The higher low forms the right shoulder.
The highs between these lows define the neckline.
Traditional traders wait for price to break above the neckline.
The expected sequence is:
Left shoulder
Then:
Lower low or head
Then:
Right shoulder
Then:
Neckline breakout
Then:
Bullish continuation
The distance between the neckline and the head may be projected above the neckline to estimate an upside target.
ICT understands these classical interpretations because retail traders use them.
However, ICT does not trade the pattern without higher timeframe context.
Why Head and Shoulders Patterns Can Become Retail Traps
The problem begins when traders force classical patterns onto lower timeframe charts.
A Head and Shoulders pattern can genuinely develop around an important intermediate or long-term market high.
An Inverted Head and Shoulders may genuinely form around an intermediate or long-term market low.
But retail traders often search for the same formations everywhere.
A trader learns the Head and Shoulders pattern from a textbook.
Then every sequence of three highs begins to look like a market top.
The trader becomes emotionally attached to the pattern.
A lower timeframe Head and Shoulders may form while price is trading from a significant Daily bullish order block.
Retail traders see a top.
Higher timeframe Institutional Order Flow indicates higher prices.
The pattern may therefore become a false top.
The opposite can happen with an Inverted Head and Shoulders.
The pattern may appear bullish while price is trading inside a higher timeframe bearish condition.
The apparent bottom becomes a false bottom.
Higher Timeframe Institutional Order Flow Comes First
The ICT Market Maker Trap Head Shoulders Pattern concept should always begin with higher timeframe analysis.
The trader first determines whether price is likely to move higher or lower.
For a bullish setup, the Daily Chart may show:
- Bullish order block
- Fair Value Gap support
- Institutional buying
- Sell-side liquidity already taken
- Higher price objective
If the Daily Chart supports higher prices, a bearish Head and Shoulders pattern on the hourly chart may be treated with suspicion.
For a bearish setup, the Daily Chart may show:
- Bearish order block
- Breaker
- Buy-side liquidity already taken
- Closed liquidity void
- Lower price objective
If the Daily Chart supports lower prices, a bullish Inverted Head and Shoulders on the lower timeframe may become a trap.
The chart pattern never overrides the higher timeframe narrative simply because it looks visually perfect.
False Head and Shoulders Top in a Bullish Market
Suppose the Daily Chart indicates bullish Institutional Order Flow.
Price trades into a Daily bullish order block.
The trader expects price to expand higher.
On the hourly chart, price creates:
A high
Then:
A higher high
Then:
A lower high
The formation looks exactly like a Head and Shoulders pattern.
Two relatively equal lows form around the neckline.
Retail traders expect bearishness.
When price trades below the neckline, they sell.
ICT sees the same price action differently.
The Daily Chart is bullish.
The equal lows around the neckline contain sell-side liquidity.
The move below the neckline may simply be taking sell stops.
Instead of seeing a bearish breakdown, the ICT trader may see a Turtle Soup long setup.
Neckline Breakdown as a Sell-Side Liquidity Run
This is one of the most important parts of the ICT Market Maker Trap Head Shoulders Pattern concept.
In a classical Head and Shoulders pattern, the neckline breakdown confirms the bearish setup.
In a bullish ICT framework, that same breakdown may be the trap.
The lows forming the neckline can appear very clean.
Long traders may have protective sell stops below them.
Head and Shoulders traders may use sell-stop entries below the neckline.
When price trades below the clean lows, a large amount of sell-side liquidity can enter the marketplace.
ICT may look to buy into those sell stops.
The sequence becomes:
Higher timeframe bullish condition
Then:
Lower timeframe Head and Shoulders forms
Then:
Retail expects a bearish neckline break
Then:
Price trades below equal lows
Then:
Sell-side liquidity is taken
Then:
ICT looks for a bullish Turtle Soup
Then:
Price expands higher
The bearish pattern becomes a Market Maker Trap.
Why ICT Buys Below the Head and Shoulders Neckline
Retail traders see the neckline breakdown as proof that price should continue lower.
ICT asks another question.
Who is selling below the neckline?
There may be two groups of traders.
The first group includes existing long traders with protective sell stops below the lows.
The second group includes bearish breakout traders entering short positions below the neckline.
Both create selling interest.
If the higher timeframe Institutional Order Flow is bullish, these sell orders can provide liquidity for buying.
Huddleston explains:
“I see that as a Turtle Soup long that took out two previous lows where the clean lows were there.”
The important factor is the higher timeframe bullish condition.
The trader is not buying every broken Head and Shoulders neckline.
The sell-side liquidity run must agree with the larger institutional price narrative.
The Head Becomes a Buy-Side Liquidity Objective
After buying below the neckline in a bullish setup, ICT can use the highest peak of the Head and Shoulders pattern as a price objective.
The head is the highest high in the formation.
Above that high, buy stops may be resting.
Short traders protecting their positions may have buy stops above the head.
Breakout traders may also buy if price trades above the high.
This creates buy-side liquidity.
The ICT model can therefore be:
Buy sell-side liquidity below the neckline
Then:
Hold for higher prices
Then:
Target buy-side liquidity above the head
The Market Maker Trap moves from one liquidity pool to another.
Sell stops below the pattern provide the buying area.
Buy stops above the pattern provide a logical exit objective.
Right Shoulder as a First Profit Objective
The highest point of the pattern does not always need to be the first profit target.
ICT also gives attention to the right shoulder.
In a bullish false Head and Shoulders setup, the trader may consider taking a first partial profit around the right shoulder.
The remaining position can then be held for the head or highest high.
The target structure may be:
Entry below neckline liquidity
Then:
First objective at right shoulder
Then:
Main objective above the head
This allows the trade to be managed around logical price reference points.
False Inverted Head and Shoulders Bottom in a Bearish Market
The opposite setup develops when the higher timeframe is bearish.
Suppose the Daily Chart indicates bearish Institutional Order Flow.
Price reaches a bearish institutional reference point.
A lower timeframe Inverted Head and Shoulders pattern begins to form.
Price creates:
A low
Then:
A lower low
Then:
A higher low
Retail traders see a classical bullish bottom.
They identify the neckline above price.
When price breaks above the neckline, traders begin buying.
ICT may see the move as a run on buy-side liquidity.
If the higher timeframe remains bearish, the apparent bullish breakout can provide a selling opportunity.
Neckline Breakout as a Buy-Side Liquidity Run
In a classical Inverted Head and Shoulders setup, price trading above the neckline is considered bullish confirmation.
ICT can interpret the same movement differently.
The highs around the neckline may contain buy stops.
Existing short traders can have protective buy stops above those highs.
Bullish breakout traders may also enter with buy-stop orders above the neckline.
When price trades through the neckline, these orders create buying interest.
If higher timeframe Institutional Order Flow is bearish, the ICT trader may look to sell into those buy stops.
The sequence becomes:
Higher timeframe bearish condition
Then:
Lower timeframe Inverted Head and Shoulders forms
Then:
Retail expects bullish breakout
Then:
Price trades above the neckline
Then:
Buy-side liquidity is taken
Then:
ICT looks for a short setup
Then:
Price expands lower
The classical bullish bottom becomes a false bottom.
Why ICT Sells the Inverted Head and Shoulders Breakout
Retail traders buying above the neckline believe the market has confirmed a bullish reversal.
ICT studies who is buying into the breakout.
The buy orders above the neckline may become counterparties for institutional selling.
If Daily Institutional Order Flow already supports lower prices, there is no reason to automatically accept the lower timeframe bullish pattern.
The breakout can be used to take buy-side liquidity.
Price may briefly trade above the neckline or above the candle bodies that define the recent highs.
ICT can use the move as a bearish liquidity run.
The trader looks for price to reject the breakout and move lower.
The Head Becomes a Sell-Side Liquidity Objective
In a false Inverted Head and Shoulders setup, the head is the lowest low in the pattern.
Below that low, sell-side liquidity may exist.
After selling the buy-side liquidity above the neckline, ICT may target the lower liquidity.
The bearish model becomes:
Sell above neckline buy-side liquidity
Then:
Price rejects the bullish breakout
Then:
First objective around the right shoulder
Then:
Target sell-side liquidity below the head
The classical bullish breakout trader expects higher prices.
The ICT trader expects the breakout liquidity to support bearish price delivery.
Using Candle Bodies Around the Neckline
ICT also gives attention to candle bodies when defining liquidity areas.
The absolute wick high is not always the only important price reference.
Suppose an Inverted Head and Shoulders neckline forms around several highs.
The highest candle body may provide a more refined price level.
If price trades above this body, buy stops and breakout orders may enter.
When the higher timeframe is bearish, this price area can be studied for a sell.
The trader is not required to wait for a perfect textbook neckline.
The real focus remains:
- Where are the buy stops?
- Where are the sell stops?
- What does higher timeframe Institutional Order Flow indicate?
The visual chart pattern is secondary to liquidity.
ICT Head and Shoulders Trap Bullish Model
A bullish ICT Market Maker Trap Head Shoulders Pattern setup can be studied using the following process.
Step 1. Identify a Bullish Higher Timeframe Condition
Start with the Daily or another higher timeframe.
Look for a bullish order block or bullish Institutional Order Flow.
Step 2. Define the Higher Price Objective
Identify buy-side liquidity above price.
This may be an old high or equal highs.
Step 3. Move to a Lower Timeframe
The Head and Shoulders pattern may become visible on the hourly or another lower timeframe.
Step 4. Identify the Classical Head and Shoulders
Look for a high, higher high, and lower high.
Step 5. Mark the Neckline Lows
Pay attention to clean or relatively equal lows.
These lows may contain sell-side liquidity.
Step 6. Wait for the Neckline Liquidity Run
Price may trade below the neckline.
Do not automatically interpret the move as bearish continuation.
Step 7. Look for a Turtle Soup Long
Use the sell-side liquidity run in the context of the higher timeframe bullish condition.
Step 8. Target the Right Shoulder and Head
The right shoulder may provide a first objective.
The buy stops above the head can provide the larger objective.
ICT Inverted Head and Shoulders Trap Bearish Model
The bearish model uses the opposite process.
Step 1. Identify a Bearish Higher Timeframe Condition
Look for bearish Institutional Order Flow, a bearish order block, or a breaker.
Step 2. Define the Lower Price Objective
Identify sell-side liquidity below old lows.
Step 3. Move to a Lower Timeframe
Look for a classical Inverted Head and Shoulders formation.
Step 4. Mark the Neckline Highs
These highs may contain buy-side liquidity.
Step 5. Wait for Price to Break Above the Neckline
Retail traders may interpret the movement as a bullish breakout.
Step 6. Study the Buy-Side Liquidity Run
The breakout may trigger protective buy stops and new breakout purchases.
Step 7. Look for a Short Setup
Sell into the buy-side liquidity when the higher timeframe remains bearish.
Step 8. Target the Right Shoulder and Head
The right shoulder may provide a first profit objective.
The sell-side liquidity below the head may provide the larger objective.
Head and Shoulders Pattern vs Higher Timeframe Order Block
The higher timeframe order block can completely change the interpretation of a classical chart pattern.
Suppose a Daily bullish order block has been activated.
Price returns to the order block.
An hourly Head and Shoulders pattern forms.
A retail trader sees a bearish top.
The ICT trader sees the pattern forming inside a Daily bullish price area.
When the neckline lows are violated, sell stops become available.
The ICT trader may buy.
The Head and Shoulders pattern did not override the Daily order block.
Instead, the pattern helped create liquidity inside the higher timeframe bullish setup.
The same idea works in reverse with a Daily bearish institutional reference and an Inverted Head and Shoulders.
Head and Shoulders Pattern and Breakers
A breaker can also provide the higher timeframe bearish context for an Inverted Head and Shoulders trap.
Suppose a bullish order block was previously used to drive price through buy-side liquidity.
Price later trades below the order block.
When price returns to that area, the former bullish range may act as a bearish breaker.
On a lower timeframe, an Inverted Head and Shoulders appears.
Retail traders see a bullish bottom.
Price moves above the neckline.
But the market is simultaneously trading inside a higher timeframe bearish breaker.
ICT may use the neckline breakout as a buy-side liquidity run and look for lower prices.
The breaker gives the bearish context.
The retail pattern creates the liquidity.
Market Maker Trap Head Shoulders and Turtle Soup
Turtle Soup is central to this ICT concept.
A Head and Shoulders neckline can create clean lows.
When price trades below these lows in a bullish environment, the move can form a Turtle Soup long.
An Inverted Head and Shoulders neckline can create clean highs.
When price trades above these highs in a bearish environment, the movement can form a Turtle Soup short.
The model can be simplified as:
Bullish higher timeframe
Head and Shoulders appears.
Neckline breaks lower.
Sell-side liquidity is taken.
Turtle Soup long.
Price moves toward the head.
And:
Bearish higher timeframe
Inverted Head and Shoulders appears.
Neckline breaks higher.
Buy-side liquidity is taken.
Turtle Soup short.
Price moves toward the head.
The false chart pattern and liquidity run work together.
Why Retail Traders Become Trapped
Retail traders are trained to respond to classical chart pattern confirmation.
For a Head and Shoulders:
Break neckline = Sell
For an Inverted Head and Shoulders:
Break neckline = Buy
This makes trader behavior relatively predictable around the pattern.
Stops and breakout entries can accumulate around obvious highs and lows.
ICT is interested in this liquidity.
The Market Maker Trap occurs when the lower timeframe classical pattern suggests one direction while the higher timeframe Institutional Order Flow supports the opposite direction.
Retail traders follow the chart pattern.
ICT follows the institutional price narrative.
Do Not Fade Every Head and Shoulders Pattern
The ICT Market Maker Trap Head Shoulders Pattern concept does not mean every Head and Shoulders should be bought.
It also does not mean every Inverted Head and Shoulders should be sold.
The higher timeframe condition must support the opposite direction.
A Head and Shoulders forming at a genuine intermediate or long-term high may still precede lower prices.
An Inverted Head and Shoulders forming at a significant higher timeframe low may still precede higher prices.
The trap becomes important when the lower timeframe retail pattern conflicts with the higher timeframe Institutional Order Flow.
The analysis should always begin with higher timeframe context.
Common Mistake: Trading the Pattern Before Defining Bias
A common mistake is identifying the pattern first and creating the market bias afterward.
The trader sees a Head and Shoulders.
Now the trader becomes bearish.
The trader sees an Inverted Head and Shoulders.
Now the trader becomes bullish.
ICT reverses this process.
First define the higher timeframe directional expectation.
Then move into lower timeframe price action.
If a classical retail pattern forms against the higher timeframe expectation, study the liquidity around the pattern.
The process is:
Higher timeframe analysis
Then:
Institutional Order Flow
Then:
Liquidity objective
Then:
Lower timeframe classical pattern
Then:
Market Maker Trap setup
The pattern does not determine the bias.
The higher timeframe determines how the pattern is interpreted.
Final Thoughts
The ICT Market Maker Trap Head Shoulders Pattern concept teaches traders how a classical Head and Shoulders or Inverted Head and Shoulders pattern can become a false top or false bottom.
A Head and Shoulders pattern is not automatically bearish.
When higher timeframe Institutional Order Flow is bullish, the neckline breakdown may simply take sell-side liquidity.
ICT can study the move as a Turtle Soup long and target the right shoulder or buy-side liquidity above the head.
An Inverted Head and Shoulders pattern is not automatically bullish.
When higher timeframe Institutional Order Flow is bearish, the neckline breakout may simply take buy-side liquidity.
ICT can study the breakout as a selling opportunity and target the right shoulder or sell-side liquidity below the head.
Michael J. Huddleston explains the core idea clearly:
“We should be looking for reasons to be selling, not buying.”
The direction comes from the higher timeframe institutional narrative.
The classical chart pattern shows how retail traders may be positioned.
The neckline identifies potential liquidity.
The liquidity run provides the setup.
That is the real purpose of the ICT Market Maker Trap Head Shoulders Pattern concept: use higher timeframe Institutional Order Flow to identify when a familiar retail chart pattern may be trapping traders on the wrong side of price.