The ICT NDOG – New Day Opening Gap is an important price-delivery concept taught by Michael J. Huddleston, founder of the ICT, or Inner Circle Trader, methodology. The concept was covered in the 2023 ICT Mentorship and developed further in the 2024 Lecture Series, where ICT explained how New Day Opening Gaps can be used to identify directional bias, locate potential price magnets and anticipate where liquidity may be engineered.
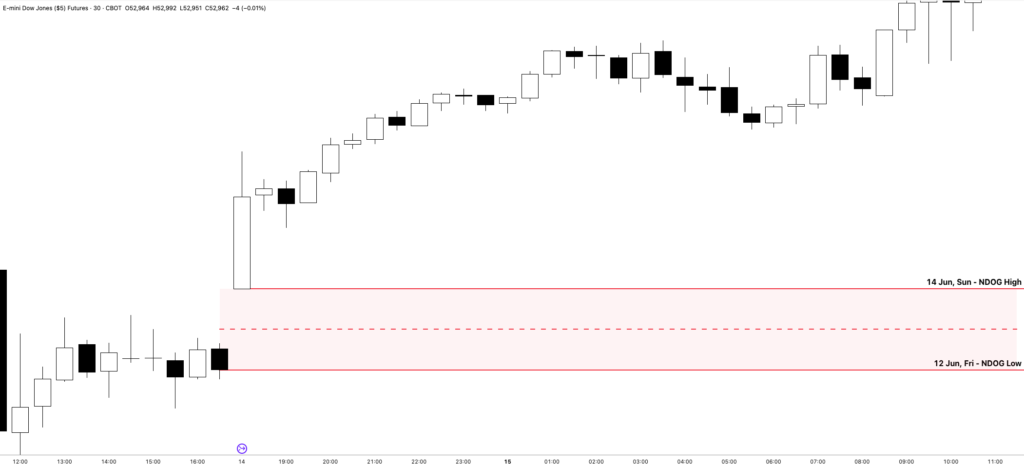
An NDOG is formed by the difference between the previous futures trading session’s closing price at 17:00 New York time and the opening price of the next session at 18:00 New York time.
Although it looks like a simple gap between two prices, ICT treats it as an algorithmic reference. Its high, low, midpoint and quadrant levels may continue influencing price for several trading days.
What Is ICT NDOG?
NDOG stands for New Day Opening Gap.
It is the price range between:
- The previous futures session’s closing price at 17:00 New York time
- The new futures session’s opening price at 18:00 New York time
US index futures pause for one hour each trading day. Trading stops at 17:00 and resumes at 18:00 New York time.
When the new session opens at a different price from where the previous session closed, the difference between those two prices creates the New Day Opening Gap.
Michael J. Huddleston explains:
“The opening price is the very first tick or traded price. That’s not random.”
ICT also teaches that the previous closing price is not random. Both prices are deliberately offered to the market and may become important reference points for future price delivery.
The NDOG can later act as:
- A draw on price
- Support or resistance
- A retracement target
- A profit objective
- A directional-bias reference
- A confluence level with another ICT PD Array
The NDOG should not be treated as an automatic entry signal. It works best when it supports a market narrative already established through liquidity, market structure, time of day and higher-time-frame analysis.
When Does the New Day Opening Gap Form?
The New Day Opening Gap forms during the daily futures-market maintenance break.
The relevant times are:
- 17:00 New York time: Previous session closes
- 18:00 New York time: New session opens
On a one-minute chart, the exact closing price is normally taken from the close of the 16:59 candle. That candle finishes when the market pauses at 17:00.
The opening price is taken from the exact open of the first candle at 18:00.
The gap created at 18:00 belongs to the following trading day.
For example, the gap that forms when the market reopens at 18:00 on Tuesday evening is generally used as Wednesday’s New Day Opening Gap.
This is because the futures session beginning Tuesday evening represents Wednesday’s trading session.
Which Days Produce an NDOG?
A New Day Opening Gap can form during the normal trading week between consecutive futures sessions.
The usual sequence is:
- Monday evening opening for Tuesday’s trading
- Tuesday evening opening for Wednesday’s trading
- Wednesday evening opening for Thursday’s trading
- Thursday evening opening for Friday’s trading
The gap between Friday’s close and Sunday evening’s opening is normally classified as a New Week Opening Gap, or NWOG, rather than a standard NDOG.
Therefore, traders should not confuse the Sunday opening gap with the daily gaps formed during the week.
New Day Opening Gap Higher and Lower
The NDOG can form above or below the previous closing price.
New Day Opening Gap Higher
An NDOG higher forms when the 18:00 opening price is above the previous 17:00 closing price.
For example:
- Previous closing price: 20,000
- New opening price: 20,010
The market opens 10 points higher.
The previous closing price becomes the lower boundary of the gap, while the new opening price becomes the upper boundary.
Price may later retrace lower into the gap to reprice part or all of the range.
New Day Opening Gap Lower
An NDOG lower forms when the 18:00 opening price is below the previous 17:00 closing price.
For example:
- Previous closing price: 20,000
- New opening price: 19,990
The market opens 10 points lower.
The new opening price becomes the lower boundary, while the previous closing price becomes the upper boundary.
Price may later rally into the gap to rebalance the skipped range.
Opening higher does not automatically make the market bearish, and opening lower does not automatically make it bullish. The position of the gap only determines how it should be drawn and where its internal levels are located.
How to Draw ICT NDOG
The New Day Opening Gap should be drawn precisely. Using the wrong candle or session time creates inaccurate levels.
Set the chart to New York time
Use New York local time so that the 17:00 close and 18:00 opening are displayed correctly.
Using a fixed GMT conversion can create problems when daylight-saving time changes.
Use a one-minute chart
The one-minute timeframe makes it easier to identify the exact closing and opening prices.
Larger timeframes may hide the precise price required to construct the gap.
Mark the previous closing price
Locate the final one-minute candle before the futures market pauses.
This is normally the 16:59 candle.
Mark its closing price with a horizontal line.
Mark the new opening price
Locate the first candle when trading resumes at 18:00.
Mark the exact opening price of that candle.
Do not use the candle’s high, low or closing price.
Draw the gap
Draw a rectangle between the previous close and the new open.
Extend the range forward through future trading sessions.
The higher price is the NDOG high, and the lower price is the NDOG low.
Mark Consequent Encroachment
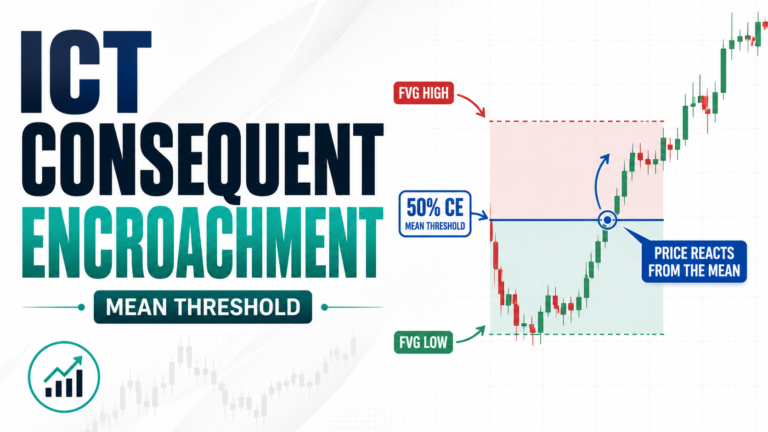
The midpoint of the New Day Opening Gap is called Consequent Encroachment, commonly abbreviated as CE.
The calculation is:
NDOG CE = (NDOG high + NDOG low) ÷ 2
Suppose the gap high is 20,020 and the gap low is 20,000.
The Consequent Encroachment is:
(20,020 + 20,000) ÷ 2 = 20,010
Consequent Encroachment is one of the most important levels inside an NDOG. Price may gravitate around it, reject from it or use it as an intermediate target.
Mark the quadrant levels
The NDOG can be divided into four equal sections.
The main levels are:
- NDOG high
- 75% upper quadrant
- 50% Consequent Encroachment
- 25% lower quadrant
- NDOG low
These internal levels help traders study how deeply price is willing to reprice the gap.
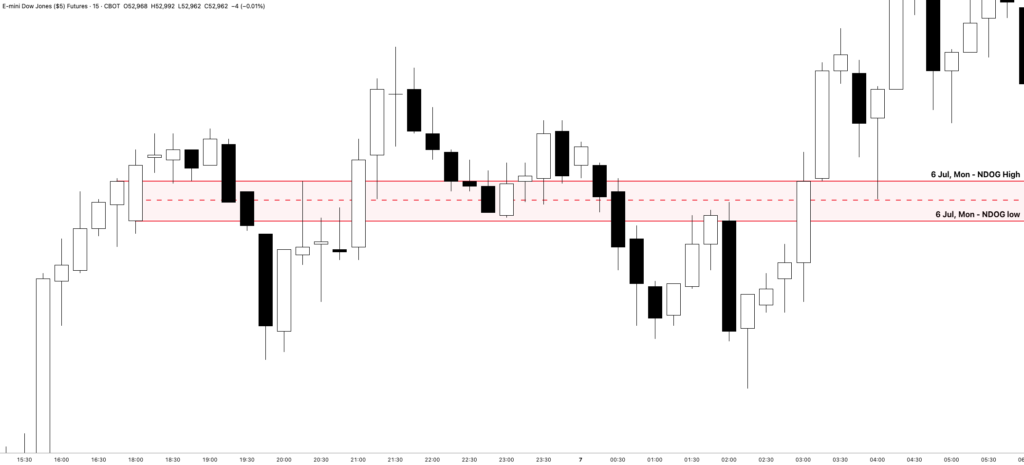
Price may react at a quadrant without completing a full gap fill.
Meaningful and Insignificant NDOGs
A New Day Opening Gap does not always form with enough separation to be useful.
Sometimes the new opening price is only one or two ticks away from the previous closing price. Although price may still respect those levels, such a small gap may not provide a practical trading range.
ICT generally prefers a clearly visible separation between the two prices.
There is no universal minimum size that applies to every market. However, the gap should preferably be larger than approximately one handle when studying index futures.
The importance of the gap depends on:
- The instrument being traded
- Current volatility
- The size of the gap
- Nearby liquidity
- Other overlapping PD Arrays
- Whether the gap has already been heavily traded through
A meaningful NDOG should be easy to identify without forcing the measurement.
The Five-Day Lifecycle of an NDOG
One of the most important rules is the expected lifecycle of the gap.
Michael J. Huddleston states:
“New Day Opening Gaps have a life cycle of five days.”
A rule-based trader can continue using an NDOG for five trading days after it forms.
Suppose an NDOG forms Tuesday evening for Wednesday’s session.
Its lifecycle would be counted as:
- Wednesday: Day one
- Thursday: Day two
- Friday: Day three
- Monday: Day four
- Tuesday: Day five
Under this framework, the gap remains an active reference until the following Wednesday session begins.
If a market holiday occurs, the non-trading day is skipped and an additional trading day is added to complete the five-day lifecycle.
This five-day rule helps traders avoid covering their chart with too many old levels.
Older NDOGs can still influence price, especially when they have remained largely untouched. However, using the most recent five provides a practical starting framework.
Experienced traders may maintain a separate journal containing older NDOG levels and refer to them when price returns near those ranges.
Does an NDOG Become Invalid After It Is Filled?
A common mistake is assuming that an NDOG loses all importance once price fills the gap.
A complete gap fill means price has traded from one boundary to the opposite boundary. However, the NDOG high, low, midpoint and quadrants may continue influencing price throughout its lifecycle.
After the gap is filled, its levels may still act as:
- Support
- Resistance
- Consolidation points
- Retracement levels
- Entry confluence
- Profit targets
Price may repeatedly move around Consequent Encroachment even after the original inefficiency has been repriced.
The gap should therefore remain marked for its intended lifecycle rather than being deleted immediately after the first fill.
How NDOG Acts as Support and Resistance
The NDOG boundaries may produce repeated reactions.
Price approaching the NDOG high from below may find resistance.
Price approaching the NDOG low from above may find support.
However, ICT does not recommend treating these levels as blind support and resistance.
The best reactions usually occur when an NDOG overlaps with another technical reference, such as:
- Fair Value Gap
- Order Block
- Breaker Block
- Optimal Trade Entry
- Previous session liquidity
- New Week Opening Gap
- Higher-time-frame PD Array
- Premium or discount range
For example, an NDOG low may align with a bullish Fair Value Gap and a Breaker Block. The combination provides a stronger bullish reference than the NDOG alone.
Candle Bodies and Wicks Around NDOG
Price can wick through an NDOG level without invalidating it.
ICT explains this principle with the statement:
“The wicks do the damage, but the body tells the story.”
A wick through the NDOG high or low may be used to take liquidity.
The closing bodies of the candles show whether price is accepting or rejecting the level.
If candle bodies repeatedly close above the NDOG high, the market may be accepting higher prices.
If wicks trade below the NDOG low but candle bodies refuse to close below it, the level may still be functioning as support.
Traders should therefore study:
- Where candle bodies close
- Whether price displaces away from the level
- Whether repeated closes occur inside the gap
- Whether the level causes rejection or consolidation
A single wick should not be interpreted without considering the following price delivery.
Using NDOG as a Draw on Price
Unfilled or lightly traded NDOGs can act like magnets.
When price trades near an NDOG, the algorithm may return to:
- NDOG high
- Upper quadrant
- Consequent Encroachment
- Lower quadrant
- NDOG low
The exact target depends on where price is located and the directional narrative.
If price is below an untouched NDOG and the market is expected to move higher, the NDOG low may be the first target. Consequent Encroachment or the gap high may become the next objective.
If price is above an untouched NDOG and the market is expected to move lower, the NDOG high may be the first objective.
A trader should not assume that price will completely fill the gap. Price may only trade into the nearest quadrant before continuing in the original direction.
Using NDOG to Determine Directional Bias
The 2024 teaching expands the concept by using multiple New Day Opening Gaps as directional reference points.
The trader reviews the most recent five NDOGs and observes where they are located relative to current price.
If several untouched or lightly traded NDOGs are above current price, the market may have a greater probability of gravitating higher.
If several NDOGs are below current price, the market may have a stronger draw lower.
This can be described as NDOG clustering.
NDOG cluster above price
Suppose three recent NDOGs are positioned above current market price while only one is below.
The cluster above may act as a larger collection of inefficiencies that attracts price higher.
This does not mean the trader should immediately buy.
Price may first move lower to take sell-side liquidity before expanding toward the gaps above.
NDOG cluster below price
Suppose most of the recent NDOGs are below current price.
The cluster below may create a stronger downward draw.
Price may first run buy-side liquidity before reversing lower toward those gaps.
The clustering method is a directional filter. It is not a guaranteed prediction and should not replace higher-time-frame analysis.
NDOG and Engineering Liquidity
One of the most valuable uses of ICT NDOG is anticipating how liquidity may be created before price moves toward the larger objective.
Suppose several NDOGs are located below the market.
After 07:00 New York time, price may create relative equal highs. These highs encourage traders to buy a breakout or place short stops above them.
Price may then run above those highs, take the buy-side liquidity and reverse toward the NDOG cluster below.
The relative equal highs were engineered to provide liquidity for the larger move.
The same logic works in reverse.
When NDOGs are clustered above the market, price may form relative equal lows, sweep beneath them and then expand higher toward the gaps.
The NDOG provides the larger destination. The equal highs or lows provide the liquidity required to initiate the move.
Using the 07:00, 08:00 and 09:00 Time Intervals
ICT teaches traders to pay attention to price action following the top of the hour at:
- 07:00 New York time
- 08:00 New York time
- 09:00 New York time
During the 30 minutes following these intervals, price may move in the opposite direction of the eventual session expansion.
The trader studies whether price forms:
- Relative equal highs
- Relative equal lows
- Smooth short-term liquidity
- A false breakout
- A Judas Swing
Suppose the major NDOG draw is below current price.
Instead of selling immediately at 07:00, the trader may wait for price to run above newly formed relative equal highs. After the liquidity sweep, bearish displacement can confirm the move toward the NDOG below.
The time intervals help identify when liquidity is being engineered, while the NDOG helps determine where price may ultimately move.
NDOG Repricing Trade Model
A New Day Opening Gap repricing setup combines the gap with liquidity and displacement.
Bullish NDOG model
A bullish setup may form as follows:
- An active NDOG is located above current price.
- The higher-time-frame narrative supports higher prices.
- Price forms or attacks sell-side liquidity.
- Relative equal lows are swept.
- Bullish displacement appears.
- Price breaks a meaningful short-term high.
- A bullish Fair Value Gap forms.
- The trader enters during a retracement.
- The NDOG low becomes the first target.
- Consequent Encroachment or the NDOG high becomes the next objective.
Bearish NDOG model
A bearish setup may form as follows:
- An active NDOG is located below current price.
- The higher-time-frame narrative supports lower prices.
- Price forms or attacks buy-side liquidity.
- Relative equal highs are swept.
- Bearish displacement appears.
- Price breaks a meaningful short-term low.
- A bearish Fair Value Gap forms.
- The trader enters during a retracement.
- The NDOG high becomes the first target.
- Consequent Encroachment or the NDOG low becomes the next objective.
The NDOG provides the destination, but the entry should come from a valid ICT execution model.
Trading Inside the NDOG
Price can also provide opportunities while moving from one side of the gap to the other.
Suppose the market forms an NDOG lower and initially trades below the gap.
If price begins showing bullish delivery, the NDOG low may become the first objective.
Once price enters the gap, Consequent Encroachment may become the second target. If price accepts above CE, the NDOG high may become the final target.
This can create a simple scalp during the Asian session or another quiet trading period.
However, the trader should confirm that no stronger opposing draw is active.
A trade from one boundary to another is more reliable when:
- The gap is clearly visible
- Price has swept liquidity
- Displacement supports the direction
- No high-impact event is imminent
- The target provides sufficient reward relative to the stop
NDOG and the Economic Calendar
The economic calendar affects how price moves toward or away from New Day Opening Gaps.
When significant morning news is scheduled, the report may provide the volatility needed to attack an NDOG.
When no medium- or high-impact morning news is scheduled, the morning session may become slow, rangy or filled with false breakouts.
In that situation, the cleaner move may form during the afternoon session, especially when an economic event such as a bond auction is scheduled later in the day.
A trader should check:
- Whether morning news is scheduled
- Whether an afternoon event may create volatility
- Whether price is already near the NDOG
- Whether liquidity has been engineered before the event
- Which session is most likely to deliver the expansion
The NDOG may define the destination, but the calendar can help identify when price is likely to move toward it.
NDOG Versus NWOG
The New Day Opening Gap and New Week Opening Gap are constructed in similar ways, but they have different timeframes and importance.
An NDOG is formed between the daily 17:00 close and 18:00 reopening.
An NWOG is formed between Friday’s close and Sunday’s reopening.
The practical lifecycle also differs:
- NDOG rule-based lifecycle: Five trading days
- NWOG rule-based lifecycle: Five trading weeks
The NWOG often carries greater significance for swing trading because it represents the opening repricing of an entire new trading week.
The NDOG is generally more useful for short-term directional bias, intraday targets and daily repricing.
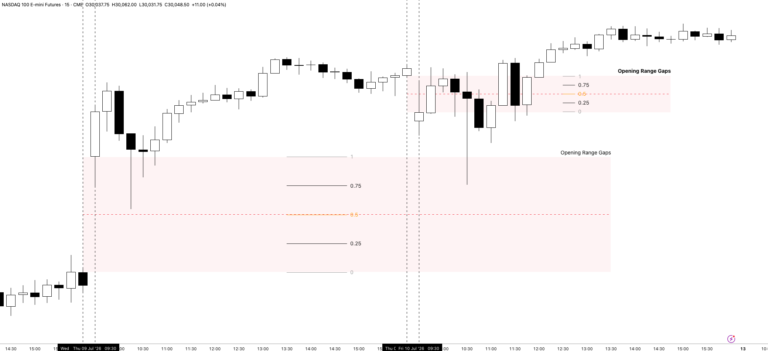
NDOG Versus Opening Range Gap
The NDOG should not be confused with the Opening Range Gap, or ORG.
The NDOG uses Electronic Trading Hours:
- Previous session close around 17:00
- New session open at 18:00
The Opening Range Gap uses Regular Trading Hours:
- Previous RTH settlement around 16:15
- Next RTH opening at 09:30
Both gaps can exist on the same trading day.
The chart setting determines which one is being studied. Electronic Trading Hours reveal the NDOG and NWOG, while Regular Trading Hours reveal the Opening Range Gap.
Important Considerations
Do not use the NDOG as a blind buy or sell signal.
The presence of a gap above price does not guarantee that the market will immediately move higher. Price may first seek liquidity in the opposite direction.
Do not keep every historical NDOG on the chart. Start with the most recent five and maintain older important gaps in a separate journal.
Do not remove an NDOG immediately after it is filled. Its boundaries and midpoint may remain sensitive for the rest of its lifecycle.
Avoid placing blind orders directly at Consequent Encroachment. Wait for confirmation through liquidity, displacement or market structure.
Consider the size of the gap. Extremely small gaps may not provide enough range for a practical setup.
Use candle bodies to judge acceptance and rejection. Wicks alone can be misleading.
Check the economic calendar before trading. The timing of scheduled events can determine when the expected repricing occurs.
Use the NDOG as confluence with an existing idea, not as a complete strategy by itself.
ICT NDOG Checklist
Before using a New Day Opening Gap, confirm:
- The chart is set to New York time
- The correct futures session is displayed
- The previous 16:59 candle close is marked
- The current 18:00 opening price is marked
- The gap has meaningful separation
- The NDOG high and low are correct
- Consequent Encroachment is marked
- The 25% and 75% quadrants are marked
- The gap is still within its five-day lifecycle
- The most recent five NDOGs have been reviewed
- Any cluster above or below price has been identified
- Higher-time-frame directional bias supports the idea
- Relevant buy-side and sell-side liquidity are marked
- Price has completed a liquidity sweep
- Displacement confirms the direction
- A Fair Value Gap or another PD Array supports entry
- The economic calendar has been checked
- The target is a realistic NDOG boundary or quadrant
- Risk is defined before entering
Final Thoughts
The ICT NDOG – New Day Opening Gap provides a structured way to study the price difference between one futures session’s close and the next session’s opening.
Its value goes beyond the gap itself.
The NDOG high, low, Consequent Encroachment and quadrant levels may guide price delivery for several trading days. Multiple NDOGs can also form clusters that help traders identify where the market may be drawn before obvious liquidity targets appear.
The strongest NDOG setups usually combine:
- A clear higher-time-frame narrative
- An active gap or cluster of gaps
- Engineered liquidity
- A Judas Swing or liquidity sweep
- Displacement
- A valid entry PD Array
- A realistic NDOG target
Used correctly, the NDOG does not tell a trader to buy or sell blindly. It provides a map showing where unfinished price delivery may attract the market and where a confirmed move may find its objective.