ICT Opening Range Gaps are important Regular Trading Hours price references used primarily in US index futures. Michael J. Huddleston, founder of the ICT, or Inner Circle Trader, methodology, introduced the Opening Range Gap repricing concept in the 2023 ICT Mentorship and expanded it with more specific rules in the 2025 Lecture Series.
An Opening Range Gap identifies the difference between the previous trading day’s Regular Trading Hours settlement price and the opening price of the next Regular Trading Hours session at 09:30 New York time.
The gap can operate as a draw on price, a support or resistance reference, a profit objective and a framework for anticipating intraday repricing. However, it should not be treated as an automatic gap-fill signal. Its effectiveness depends on the size of the gap, the higher-time-frame narrative, liquidity, economic events and the price action that develops after the New York opening.
What Are ICT Opening Range Gaps?
An ICT Opening Range Gap, commonly abbreviated as ORG, is the price range between:
- The previous trading day’s Regular Trading Hours settlement price
- The following trading day’s 09:30 New York opening price
On a one-minute chart, the settlement price is found using the closing price of the 16:14 candle. That one-minute candle completes at 16:15 New York time.
The second boundary is the opening price of the 09:30 candle on the next trading day.
Michael J. Huddleston defines the structure by explaining:
“The difference between the closing price on Friday and the opening price on the next trading day, that is the Opening Range Gap.”
Although the example refers to Friday and Monday, the same principle is used between normal consecutive trading days.
The ORG is therefore calculated as:
Previous RTH settlement price to current 09:30 RTH opening price
If both prices are the same, no meaningful Opening Range Gap exists.
Why the Opening Range Gap Is Important
US index futures trade during the overnight electronic session, but the Opening Range Gap deliberately ignores that overnight delivery.
The concept studies the gap that exists specifically in Regular Trading Hours price delivery.
When the previous session settles at one price and the next RTH session opens at another, there was no Regular Trading Hours buying or selling between those two prices. This creates what ICT describes as an actual liquidity void within the RTH chart.
This is different from a large displacement candle. Trading occurred throughout the range of a displacement candle, even if price moved rapidly. In an Opening Range Gap, no Regular Trading Hours transactions occurred between the previous settlement and the new opening price.
Price may later return to the gap and conduct what ICT describes as “patchwork,” delivering price back through levels that were previously skipped during RTH delivery.
This does not mean that every ORG must be filled immediately. Some remain open for several sessions before price returns to them.
When Does an ICT Opening Range Gap Form?
The Opening Range Gap becomes fully defined at 09:30 New York time, when the new Regular Trading Hours session opens.
Before 09:30, only the previous settlement price is known. Once the first RTH opening price prints, both boundaries of the gap can be marked.
The relevant times are:
- 16:14 New York time: Closing price of the final one-minute settlement candle
- 09:30 New York time: Opening price of the next RTH session
The concept can appear from Monday through Friday, including the gap between Friday’s settlement and Monday’s opening.
Always use New York local time. New York changes between standard time and daylight-saving time, so it is better to set the chart directly to the America/New_York timezone instead of relying on a fixed GMT conversion.
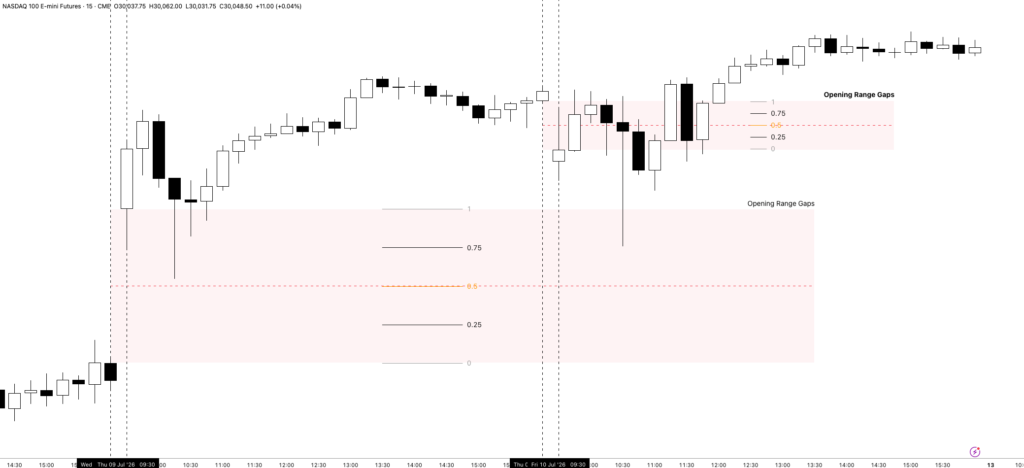
Markets Used for ICT Opening Range Gaps
The concept is primarily designed for US index futures and markets that follow the US equity Regular Trading Hours session.
Common instruments include:
- E-mini Nasdaq futures, NQ
- Micro E-mini Nasdaq futures, MNQ
- E-mini S&P 500 futures, ES
- Micro E-mini S&P 500 futures, MES
- E-mini Dow futures, YM
- Micro E-mini Dow futures, MYM
- US stocks
- Index-tracking ETFs
The concept should not be mechanically applied to spot Forex or cryptocurrency. These markets do not have the same Regular Trading Hours settlement and 09:30 cash-session opening structure.
Required Chart Settings
Correct chart settings are essential. Many traders mark the wrong gap because they use an Electronic Trading Hours chart.
Michael J. Huddleston specifically states:
“Regular trading hours needs to be toggled, not electronic trading hours.”
Use the following settings:
- Chart timeframe: One minute
- Trading session: Regular Trading Hours
- Timezone: New York
- Previous settlement reference: 16:14 candle close
- Current opening reference: 09:30 candle open
On TradingView, the session setting is normally displayed near the bottom-right corner of the chart. Confirm that RTH is selected rather than ETH.
The one-minute chart is preferred because it allows the trader to identify the exact settlement and opening prices.
Premium Opening Range Gap
A premium Opening Range Gap forms when the new 09:30 opening price is above the previous RTH settlement price.
For example:
- Previous settlement: 20,000
- Current 09:30 opening: 20,050
The market opens 50 points above the previous settlement. This creates a premium ORG.
The gap is positioned below the current opening price.
The term premium does not automatically mean the market must decline. It only classifies the direction of the gap and determines how the Fibonacci tool should be drawn.
A premium ORG may remain open while the market continues higher. Alternatively, price may first run buy-side liquidity and then reprice lower into the gap.
Discount Opening Range Gap
A discount Opening Range Gap forms when the current 09:30 opening price is below the previous RTH settlement price.
For example:
- Previous settlement: 20,000
- Current 09:30 opening: 19,950
The market opens 50 points below the settlement. This creates a discount ORG.
The gap is positioned above the current opening price.
A discount ORG does not automatically mean the market is bullish. Price may continue lower and leave the gap open. The classification simply shows that the market opened below the previous settlement.
How to Draw ICT Opening Range Gaps
The ORG can be drawn with horizontal lines, a rectangle and a Fibonacci retracement tool.
Step 1: Select Regular Trading Hours
Set the chart to RTH and confirm that the timezone is New York.
Do not identify the ORG while the chart is displaying Electronic Trading Hours.
Step 2: Find the previous settlement price
Move to the previous trading day and locate the 16:14 one-minute candle.
Mark the closing price of that candle.
This is the previous Regular Trading Hours settlement price.
Do not use:
- The candle high
- The candle low
- The 16:00 closing price
- The overnight futures opening
- The final Electronic Trading Hours candle
The required level is the closing price of the 16:14 RTH candle.
Step 3: Find the 09:30 opening price
Move to the next trading day and locate the first RTH candle at 09:30.
Mark the exact opening price of that candle.
Do not use the high, low or closing price of the 09:30 candle.
Step 4: Connect the two prices
Draw a rectangle between the previous settlement and the current 09:30 opening.
Extend the rectangle forward so that future interactions with the gap remain visible.
The higher price becomes the top of the gap, while the lower price becomes its bottom.
Step 5: Draw the Fibonacci levels
For a premium ORG, draw the Fibonacci tool upward:
- Start at the previous 16:14 settlement
- End at the current 09:30 opening
For a discount ORG, draw it downward:
- Start at the previous 16:14 settlement
- End at the current 09:30 opening
The direction matters because it keeps the upper and lower quadrants properly classified.
Important Levels Inside the Opening Range Gap
An ORG contains five useful reference levels:
- High of the gap
- Upper quadrant
- Consequent Encroachment
- Lower quadrant
- Low of the gap
The quadrant levels divide the gap into four equal sections.
Consequent Encroachment
The midpoint of the Opening Range Gap is called Consequent Encroachment, or CE.
ICT explains:
“The midpoint of that range would be Consequent Encroachment.”
The calculation is:
ORG CE = (Previous RTH settlement + Current 09:30 opening) ÷ 2
Suppose the previous settlement was 20,000 and the new opening was 20,080.
The midpoint would be:
(20,000 + 20,080) ÷ 2 = 20,040
Consequent Encroachment is often the most important internal level of the gap. Price may use it as a target, reaction point or entry reference.
The term Consequent Encroachment is used for the midpoint of a gap or wick. The midpoint of an Order Block, Breaker Block or similar candle-based PD Array is normally called its Mean Threshold.
Upper quadrant
The upper quadrant represents the upper 25% portion of the gap.
In a premium ORG, the upper quadrant is close to the current 09:30 opening.
When a premium gap is extremely large, price may only retrace into the upper quadrant before continuing higher.
Lower quadrant
The lower quadrant represents the lower 25% portion of the gap.
In a discount ORG, the lower quadrant is close to the current 09:30 opening.
When a discount gap is extremely large, price may only retrace into the lower quadrant before continuing lower.
Opening Range Gap Size Rules
The 2025 Lecture Series added a practical framework for evaluating Opening Range Gaps according to their size.
These measurements were taught primarily in the context of Nasdaq futures, where movement is commonly described in handles or index points. Traders should not assume that identical numerical thresholds apply to every instrument.
Opening Range Gaps Between 20 and 75 Handles
When an ORG measures approximately 20 to 75 handles, ICT generally looks for a reasonable probability of price reaching the midpoint of the gap.
For a premium ORG, price may first trade higher into:
- A pre-market high
- London session buy-side liquidity
- Relative equal highs
- A high formed between 06:00 and 09:30
After taking buy-side liquidity, price may reverse and reprice lower toward Consequent Encroachment.
For a discount ORG, reverse the logic. Price may first run sell-side liquidity and then reprice higher toward the midpoint.
A complete gap closure depends on the broader market narrative. Reaching CE does not guarantee that price will continue to the opposite boundary.
Opening Range Gaps Between 75 and 120 Handles
An ORG between approximately 75 and 120 handles is a less certain range.
Price may:
- Reprice to the midpoint
- Only reach the nearest quadrant
- Completely fill the gap
- Continue away and leave the gap open
In this range, the trader must rely more heavily on additional analysis, including:
- Higher-time-frame market structure
- Economic calendar
- Seasonal tendencies
- Daily and weekly liquidity
- Intermarket relationships
- Current dealing range
- Time of day
- Displacement after 09:30
ICT refers to this area as a gray zone because the gap size alone does not provide enough information.
The trader may need to wait until 10:00 rather than forcing a trade during the first 30 minutes.
Opening Range Gaps of 120 Handles or More
An ORG measuring approximately 120 handles or more is considered an extreme gap in the Nasdaq-based model discussed in the 2025 series.
When the gap is extremely large, price may continue in the direction of the opening and leave most of the gap unfilled.
For a very large premium ORG, the nearest likely retracement may only be the upper quadrant.
For a very large discount ORG, the nearest likely retracement may only be the lower quadrant.
Price can still reach Consequent Encroachment or completely close the gap, but ICT advises against automatically anticipating an immediate full rebalancing.
A large gap may remain open until later in the week or even longer before price returns to complete the repricing.
These gap-size rules are guidelines, not guarantees. They must be interpreted together with market conditions.
What Is the Opening Range Gap Repricing Macro?
The Opening Range Gap Repricing Macro is a trading framework in which price first moves toward external liquidity and then reverses toward an Opening Range Gap.
The 2023 ICT Mentorship demonstrated this idea using a bearish market narrative.
Price rallied after the 09:30 opening, ran buy-side liquidity and formed a Judas Swing. After bearish displacement and a shift in market structure, the market repriced lower toward the ORG.
ICT described the expectation directly:
“I’m going to anticipate the algorithm repricing back down into the Opening Range Gap, so this is a repricing macro.”
The Opening Range Gap provides the destination. The liquidity sweep, market structure shift and Fair Value Gap provide the setup and execution framework.
Bearish Opening Range Gap Repricing Model
A bearish ORG repricing setup can form as follows.
1. Establish a bearish narrative
Before the market opens, determine whether price is likely to seek lower liquidity.
The bearish narrative may be supported by:
- Higher-time-frame premium pricing
- An unfilled bearish Fair Value Gap
- Previous day’s low
- London session low
- Relative equal lows
- Weekly sell-side liquidity
- A bearish daily or weekly objective
Without a bearish narrative, a premium Opening Range Gap alone is not enough to justify a short.
2. Allow price to run buy-side liquidity
After 09:30, price may initially rally.
This rally may target:
- London session high
- Pre-market high
- Relative equal highs
- Previous New York session high
- Buy-side liquidity above the midnight opening price
- A higher-time-frame bearish PD Array
This initial rally can form the New York Judas Swing.
Retail traders may interpret the rally as bullish continuation, while the move is actually creating liquidity for a bearish repricing.
3. Wait for bearish displacement
After buy-side liquidity is taken, look for decisive bearish price delivery.
The move should show:
- Strong bearish displacement
- A meaningful short-term low being broken
- A bearish Fair Value Gap
- Failure to continue above the swept liquidity
The displacement indicates that the market may be transitioning from its initial manipulation into the expected directional move.
4. Enter on a retracement
A bearish Fair Value Gap created by the displacement can provide a short-entry area.
The trader may enter when price retraces into:
- Bearish FVG
- Bearish Order Block
- Breaker Block
- Rejection Block
- Premium portion of a short-term dealing range
The invalidation point should be placed beyond a technically meaningful high, not randomly inside the setup.
5. Target the Opening Range Gap
Potential downside objectives include:
- High of the ORG
- Upper quadrant
- Consequent Encroachment
- Lower quadrant
- Complete gap closure
- Sell-side liquidity below the gap
The selected target depends on the size of the ORG and the strength of the bearish narrative.
Bullish Opening Range Gap Repricing Model
The bullish model is the opposite of the bearish model.
1. Establish a bullish narrative
Look for a higher-time-frame reason for price to seek buy-side liquidity.
This may include:
- Discount pricing
- Bullish Fair Value Gap
- Previous day’s high
- London session high
- Relative equal highs
- Weekly buy-side liquidity
- Bullish daily or weekly objective
2. Allow price to run sell-side liquidity
After 09:30, price may initially decline and take:
- London session low
- Pre-market low
- Relative equal lows
- Previous New York session low
- Sell-side liquidity below the midnight opening price
This decline can form a bearish-looking Judas Swing before the market reverses higher.
3. Wait for bullish displacement
Look for strong bullish delivery that breaks a meaningful short-term high and creates a bullish Fair Value Gap.
4. Enter on a retracement
A retracement into the bullish FVG, bullish Order Block or another discount PD Array may provide the entry.
5. Target the ORG
Potential objectives include:
- Low of the ORG
- Lower quadrant
- Consequent Encroachment
- Upper quadrant
- Complete gap closure
- Buy-side liquidity above the gap
Using the ORG as a Draw on Price
One of the simplest ways to use ICT Opening Range Gaps is as a potential draw on liquidity.
Suppose the market opens with a premium ORG and the higher-time-frame narrative is bearish. If price first runs pre-market buy-side liquidity and then produces bearish displacement, the ORG midpoint may become a logical downside objective.
The sequence is not based on the belief that every gap must fill.
The logic is based on:
- Higher-time-frame bearish draw
- Initial run on buy-side liquidity
- Failure to continue higher
- Bearish displacement
- Repricing toward an inefficient RTH range
The same process works inversely for a bullish discount ORG.
Using the ORG as a Profit Target
The ORG is often more useful as a profit target than as an entry signal.
A trader may enter using:
- Fair Value Gap
- Market Structure Shift
- Change in the State of Delivery
- Silver Bullet setup
- Order Block
- Breaker Block
- SMT divergence
The ORG then provides a structured objective.
A conservative trader may take partial profit at the nearest quadrant. Another portion may be held for CE or complete gap closure.
The target should be selected before the trade rather than changed emotionally while price is moving.
Using Consequent Encroachment as an Entry Level
After price has traded through an ORG, Consequent Encroachment may continue acting as support or resistance.
For example, price may trade lower through a premium ORG and later retrace back to its midpoint. If the market remains bearish, CE may provide a secondary shorting location.
Similarly, after price trades higher through a discount ORG, its midpoint may provide support during a bullish retracement.
Do not place blind orders at CE. Look for supporting evidence such as:
- Displacement away from the midpoint
- Candle-body respect
- Fair Value Gap overlapping CE
- Liquidity sweep near the level
- SMT divergence
- Market Structure Shift
- Time-of-day alignment
Using Previous Opening Range Gaps
An ORG does not become irrelevant simply because a new trading day begins.
Previous Opening Range Gaps can remain active on the chart until price fully reprices them.
Their boundaries and quadrant levels may later act as:
- Support
- Resistance
- Draws on price
- Intraday targets
- Reversal locations
- Areas of consolidation
When price trades into an old ORG, observe how candle bodies react to:
- Gap high
- Upper quadrant
- Consequent Encroachment
- Lower quadrant
- Gap low
A previous ORG may also overlap with a new ORG, New Week Opening Gap, Fair Value Gap or another ICT PD Array. Such confluence can make the area more significant.
Opening Range Gap Versus the Opening Range
The Opening Range Gap and the Opening Range are different concepts.
The Opening Range Gap is a price range between the previous settlement and the current 09:30 open.
The Opening Range is the first 30 minutes of the New York cash session:
09:30 to 10:00 New York time
The ORG already exists at 09:30. The Opening Range describes what price does during the following 30 minutes.
The Judas Swing, liquidity raid and displacement that initiate the ORG repricing model often form during this 09:30 to 10:00 window.
Opening Range Gap Versus NDOG
The New Day Opening Gap, or NDOG, is not the same as an Opening Range Gap.
An NDOG is derived from Electronic Trading Hours and the short daily futures-market closure.
The ORG is derived only from Regular Trading Hours.
The key difference is the chart setting:
- RTH chart identifies Opening Range Gaps
- ETH chart identifies New Day and New Week Opening Gaps
Confusing these structures will lead to incorrect levels.
Opening Range Gap Versus NWOG
The New Week Opening Gap, or NWOG, is formed between Friday’s futures-market close and Sunday evening’s reopening.
It is based on the weekly Electronic Trading Hours transition.
The ORG between Friday and Monday uses Friday’s RTH settlement and Monday’s 09:30 RTH opening.
Both gaps may be present on Monday, but they are constructed from different prices and can provide separate trading levels.
How to Read Price Delivery Inside an ORG
Price behavior inside the gap can provide information about whether the gap is being rejected or accepted.
Rejection
Price enters the ORG, forms a wick and displaces away.
This may indicate that the market is not ready to trade deeper into the gap.
Acceptance
Multiple candle bodies close inside the ORG and price remains within it.
This may indicate that price is accepting the range and could continue toward the next quadrant or opposite boundary.
Consequent Encroachment respect
Price repeatedly reacts at the midpoint without closing decisively through it.
CE may be acting as short-term support or resistance.
Complete repricing
Price trades through the entire gap and reaches the opposite boundary.
The original liquidity void has been fully repriced. The gap levels may still influence price, but the gap is no longer unfilled.
Key Considerations
An ORG is not an automatic gap-fill trade
Never sell every premium gap or buy every discount gap.
Large Opening Range Gaps can remain unfilled while price continues in the direction of the opening.
Determine the higher-time-frame objective first
The daily and weekly draw on liquidity should guide whether price is expected to trade into the gap or move away from it.
Use the correct gap-size expectation
A 30-handle ORG should not be treated the same as a 150-handle ORG.
Smaller gaps have a better chance of reaching CE, while extremely large gaps may only retrace into the nearest quadrant.
Watch the economic calendar
High-impact reports can cause aggressive repricing and invalidate normal intraday expectations.
Important events include:
- CPI
- NFP
- FOMC
- PPI
- GDP
- Interest-rate decisions
- Major earnings announcements
Wait for liquidity to be taken
The most useful ORG setups often appear after price first takes London, pre-market or previous-session liquidity.
Require displacement
A liquidity sweep without displacement is not enough. Price must show evidence that delivery has changed.
Use candle bodies
Observe how candle bodies interact with the ORG boundaries and midpoint. Repeated body closes through a level are more meaningful than a single wick.
Consider time of day
The most important repricing may occur during:
- 09:30 to 10:00 opening range
- New York morning session
- New York lunch reversal
- 15:15 to 15:45 Market on Close period
An ORG target may remain active throughout the session even if price does not reach it immediately after the opening.
Common Mistakes
The most common mistake is drawing the ORG on an Electronic Trading Hours chart.
Another mistake is using the wrong settlement candle. On the one-minute RTH chart, the required settlement reference is the closing price of the 16:14 candle.
Some traders use the high or low of the 09:30 candle instead of its opening price.
Others confuse the Opening Range Gap with the 09:30 to 10:00 Opening Range.
Another common mistake is assuming that premium means bearish and discount means bullish. These terms classify the direction of the opening gap; they do not independently determine market direction.
Traders also ignore the size of the gap. A very large ORG requires different expectations from a smaller one.
Finally, many traders use the gap without identifying the higher-time-frame draw on liquidity. Without narrative and confirmation, the ORG becomes just another line on the chart.
ICT Opening Range Gap Checklist
Before trading an ORG setup, confirm:
- The chart is set to Regular Trading Hours
- The timezone is New York
- The chart is on the one-minute timeframe
- The previous 16:14 candle close is marked correctly
- The current 09:30 opening price is marked correctly
- The ORG is classified as premium or discount
- Consequent Encroachment is marked
- Upper and lower quadrants are marked
- The gap size has been measured
- The daily and weekly liquidity objectives are known
- The economic calendar has been checked
- London or pre-market liquidity has been identified
- Price has completed a meaningful liquidity sweep
- Displacement confirms the expected direction
- A valid FVG or PD Array provides the entry
- The ORG level being targeted is realistic
- The invalidation point is defined before entry
Final Thoughts
ICT Opening Range Gaps provide a precise way to study the difference between the previous Regular Trading Hours settlement and the next 09:30 New York opening.
The concept is simple to draw, but using it correctly requires more than marking two prices.
The trader must understand:
- Whether the ORG is premium or discount
- How large the gap is
- Where the quadrant levels are located
- Whether price is likely to seek liquidity before repricing
- Whether displacement confirms a change in delivery
- Whether CE or complete gap closure is a realistic objective
The most important lesson is that the Opening Range Gap is not an automatic entry signal. It is a map of unfinished Regular Trading Hours price delivery.
When combined with liquidity, Judas Swing, market structure, Fair Value Gaps and a clear higher-time-frame objective, the ORG can provide a structured model for anticipating where New York-session price may reprice next.