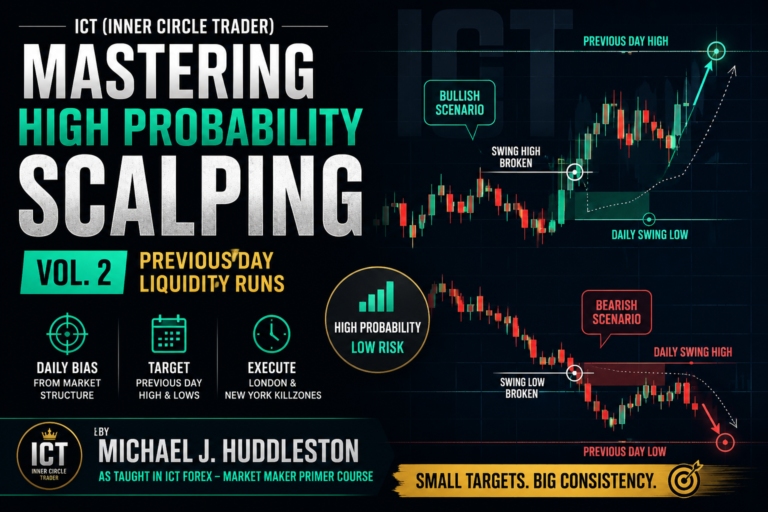
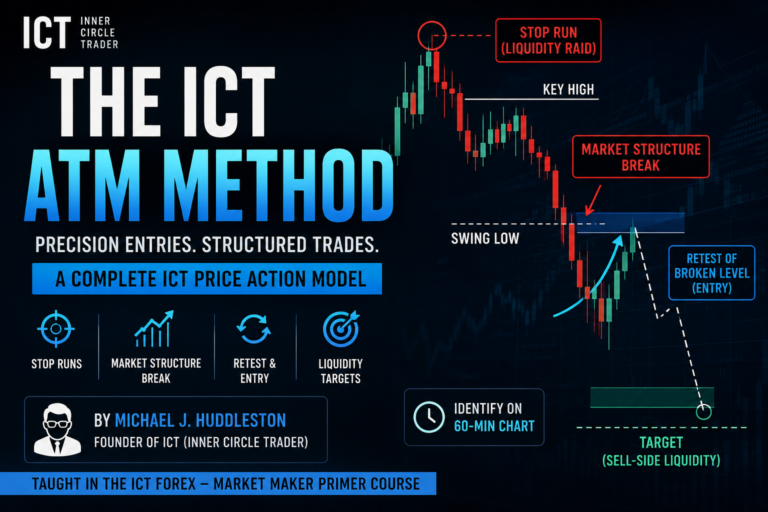
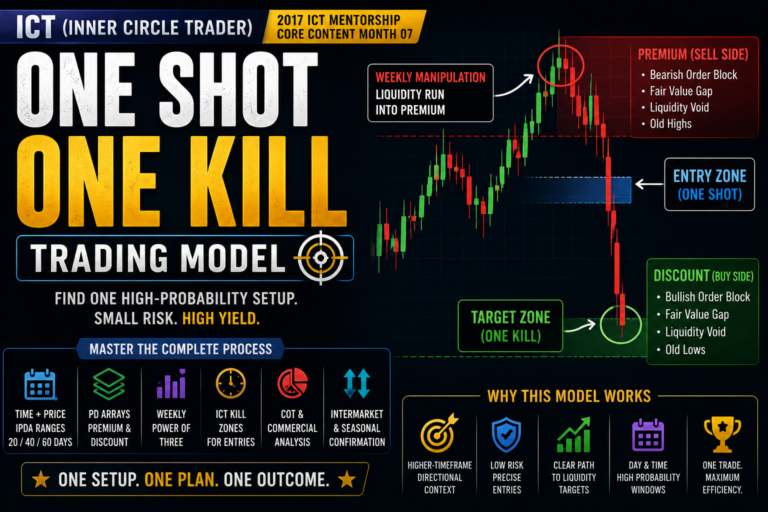
Mastering High Probability Scalping Vol. 1 introduces a simple but powerful framework for finding short-term price moves by combining directional bias, daily liquidity, time, and retracement-based entries.
This approach was taught by Michael J. Huddleston, the founder of the ICT (Inner Circle Trader) concepts, in the ICT Forex – Market Maker Primer Course. Rather than relying on moving averages, oscillators, trendlines, or traditional retail indicators, the model focuses almost entirely on price action and the market’s tendency to move toward previous highs and lows.
For ICT, a high-probability scalp can be viewed as a short-term 10 to 30 pip price swing. The objective is not to capture an entire daily or weekly range. The trader is simply trying to participate in a logical portion of price delivery toward an identifiable liquidity objective.
As Michael J. Huddleston explains:
“Day trading is not every day trading.”
This statement summarizes one of the most important lessons of Mastering High Probability Scalping Vol. 1. A scalper should wait for the correct condition rather than forcing a trade every day.
What Is High Probability Scalping in ICT?
In the ICT framework, scalping is not simply entering a lower timeframe chart and trying to capture a few random pips.
A high-probability scalp begins with a clear understanding of:
Directional bias → Liquidity draw → Time of day → Retracement → Entry → Liquidity target
The market must first provide a reason to expect higher or lower prices.
Once the trader determines direction, the next question is:
Where is price likely to be drawn?
In a bullish market, the draw may be a previous high containing buy-side liquidity.
In a bearish market, the draw may be a previous low containing sell-side liquidity.
The scalp is then framed around a short-term price move toward that objective.
The Previous Three Days Create the Scalping Framework
One of the simplest ideas in Mastering High Probability Scalping Vol. 1 is to monitor the recent three-day range.
Count the current trading day as Day 1. Then look back at the previous two trading days.
For example:
Today → Yesterday → Two days ago
Mark the highs and lows of these recent daily ranges.
The trader is interested in the:
- Previous day’s high
- Previous day’s low
- High from two days ago
- Low from two days ago
These levels can represent pools of resting liquidity.
When the market is bullish, previous highs become potential upside objectives.
When the market is bearish, previous lows become potential downside objectives.
Michael J. Huddleston describes the basic short-term scalp as an approach built around running previous daily highs or lows and monitoring the highest high and lowest low within this recent three-day framework.
Understand the ICT Draw on Liquidity
The draw on liquidity is the price level the market is expected to seek.
Suppose the market is bullish.
A previous day’s high may contain buy stops from traders holding short positions. When price moves above that old high, those stops can be triggered.
From the ICT perspective, the old high is therefore not automatically resistance.
It can be a liquidity objective.
The bullish logic is:
Bullish directional bias → Old high above price → Buy-side liquidity → Price draws higher
The bearish logic is:
Bearish directional bias → Old low below price → Sell-side liquidity → Price draws lower
As Huddleston states:
“The draw is previous highs and previous lows referencing daily highs and lows.”
This is the foundation of the high-probability scalping model. The trader does not blindly buy because price is rising or sell because price is falling. The trader first identifies where price may be attempting to deliver.
Use the Daily Chart to Determine Directional Bias
The daily chart provides directional context.
The hourly chart is then used to study recent liquidity and frame the scalp.
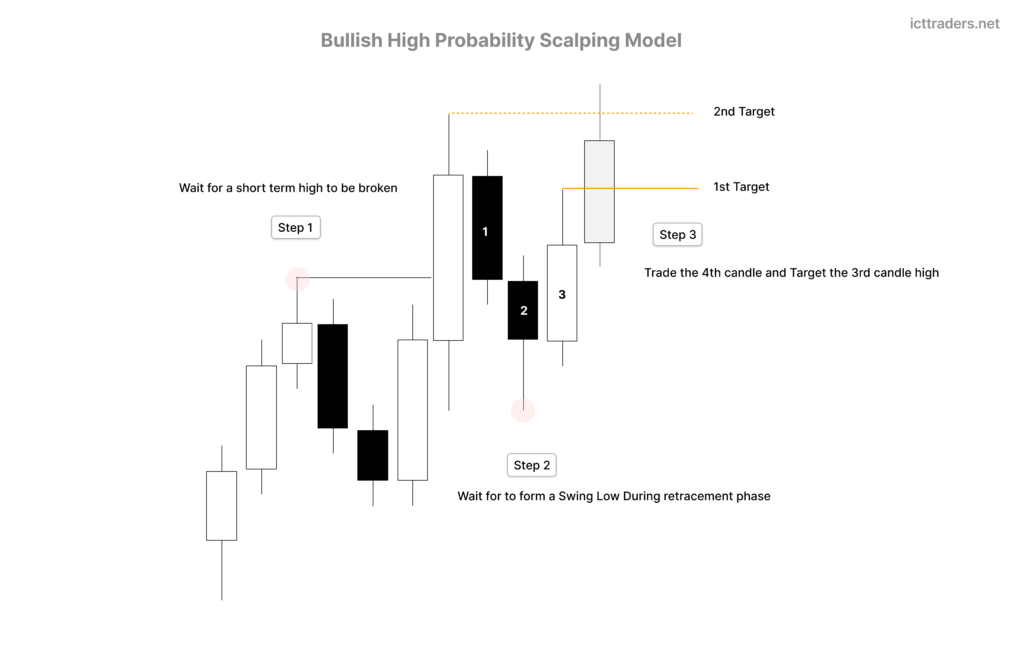
In this simplified ICT model, directional momentum is identified through breaks of daily swing highs and swing lows.
Bullish Directional Bias
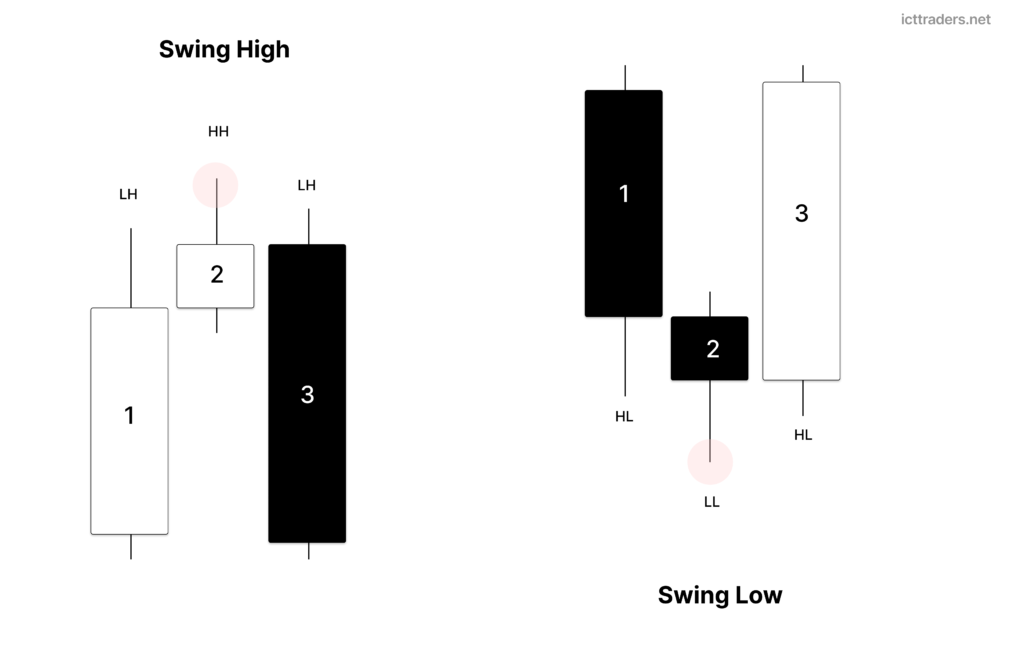
A swing high consists of three candles:
Lower high → Swing high → Lower high
When price trades above the swing high, the trader becomes alert to bullish momentum.
Do not immediately buy simply because the swing high was broken.
Instead, wait for a daily swing low to form.
A swing low consists of:
Higher low → Lowest low → Higher low
The logic is:
Swing high broken → Bullish alert → Wait for swing low → Monitor bullish continuation
After the swing low forms, focus on the high of the third candle in the three-candle formation.
When price begins trading above this reference, the trader can begin anticipating runs on previous daily highs.
The purpose is to align the scalp with daily momentum rather than trading against it.
Bullish High Probability Scalping Model
The bullish version of Mastering High Probability Scalping Vol. 1 can be simplified as follows:
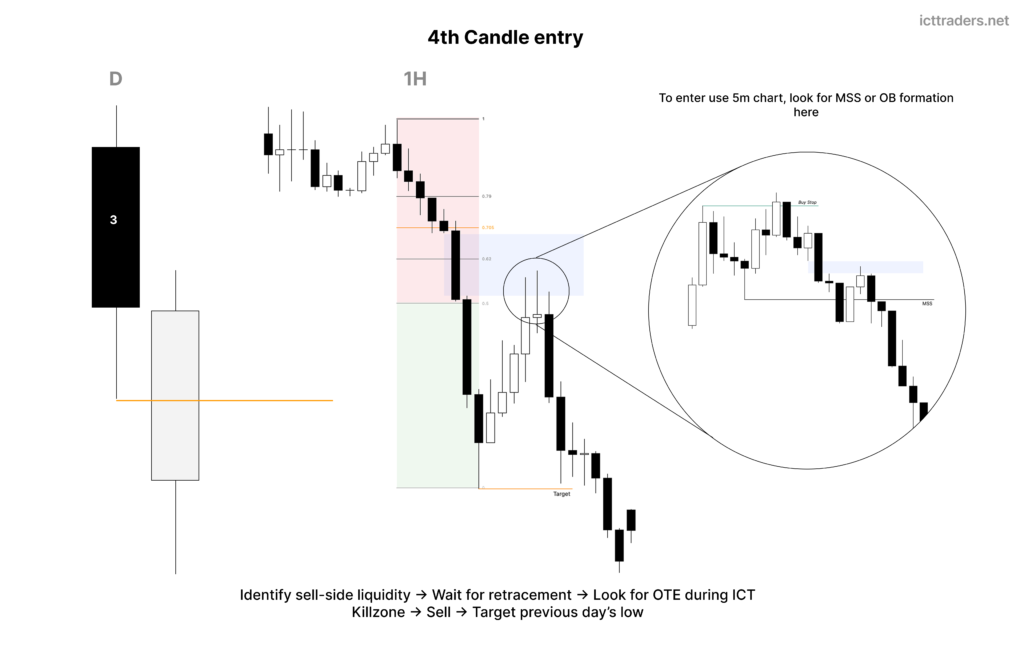
Daily swing high breaks → Daily swing low forms → Bullish momentum confirmed → Identify previous highs → Wait for retracement → Look for OTE during ICT Killzone → Buy → Target old highs
The trader is primarily interested in:
- Previous day’s high
- High from two days ago
- Significant intraday high
These become possible buy-side liquidity objectives.
The scalp does not require the trader to buy the exact daily low.
It also does not require holding until the market closes.
The objective is simply to capture a logical expansion toward an old high.
This is why the strategy can produce smaller but repeatable price objectives instead of depending on one enormous move.
Bearish High Probability Scalping Model
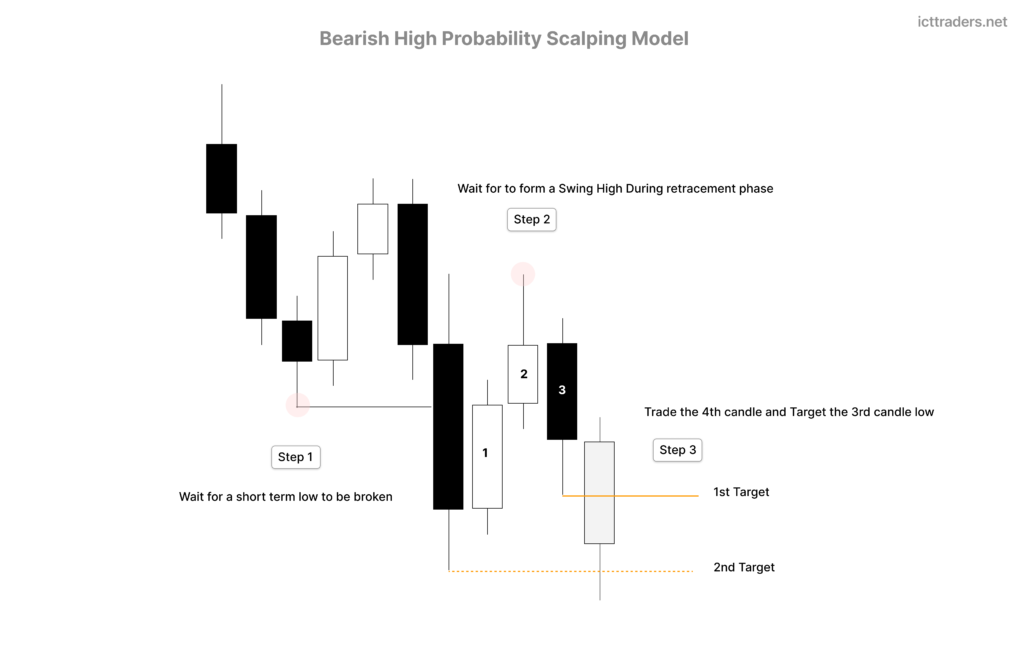
The bearish framework is the opposite.
First, price must trade below a meaningful daily swing low.
A swing low break signals potential bearish momentum.
The trader then waits for a daily swing high to form.
The sequence becomes:
Swing low broken → Bearish alert → Swing high forms → Bearish momentum confirmed → Identify previous lows
The trader can then look for an intraday selling opportunity.
The complete bearish model is:
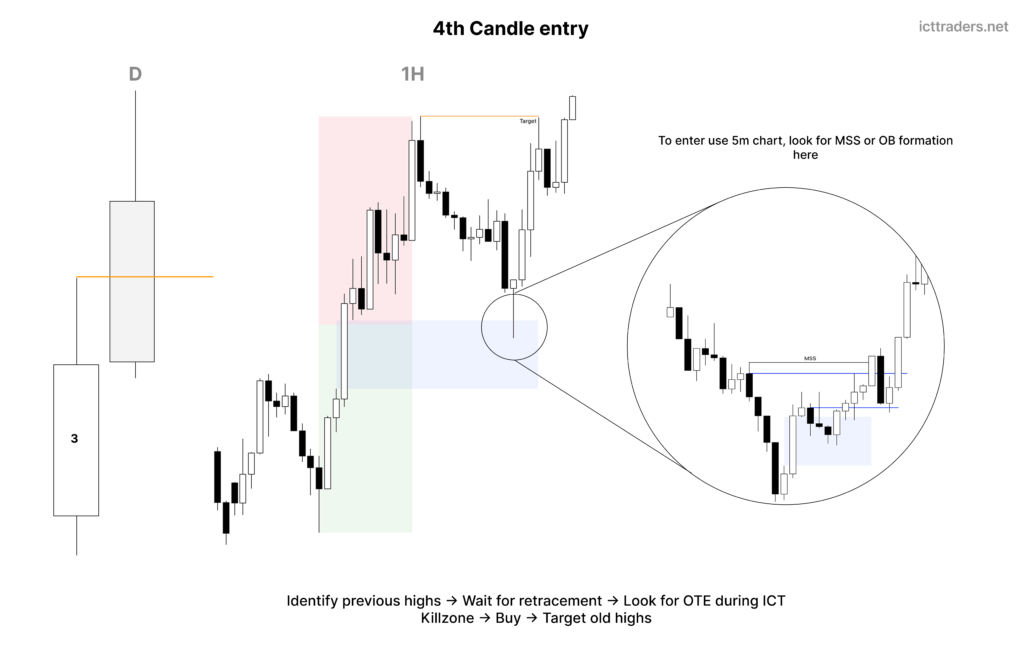
Daily swing low breaks → Daily swing high forms → Identify sell-side liquidity → Wait for retracement → Look for OTE during ICT Killzone → Sell → Target previous day’s low
Previous daily lows should not automatically be viewed as support.
When daily momentum is bearish, these lows may become liquidity targets.
The high-probability scalp is designed to participate in the price move toward those sell-side liquidity pools.
Use the Hourly Chart to Find Liquidity
Once the daily chart provides the directional bias, move to the 1-hour chart.
The hourly chart gives the trader a clearer view of:
- Previous daily highs
- Previous daily lows
- Intraday highs
- Intraday lows
- Recent session ranges
- Retracements
- Potential Optimal Trade Entries
For a bullish model, mark the old highs above current price.
For a bearish model, mark the old lows below current price.
The hourly chart helps answer a simple question:
What liquidity pool is price most likely reaching for?
This prevents the trader from entering with no clearly defined objective.
A setup becomes much easier to manage when the target is known before the entry.
Combine the Setup With ICT Killzones
Time is a major component of the ICT (Inner Circle Trader) methodology.
In this Vol. 1 framework, Huddleston highlights two important intraday windows in New York time:
London Killzone Sweet Spot
02:00 to 04:00 New York time
This is a key period for anticipating the formation of an intraday high or low.
New York Killzone
07:00 to 10:00 New York time
This provides another important window for an intraday setup and expansion.
A price pattern appearing outside these time windows may still work.
However, when the same setup overlaps with an ICT Killzone, the condition becomes more favorable within this particular scalping framework.
Therefore:
Correct bias + Liquidity objective + OTE + ICT Killzone = Higher-quality scalping condition
The trader should not treat time as an entry signal by itself.
The Killzone is used to refine an already established directional and liquidity narrative.
Use Optimal Trade Entry for the Retracement
After identifying directional bias and the liquidity draw, the trader should wait for price to retrace.
This is where ICT Optimal Trade Entry (OTE) becomes important.
For a bullish setup, identify the recent dynamic price rally and measure the retracement.
The primary OTE area is approximately:
62% to 79% retracement
The 70.5% retracement level is an important reference within this area.
In bullish conditions:
Price expands higher → Retraces into OTE → Killzone overlap → Previous high remains the draw → Look for long opportunity
In bearish conditions:
Price expands lower → Retraces into OTE → Killzone overlap → Previous low remains the draw → Look for short opportunity
The retracement provides a better location to participate in the anticipated liquidity run.
The trader is not chasing price after an expansion.
Instead, the trader waits for price to return to a more favorable entry area.
How to Frame the Fibonacci Range
Within this model, session highs and lows can help define the price range used for the Fibonacci retracement.
Huddleston explains using the significant London or New York session high and low as reference points while paying attention to the candle bodies—the opens and closes—when framing the Fibonacci range.
For a bullish move:
Identify the significant recent rally.
Use the relevant lower candle body as the lower reference.
Use the higher candle body near the top of the dynamic move as the upper reference.
Then monitor the retracement into the OTE area.
The objective remains the same:
Previous day’s high or an old intraday high
The Fibonacci tool does not determine directional bias.
It only helps refine the entry location after direction and the liquidity target are already established.
Take Profit at Logical Old Highs and Lows
A common mistake among scalpers is expecting every setup to become a massive price move.
That is not the purpose of this model.
If the market is bullish and the objective is the previous day’s high, that high is a logical place to consider taking profit or scaling out.
For example:
OTE long entry → Intraday high → Previous day’s high → High from two days ago
The nearest old high may serve as Target 1.
Additional liquidity levels may become secondary targets.
In bearish conditions:
OTE short entry → Intraday low → Previous day’s low → Low from two days ago
The model teaches traders to respect the objective.
Once price runs the targeted liquidity, the original scalp may be complete.
Do not automatically turn a successful scalp into a long-term trade because price appears capable of moving farther.
As Huddleston emphasizes when describing a completed liquidity run:
“That’s the trade and it’s over.”
A Full ICT High Probability Scalping Checklist
Before considering a scalp, ask:
1. What is the daily directional bias?
Has a daily swing high or swing low been broken?
2. Has the proper opposing swing formed?
After a bullish break, has a swing low formed?
After a bearish break, has a swing high formed?
3. Where is the draw on liquidity?
Previous day’s high?
Previous day’s low?
High or low from two days ago?
Intraday high or low?
4. Is price retracing?
Avoid blindly chasing an already expanded market.
5. Has price reached the OTE area?
Monitor approximately the 62% to 79% retracement zone.
6. Is the setup forming during an ICT Killzone?
London: 02:00–04:00 New York time
New York: 07:00–10:00 New York time
7. Is the liquidity target still available?
The target should not already have been fully run before the entry.
8. Where will profit be taken?
Define the old high or old low before entering.
The entire process is:
Daily bias → Three-day liquidity map → Identify draw → Wait for Killzone → Retracement into OTE → Execute with bias → Target previous high or low
Focus on One Currency Pair While Learning
Another important lesson in Mastering High Probability Scalping Vol. 1 is specialization.
New traders often monitor too many currency pairs.
This creates information overload and makes it difficult to recognize repeating price behaviors.
Huddleston recommends focusing on one currency pair for a period of study rather than constantly moving between many markets. His teaching specifically encourages concentrating on one major dollar-linked pair while learning the framework before expanding to a small basket after sufficient practice.
Studying one market allows the trader to repeatedly observe:
- How daily highs are attacked
- How daily lows are attacked
- How daily momentum develops
- How London creates highs and lows
- How New York expands
- How OTE retracements form
- How liquidity targets are delivered
The purpose is to learn price deeply rather than scan dozens of charts superficially.
Do Not Force a Scalp Every Day
The biggest psychological danger in scalping is the belief that short-term trading means constant trading.
It does not.
A single currency pair may not produce the complete high-probability condition every day.
The trader should ideally learn to recognize one or two quality opportunities per week rather than forcing daily participation.
Michael J. Huddleston repeatedly warns against making a live account trade simply because another trading day has started. The setup is not intended to be manufactured by the trader; the required market condition must first appear.
The better mindset is:
No directional clarity → No trade
No liquidity objective → No trade
No favorable retracement → No trade
Poor timing → Lower-quality condition
Complete model present → Consider the setup
Patience is part of the trading model.
Final Thoughts on Mastering High Probability Scalping Vol. 1
Mastering High Probability Scalping Vol. 1 teaches that a short-term trade does not need to be complicated.
The basic ICT (Inner Circle Trader) framework is built around identifying daily momentum and anticipating where liquidity is likely to be taken next.
When bullish:
Break a swing high → Form a swing low → Wait for retracement → Buy during a favorable time → Target previous highs
When bearish:
Break a swing low → Form a swing high → Wait for retracement → Sell during a favorable time → Target previous lows
The daily chart determines direction.
The hourly chart helps map liquidity.
The ICT Killzones refine timing.
Optimal Trade Entry refines price.
Previous daily highs and lows provide logical targets.
The real skill is not predicting every candle. It is patiently waiting until direction, liquidity, time, and price align around the same idea.
That is the foundation of the Mastering High Probability Scalping Vol. 1 approach taught by Michael J. Huddleston.