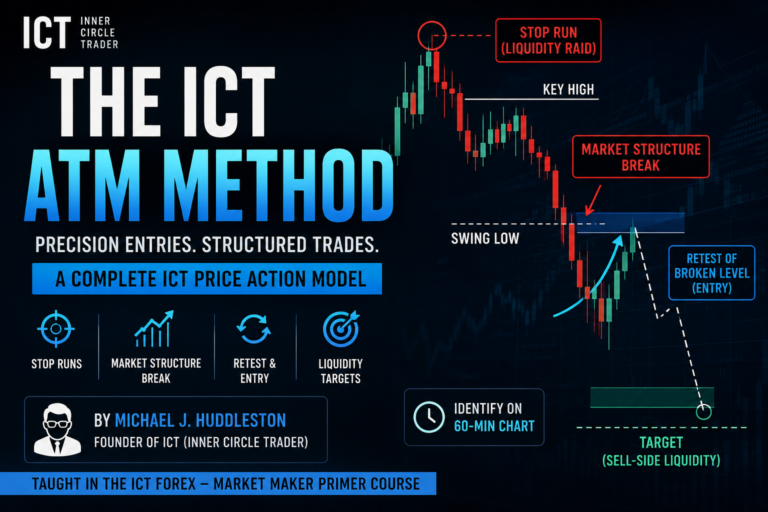
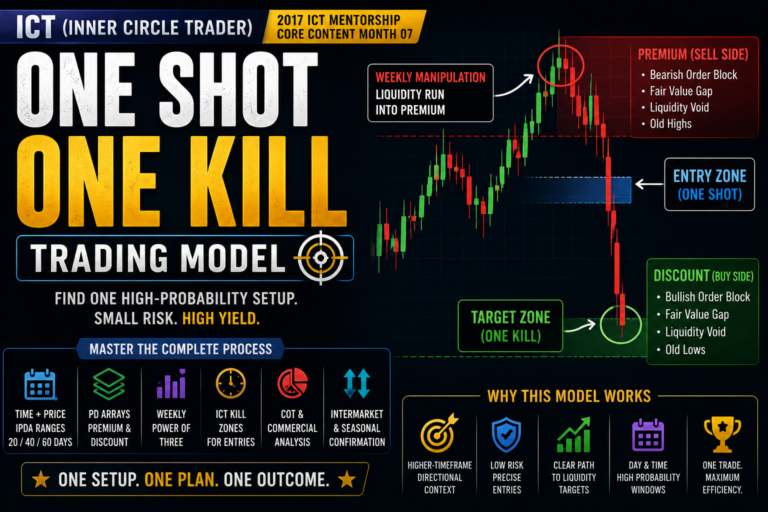
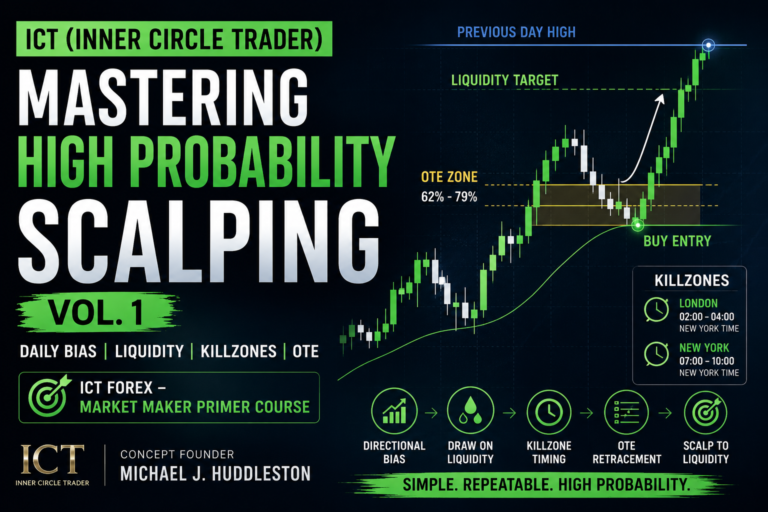
The ICT 2022 Model is an intraday trading framework taught by Michael J. Huddleston, the founder of ICT or Inner Circle Trader. This model was presented during the 2022 ICT Mentorship and was primarily demonstrated using index futures during the New York trading session. The complete mentorship series is available through the official Inner Circle Trader educational platform and YouTube channel.
The model explains how a trader can combine liquidity, market structure, displacement, fair value gaps, time and higher-timeframe direction to locate a structured intraday setup.
The basic sequence of the model is:
- Determine the likely draw on liquidity.
- Wait for price to raid liquidity on the opposite side.
- Look for strong displacement away from the raid.
- Confirm a market structure shift.
- Enter during a retracement into a fair value gap.
- Target the next logical liquidity pool.
Although the sequence appears simple, every part must occur within the correct market context. A liquidity sweep or fair value gap by itself does not automatically create a valid ICT 2022 Model setup.
What Is the ICT 2022 Model?
The ICT 2022 Model is a liquidity-based intraday trading strategy. It attempts to identify a temporary manipulation against the expected direction of price, followed by a strong move toward the real market objective.
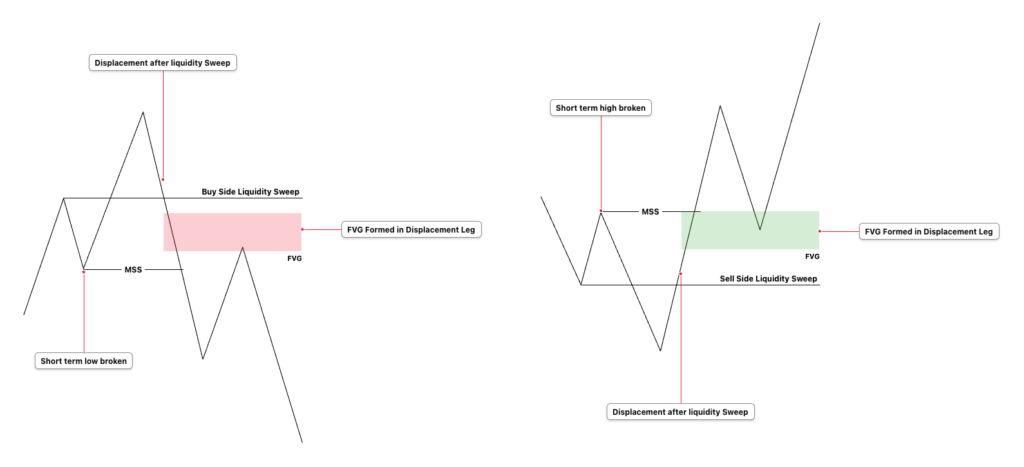
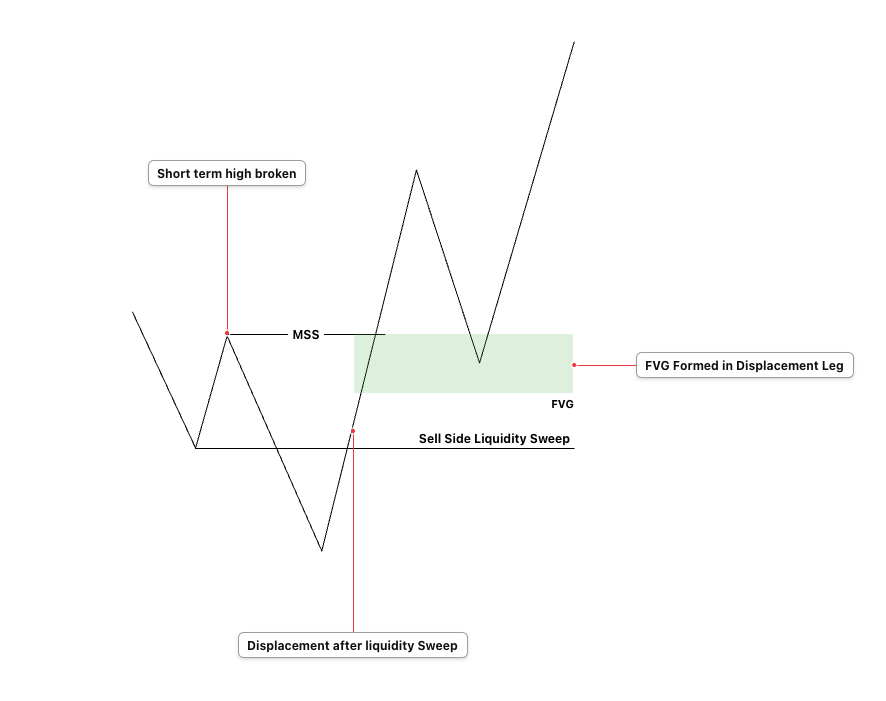
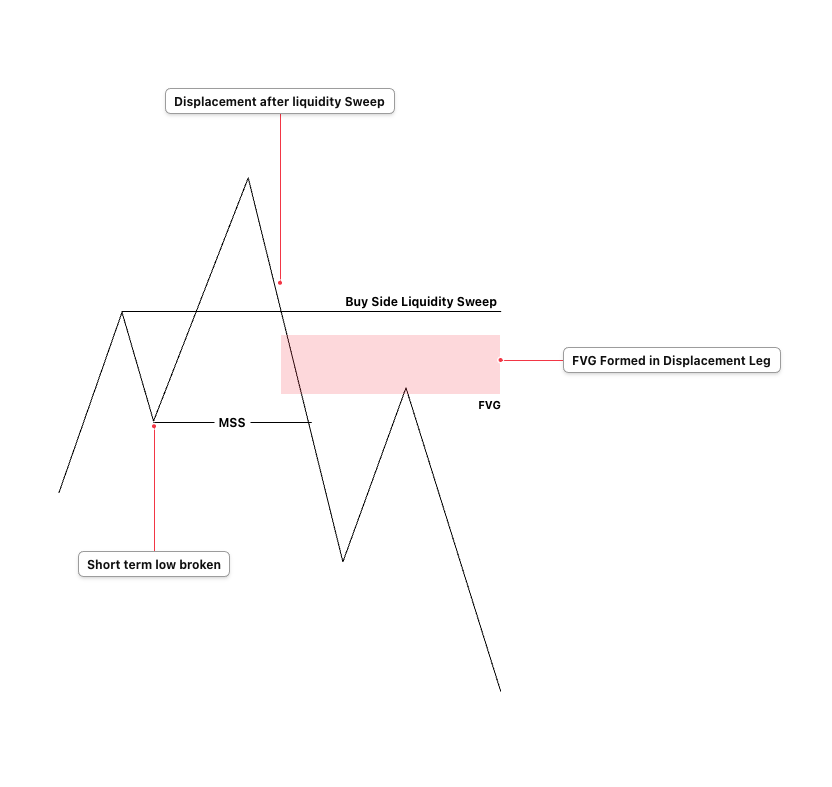
For example, when the trader has a bullish expectation, price may initially move lower and take sell-side liquidity. Once that liquidity has been collected, price may displace higher, break short-term market structure and leave a bullish fair value gap.
The retracement into that fair value gap may provide a long entry. The trade objective will generally be buy-side liquidity resting above the market.
The opposite process applies to a bearish setup.
The model can be summarized through five important questions:
- Where is price likely to go?
- Which side of liquidity may be taken first?
- Has price displaced away from that liquidity?
- Has short-term market structure shifted?
- Is there a fair value gap available for entry?
The fair value gap is used as an entry trigger after displacement within the model, while old highs, old lows and other liquidity pools may act as price objectives.
Core Logic of the ICT 2022 Model
The ICT 2022 Model is not based on buying support or selling resistance in the traditional sense. It focuses on how price moves between areas of liquidity.
Price may first travel toward one side of a trading range to trigger stop orders. After taking those stops, it may reverse and deliver toward liquidity resting on the other side.
1. Liquidity Accumulation
Price forms short-term highs and lows inside a range. Stop-loss orders begin accumulating above the highs and below the lows.
Buy stops generally rest above:
- Previous highs
- Equal highs
- Session highs
- Previous day high
- Short-term swing highs
Sell stops generally rest below:
- Previous lows
- Equal lows
- Session lows
- Previous day low
- Short-term swing lows
These levels provide potential liquidity for future price delivery.
2. Liquidity Manipulation
Price moves through one side of liquidity before reversing.
In a bullish model, price may run below an old low or equal lows. This takes sell-side liquidity and may trap traders who enter short after the apparent breakdown.
In a bearish model, price may run above an old high or equal highs. This takes buy-side liquidity and may trap traders who enter long after the apparent breakout.
The liquidity raid alone is not enough to enter. The trader must wait for confirmation that price is rejecting the raid.
3. Price Distribution
After the manipulation, price moves toward the real objective.
The move should show displacement, break short-term structure and create an imbalance. The fair value gap formed during this movement may then be used for entry.
This process is closely related to the ICT Power of Three framework:
- Accumulation
- Manipulation
- Distribution
Main Components of the ICT 2022 Model
Several ICT concepts work together inside this model. Understanding each component separately makes the complete setup easier to identify.
Draw on Liquidity
The draw on liquidity is the price level that the market is expected to seek.
Before looking for an entry, the trader should decide whether the likely draw is above or below the current market price.
Possible draws on liquidity include:
- Previous day high
- Previous day low
- Previous week high
- Previous week low
- Asian session high or low
- London session high or low
- Equal highs or equal lows
- Old swing highs or lows
- Higher-timeframe fair value gaps
- Higher-timeframe order blocks
- Daily volume imbalances
A bullish bias normally means that the primary draw is located above price. A bearish bias normally means that the primary draw is located below price.
The trader should avoid determining bias only from the shape of the most recent candle. Bias should come from the broader relationship between price, liquidity and higher-timeframe PD arrays.
Buy-Side and Sell-Side Liquidity
Buy-side liquidity refers to stop orders resting above old highs. These may include stop losses from short positions and breakout buy orders.
Sell-side liquidity refers to stop orders resting below old lows. These may include stop losses from long positions and breakout sell orders.
In the bullish ICT 2022 Model, sell-side liquidity is commonly raided before price moves toward buy-side liquidity.
In the bearish ICT 2022 Model, buy-side liquidity is commonly raided before price moves toward sell-side liquidity.
However, not every setup must sweep an obvious previous day high or low. The raid may occur around a smaller intraday swing or session liquidity level.
Liquidity Sweep
A liquidity sweep occurs when price trades above a high or below a low where stop orders are expected to rest.
The sweep should occur at a meaningful level. A random wick through a minor candle does not necessarily represent important liquidity.
A stronger liquidity sweep may involve:
- Equal highs or equal lows
- A previous session high or low
- The previous day high or low
- A clear short-term swing
- A higher-timeframe liquidity level
- A level formed before major economic news
- A high or low near the New York open
The purpose of the sweep is to create the conditions for a possible reversal or repricing.
Displacement
Displacement is a strong and energetic movement away from an important price level.
It commonly contains:
- Large candle bodies
- Limited overlap between candles
- Strong directional closes
- A break of short-term structure
- One or more fair value gaps
- Clear separation from the liquidity raid
Displacement is important because it shows that price is not merely reacting weakly to the liquidity sweep. It suggests that order flow has changed and price is being delivered aggressively in the opposite direction.
A slow and overlapping move away from liquidity is generally weaker confirmation.
Market Structure Shift
A Market Structure Shift, commonly called MSS, occurs when displacement breaks a meaningful short-term swing in the new direction.
For a bullish MSS, price should displace above a relevant short-term high after sell-side liquidity has been taken.
For a bearish MSS, price should displace below a relevant short-term low after buy-side liquidity has been taken.
The broken swing should be connected to the movement that led into the liquidity sweep. Breaking an insignificant one-minute candle high or low may not provide meaningful confirmation.
The market structure shift helps distinguish a possible reversal from a simple liquidity sweep followed by continued movement in the same direction.
Fair Value Gap
A Fair Value Gap, or FVG, is a three-candle price imbalance created during displacement.
A bullish fair value gap forms when the high of the first candle does not overlap the low of the third candle.
A bearish fair value gap forms when the low of the first candle does not overlap the high of the third candle.
The middle candle normally creates the strongest part of the displacement.
After the fair value gap forms, price may retrace into it before continuing toward the liquidity objective.
The trader may use:
- The beginning of the fair value gap
- The entire fair value gap
- Consequent encroachment
- The 50 percent level of the gap
Consequent encroachment is the midpoint of the fair value gap. It can provide a more refined entry, but price is not required to reach the midpoint every time.
Premium and Discount
Premium and discount help determine whether an entry is appropriately priced within a selected range.
A dealing range can be drawn between a significant swing high and swing low.
- The upper half is premium.
- The lower half is discount.
- The midpoint is equilibrium.
For bullish setups, traders generally prefer to buy in discount.
For bearish setups, traders generally prefer to sell in premium.
Premium and discount should support the setup, not replace the liquidity raid and market structure shift.
Bullish ICT 2022 Model
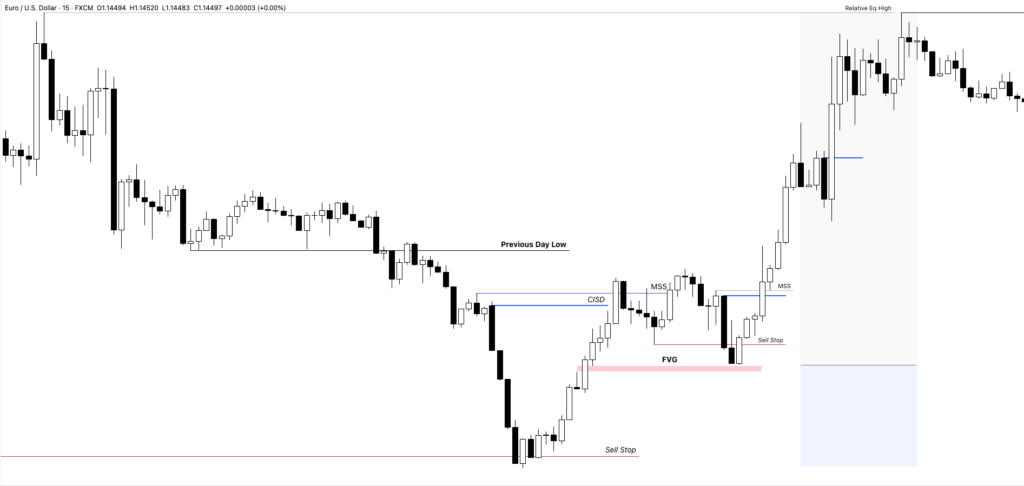
A bullish setup develops when the trader expects price to move toward buy-side liquidity.
Step 1: Establish a Bullish Draw on Liquidity
Start by identifying a logical objective above the current market price.
This may be:
- Previous day high
- Equal highs
- London high
- An old intraday high
- A higher-timeframe bearish fair value gap
- A daily or hourly liquidity objective
The objective should offer enough distance for a reasonable trade.
Step 2: Identify Sell-Side Liquidity
Mark the liquidity resting below current price.
Possible sell-side liquidity may be found below:
- Equal lows
- Asian session low
- London session low
- Previous day low
- An intraday swing low
- A low formed before 08:30 or 09:30 New York time
The ideal sell-side liquidity pool should be visible and meaningful enough to attract price.
Step 3: Wait for the Sell-Side Liquidity Raid
Price should trade below the marked low and take sell-side liquidity.
Do not enter immediately after the sweep.
Price can continue falling after taking liquidity. The trader needs evidence that the market is ready to move higher.
Step 4: Look for Bullish Displacement
After the liquidity raid, price should move strongly higher.
The move should break a relevant short-term high and ideally create a bullish fair value gap.
Weak candles with heavy overlap are less convincing. The clearest setups normally show obvious displacement away from the low.
Step 5: Confirm the Bullish Market Structure Shift
The bullish displacement should break the short-term high that was controlling the bearish movement into the liquidity sweep.
This confirms that short-term order flow has shifted from bearish to bullish.
The market structure shift should happen after the sell-side liquidity raid, not before it.
Step 6: Mark the Bullish Fair Value Gap
Identify the fair value gap created by the displacement.
The preferred fair value gap is generally:
- Created during the market structure shift
- Located below current price
- Aligned with the bullish draw on liquidity
- Situated within discount when possible
- Formed during an active trading period
Step 7: Enter During the Retracement
Wait for price to retrace into the bullish fair value gap.
Possible entry methods include:
- Entry at the beginning of the gap
- Entry at consequent encroachment
- Entry using a limit order
- Entry after lower-timeframe confirmation inside the gap
A confirmation entry may reduce the chance of entering a fair value gap that fails, but it may also produce a later entry.
Step 8: Place the Stop Loss
The stop loss may be placed:
- Below the liquidity-sweep low
- Below the candle creating the bullish displacement
- Below a supporting bullish order block
- Below the low that invalidates the setup
The stop should be placed where the bullish trade idea becomes invalid, not at an arbitrary number of points or pips.
Step 9: Target Buy-Side Liquidity
The first objective may be a nearby short-term high.
Larger targets may include:
- Equal highs
- Session high
- Previous day high
- Higher-timeframe liquidity
- A premium PD array
Partial profit may be taken at internal liquidity, while the remaining position may target external liquidity.
Bearish ICT 2022 Model
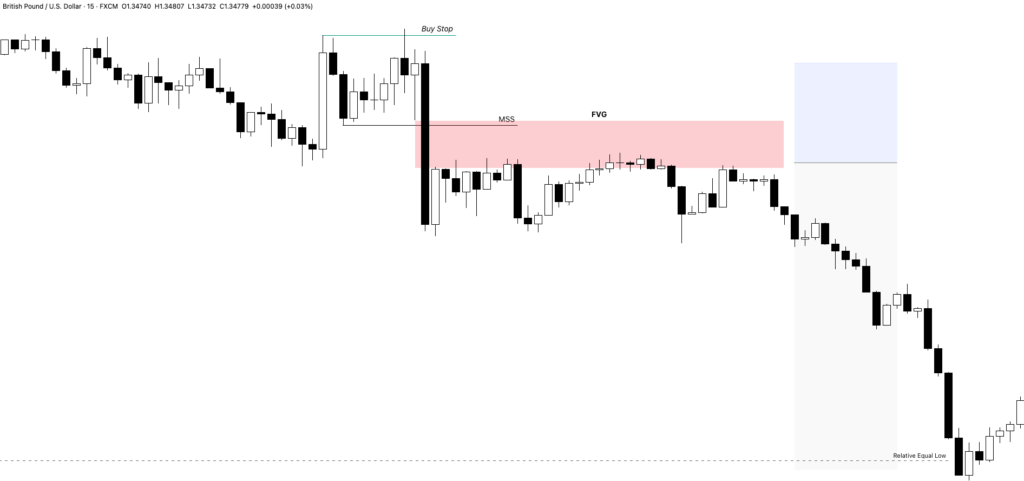
The bearish model is the inverse of the bullish model.
Step 1: Establish a Bearish Draw on Liquidity
Identify a logical target below current price.
This may include:
- Previous day low
- Equal lows
- London low
- Asian session low
- An old intraday low
- A higher-timeframe bullish fair value gap
Step 2: Identify Buy-Side Liquidity
Mark liquidity resting above price.
Possible buy-side liquidity includes:
- Equal highs
- Previous day high
- Session high
- Short-term swing high
- Pre-market high
- A high formed before 08:30 or 09:30 New York time
Step 3: Wait for the Buy-Side Liquidity Raid
Price should move above the marked high and trigger buy-side liquidity.
Do not sell simply because a high has been taken. Wait for bearish displacement and structural confirmation.
Step 4: Look for Bearish Displacement
Price should move sharply lower from the liquidity sweep.
The displacement should break a meaningful short-term low and create a bearish fair value gap.
Step 5: Confirm the Bearish Market Structure Shift
The bearish movement should break the short-term low that supported the rally into buy-side liquidity.
This confirms that short-term order flow has changed from bullish to bearish.
Step 6: Mark the Bearish Fair Value Gap
Locate the fair value gap created during the bearish displacement.
A strong bearish fair value gap should be connected to the structure break and aligned with the bearish liquidity objective.
Step 7: Enter During the Retracement
Wait for price to retrace upward into the bearish fair value gap.
The trader may enter at:
- The lower boundary of the gap
- Consequent encroachment
- A bearish order block overlapping the gap
- A lower-timeframe confirmation pattern
Step 8: Place the Stop Loss
The stop may be placed:
- Above the liquidity-sweep high
- Above the displacement candle
- Above a bearish order block
- Above the level that invalidates the bearish setup
Step 9: Target Sell-Side Liquidity
Profit targets may include:
- A recent short-term low
- Equal lows
- Session low
- Previous day low
- A higher-timeframe discount PD array
Best Timeframes for the ICT 2022 Model
The model uses multiple timeframes because one chart is rarely sufficient for bias, setup formation and execution.
Daily Chart
Use the daily chart to locate:
- Previous day high and low
- Higher-timeframe liquidity
- Daily fair value gaps
- Daily order blocks
- Premium and discount
- Broader directional context
Four-Hour and One-Hour Charts
Use these charts to identify:
- Major dealing ranges
- External liquidity
- Higher-timeframe market structure
- Important PD arrays
- Likely draw on liquidity
Fifteen-Minute Chart
The 15-minute chart can be used to mark:
- Session highs and lows
- Intraday liquidity
- Short-term directional structure
- The general New York session range
- Important intraday fair value gaps
Five-Minute Chart
The five-minute chart can be used for:
- Liquidity sweeps
- Displacement
- Market structure shifts
- Fair value gap formation
- Less aggressive execution
One-Minute and Three-Minute Charts
These lower timeframes may provide:
- Refined entries
- Smaller stop-loss distances
- Detailed market structure
- Additional confirmation inside a higher-timeframe fair value gap
Lower timeframes also produce more noise. A one-minute fair value gap should not overrule the higher-timeframe context.
Important New York Session Times
The ICT 2022 Model is commonly studied during the New York morning session. New York local time should be used so that daylight-saving changes are handled correctly.
Important times include:
08:30
Major United States economic reports are frequently released at 08:30. These releases can create liquidity sweeps, displacement and rapid repricing.
Trading directly before or during major news carries additional risk.
09:30
The United States equity market opens at 09:30. Index futures may experience a large expansion, stop run or reversal around this time.
10:00
The 10:00 period may provide another expansion or reversal, especially after the initial 09:30 volatility has formed liquidity and market structure.
These times should be treated as context. A trader should not enter simply because the clock reaches a specific minute.
The complete price sequence must still be present.
How to Determine Directional Bias
The most difficult part of the model is often determining the correct draw on liquidity.
A trader may use the following process.
Study Higher-Timeframe Liquidity
Mark the nearest important liquidity above and below price.
Ask which side appears more likely to be reached based on the daily and hourly structure.
Observe Recent Price Delivery
Determine whether price is:
- Expanding
- Retracing
- Consolidating
- Reversing
- Rebalancing an imbalance
A market expanding strongly toward a higher-timeframe objective should not be treated as a reversal simply because a small liquidity sweep appears on the one-minute chart.
Use Premium and Discount
When the higher-timeframe expectation is bullish, look for price to trade into discount or a bullish PD array.
When the expectation is bearish, look for price to trade into premium or a bearish PD array.
Consider the Previous Day High and Low
The previous day high and low often provide important external liquidity.
When price is trading near one of these levels, consider whether it is likely to:
- Raid the level and reverse
- Trade through the level and continue
- Use the level as an intermediate objective
Consider the Daily Open
The New York midnight opening price may help frame the daily range.
For a bullish daily expectation, price may trade below the opening price during manipulation and then distribute higher.
For a bearish daily expectation, price may trade above the opening price during manipulation and then distribute lower.
The open should be combined with liquidity and price structure. It is not a standalone buy or sell level.
Internal and External Liquidity
Understanding internal and external liquidity can improve trade management.
External liquidity generally rests outside a defined trading range. Examples include a major swing high, swing low, previous day high or previous day low.
Internal liquidity rests inside the range. Examples may include smaller swing points, fair value gaps and minor equal highs or lows.
A common model is:
- Price takes external liquidity on one side.
- Price shifts structure.
- Price retraces into an internal fair value gap.
- Price moves toward external liquidity on the opposite side.
Internal liquidity may be used for partial profits. External liquidity may be used as the main objective.
Hypothetical Bullish Example
Suppose the one-hour chart shows that price is trading in discount and the previous day high remains untapped.
The previous day high becomes the bullish draw on liquidity.
During the New York session, price moves below the London low and takes sell-side liquidity. After the sweep, price rallies strongly on the five-minute chart.
The rally breaks a five-minute short-term high and leaves a bullish fair value gap.
The trader waits for price to retrace into the fair value gap. A long position is entered near consequent encroachment.
The stop loss is placed below the low that swept the London session.
The first target is an intraday high. The final objective is the previous day high.
The trade is based on a complete narrative:
- Bullish higher-timeframe context
- Clear upside draw
- Sell-side liquidity raid
- Bullish displacement
- Market structure shift
- Fair value gap entry
- Buy-side liquidity target
Hypothetical Bearish Example
Suppose the daily chart shows price trading inside a premium area, while the previous day low remains untapped.
The previous day low becomes the bearish draw on liquidity.
After the New York equity open, price trades above the pre-market high and takes buy-side liquidity.
Price then displaces lower, breaks a meaningful five-minute swing low and creates a bearish fair value gap.
The trader waits for a retracement into the gap and enters short.
The stop is placed above the liquidity-sweep high.
The first target is an internal low. The final target is the previous day low.
Again, the fair value gap is only one part of the setup. The trade becomes meaningful because the gap forms after liquidity has been taken and market structure has shifted.
Entry Refinements
The basic ICT 2022 Model can be refined with additional concepts. These should be treated as supporting evidence rather than mandatory requirements.
Consequent Encroachment
Consequent encroachment is the midpoint of the fair value gap.
Waiting for the midpoint may improve the entry price, but price may only touch the edge of the gap before continuing.
Order Block
An order block overlapping a fair value gap may strengthen the entry area.
For a bullish trade, a bullish order block may support the bullish gap.
For a bearish trade, a bearish order block may support the bearish gap.
Breaker Block
A breaker block may appear after a failed order block and structural shift.
When a breaker overlaps a fair value gap, the overlapping area may provide additional confluence.
Optimal Trade Entry
The OTE retracement zone may align with the fair value gap, generally within a deeper retracement of the displacement leg.
However, the ICT 2022 Model does not require every trade to reach an exact Fibonacci level.
SMT Divergence
SMT divergence between correlated markets may support the liquidity narrative.
For example, one index may take a high while another correlated index fails to take its corresponding high. This may indicate relative weakness.
SMT should filter a setup. It should not replace the liquidity sweep, displacement and fair value gap sequence.
Stop-Loss Placement
A stop loss should be positioned where the trade idea becomes invalid.
For bullish setups, the setup may become invalid when price trades decisively below the low responsible for the liquidity raid.
For bearish setups, the setup may become invalid when price trades decisively above the high responsible for the liquidity raid.
Possible stop placements include:
- Beyond the manipulation high or low
- Beyond the displacement origin
- Beyond an order block
- Beyond the relevant dealing range extreme
A very tight stop may improve the theoretical reward-to-risk ratio but can also increase the probability of being stopped out by normal price movement.
Position size should be adjusted according to the stop distance.
Profit-Taking Methods
Profit targets should be selected before entering the trade.
Possible objectives include:
- Recent intraday high or low
- Equal highs or equal lows
- Session liquidity
- Previous day high or low
- Previous week high or low
- Higher-timeframe fair value gap
- Higher-timeframe order block
- External range liquidity
A practical approach is to separate the targets.
The first portion may be closed at internal liquidity. The remaining position may be held for external liquidity.
Once price has reached the original draw on liquidity, the trader should avoid expecting unlimited continuation without a new analysis.
Risk Management for the ICT 2022 Model
No trading model produces a guaranteed result. Risk management remains necessary even when every condition appears valid.
A trader should define:
- Maximum risk per trade
- Maximum daily loss
- Maximum number of attempts
- Minimum acceptable reward-to-risk
- Conditions that invalidate the setup
- Times when trading should be avoided
Risk should be calculated from the distance between entry and stop loss.
For example, when the stop needs to be wider because the liquidity-sweep low is distant, position size should be reduced. The stop should not be moved closer merely to trade a larger position.
Traders should also avoid taking repeated entries after the primary setup has already failed. Multiple losses during the same session can quickly damage an account.
Common Mistakes
Entering Immediately After a Liquidity Sweep
A sweep does not guarantee reversal.
Wait for displacement, a structure shift and an entry pattern.
Trading Every Fair Value Gap
Fair value gaps appear frequently.
The gap should form after a meaningful liquidity event and during directional displacement.
Ignoring the Draw on Liquidity
Without a clear target, a trader cannot determine whether the setup has enough potential.
The draw on liquidity should be established before entry.
Using a Minor Structure Break
Breaking a single insignificant candle is not always a meaningful market structure shift.
Focus on the swing that controlled the movement into the liquidity raid.
Trading Outside an Active Session
Setups forming during inactive periods may lack sufficient volume and displacement.
The model is generally clearer during active London or New York trading periods.
Chasing the Displacement
Entering after price has already expanded far away from the fair value gap may create poor reward-to-risk.
Wait for a retracement or allow the setup to go without you.
Forcing a Daily Bias
The market may not provide a clear directional expectation every day.
When both sides of liquidity appear equally likely, waiting is better than forcing a trade.
Confusing Continuation With Reversal
A liquidity level can be swept and price can continue in the same direction.
The market structure shift is necessary to confirm that a reversal model may be developing.
Using Too Many Concepts
Adding order blocks, breakers, SMT, OTE, standard deviations and multiple indicators to every setup can create confusion.
Start with the core model:
- Draw on liquidity
- Opposing liquidity raid
- Displacement
- Market structure shift
- Fair value gap
- Target
ICT 2022 Model Trading Checklist
Before entering a bullish trade, check:
- Is there a clear upside draw on liquidity?
- Has meaningful sell-side liquidity been identified?
- Has price taken that sell-side liquidity?
- Has bullish displacement appeared?
- Has a meaningful short-term high been broken?
- Did the displacement create a bullish fair value gap?
- Is the entry occurring during an active session?
- Is the target clear?
- Is the stop placed below a logical invalidation point?
- Does the potential reward justify the risk?
Before entering a bearish trade, check:
- Is there a clear downside draw on liquidity?
- Has meaningful buy-side liquidity been identified?
- Has price taken that buy-side liquidity?
- Has bearish displacement appeared?
- Has a meaningful short-term low been broken?
- Did the displacement create a bearish fair value gap?
- Is the entry occurring during an active session?
- Is the target clear?
- Is the stop placed above a logical invalidation point?
- Does the potential reward justify the risk?
When several answers are unclear, the setup is probably incomplete.
Is the ICT 2022 Model a Reversal Strategy?
The model is commonly presented as a reversal after a liquidity raid, but the reversal usually occurs within a larger directional narrative.
For example, a short-term bearish move may raid sell-side liquidity before reversing into a higher-timeframe bullish continuation.
Therefore, it may look like a reversal on the one-minute or five-minute chart while functioning as continuation on the hourly or daily chart.
The timeframe being observed determines whether the movement is classified as reversal or continuation.
Can the ICT 2022 Model Be Used in Forex?
The model can be studied in forex because forex markets also form liquidity pools, structure shifts and fair value gaps.
However, session behavior and price movement can differ from index futures.
Forex traders may focus on:
- EUR/USD
- GBP/USD
- USD/JPY
- London session liquidity
- New York session liquidity
- Previous day high and low
The trader should test the model separately for each instrument rather than assuming identical behavior across all markets.
Can It Be Used on Gold?
The model may also be studied on XAU/USD.
Gold can react strongly around:
- 08:30 New York economic data
- The New York session
- Dollar Index movement
- Previous day liquidity
- London session highs and lows
Gold is often volatile, so stop distance and position size require careful management.
What Is the Best Timeframe?
There is no single timeframe for the entire model.
A practical structure is:
- Daily and four-hour chart for broad direction
- One-hour and 15-minute chart for liquidity
- Five-minute chart for setup confirmation
- One-minute or three-minute chart for refined entry
Beginners may find the five-minute chart easier than the one-minute chart because it contains less market noise.
Does the Fair Value Gap Need to Fill Completely?
No.
Price may:
- Touch the edge of the fair value gap
- Reach consequent encroachment
- Completely fill the gap
- Miss the gap and continue
- Trade through the gap and invalidate the setup
A full gap fill is not required.
The trader should avoid assuming that every imbalance must be completely rebalanced before price can continue.
Final Thoughts
The ICT 2022 Model provides a structured way to study intraday price delivery. Its strength does not come from one isolated concept. It comes from combining directional context, liquidity, time, displacement, market structure and fair value.
A valid bullish model generally includes a sell-side liquidity raid, bullish displacement, a bullish market structure shift, a retracement into a bullish fair value gap and a target above price.
A valid bearish model generally includes a buy-side liquidity raid, bearish displacement, a bearish market structure shift, a retracement into a bearish fair value gap and a target below price.
The most important part is the order of events. The trader should not begin with a random fair value gap and then search for reasons to trade it.
Begin with the likely draw on liquidity. Wait for the market to take liquidity on the opposite side. Demand displacement and structural confirmation. Then use the fair value gap for entry and the opposing liquidity pool for the objective.
The model should first be studied through chart review, replay and demo trading. Live trading should only be considered after the trader has developed clear rules and tested them across a meaningful sample of market conditions.
This content is provided for educational purposes only and does not constitute financial or investment advice.