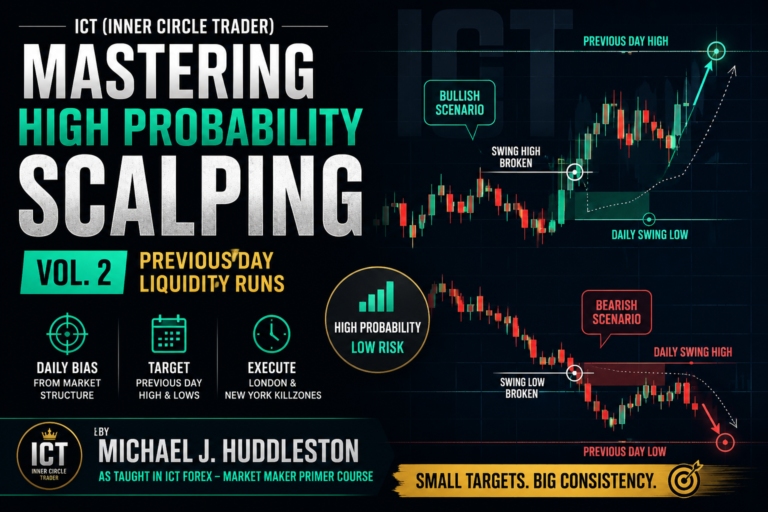
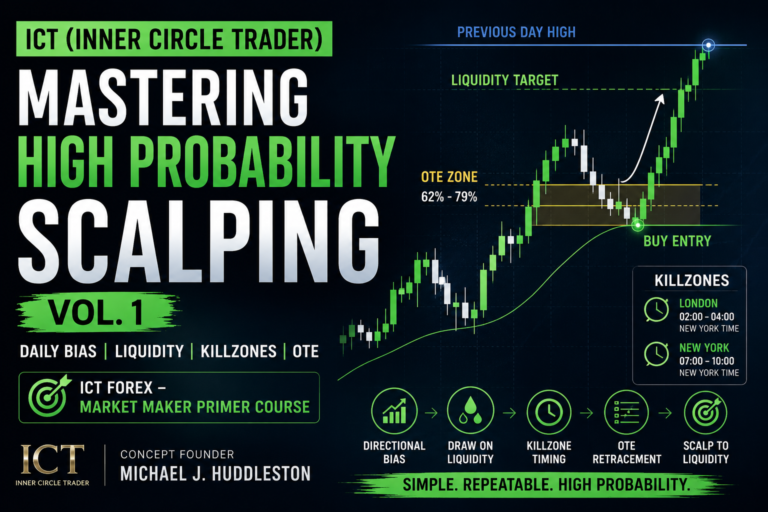
Mastering High Probability Scalping Vol. 3 completes the high-probability scalping framework by connecting daily bias, London session price delivery, New York retracements, Optimal Trade Entry, liquidity targets, reversal conditions, and strict money management.
This concept is taught by Michael J. Huddleston, the founder of ICT (Inner Circle Trader), in the ICT Forex – Market Maker Primer Course.
The core idea is simple: when the daily directional bias and London session move agree, traders can wait for a New York session retracement and use that retracement to participate in a continuation toward intraday or previous-day liquidity.
The model is not designed for constant market participation. It is a structured process of waiting for price, time, and directional context to align.
As Michael J. Huddleston explains:
“You don’t have to know everything right now.”
The objective is to develop consistency by repeatedly studying a specific price delivery model rather than attempting to predict every market movement.
What Is Mastering High Probability Scalping Vol. 3?
The Mastering High Probability Scalping Vol. 3 model primarily focuses on previous-day bank liquidity runs and New York session continuation setups.
The framework combines:
Daily bias → Power of Three → London confirmation → New York retracement → OTE entry → Liquidity target
The trader first determines whether the market is bullish or bearish.
The London session is then studied to determine whether price delivery supports that directional expectation.
After 07:00 New York time, the trader waits for price to retrace.
When the retracement reaches a favorable price area, an ICT Optimal Trade Entry may provide an opportunity to participate in the continuation.
The ultimate objective may be:
- High or low of the day
- Previous day’s high or low
- Target 1
- Target 2
- Symmetrical price swing
This provides a complete intraday scalping framework rather than an isolated entry pattern.
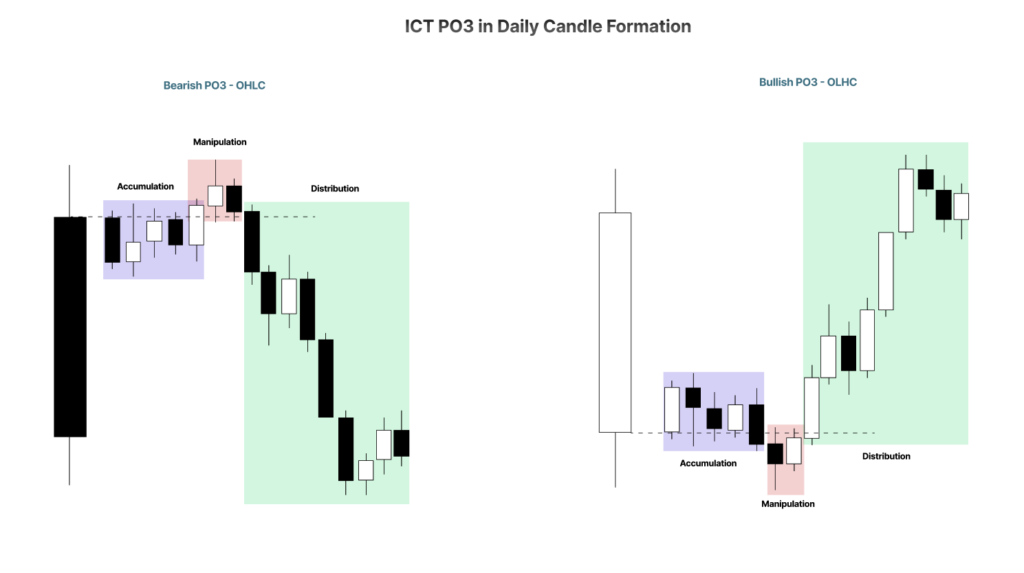
Understand ICT Power of Three
The ICT Power of Three describes three primary components of price delivery:
Accumulation → Manipulation → Distribution
Accumulation is the phase where long or short positions are accumulated.
Manipulation occurs when price initially moves against the intended future direction.
Distribution is the expansion in the actual directional move.
For example, in a bullish market:
Accumulation → Manipulation lower → Expansion and distribution higher
In a bearish market:
Accumulation → Manipulation higher → Expansion and distribution lower
The manipulation phase is important because it can place traders on the wrong side of the market before the larger directional move begins.
This is why ICT traders do not automatically assume the first price movement of a session represents the true intended direction.
The trader must compare the price movement with the daily directional bias.

Bullish ICT New York Scalping Model
When the daily bias is bullish, the trader wants to confirm that the London session also demonstrated bullish characteristics.
A bullish London session may initially attempt to trade lower.
However, the lower prices should be rejected, followed by a meaningful rally.
The basic model is:
Bullish daily bias → London trades lower → Lower prices rejected → London rallies → Wait for New York retracement
The trader then waits until 07:00 New York time.
Between 07:00 and 09:00 New York time, monitor price for a retracement lower.
The New York session may retrace from an intraday swing high or a short-term high created during London.
The preferred condition is a retracement of approximately 20 pips or more.
The process becomes:
London bullish expansion → 07:00 New York time → 20+ pip retracement lower → OTE → Long entry → Target liquidity above
The trader is not chasing London’s bullish move.
Instead, the trader waits for New York to offer a retracement into a more favorable price location.
Why the 20-Pip Retracement Is Important
Michael J. Huddleston emphasizes waiting for a meaningful retracement after 07:00 New York time.
Ideally, the retracement should be approximately 20 pips or greater.
The purpose is to avoid reacting to every minor price fluctuation.
A larger retracement creates a clearer short-term price swing that can be measured using the ICT Optimal Trade Entry framework.
If the bullish narrative is exceptionally strong, an experienced trader may sometimes consider a smaller retracement of approximately 10 to 15 pips.
However, the safer basic model is:
Wait for at least a 20-pip retracement
Huddleston specifically teaches that if no suitable 20-pip retracement forms by approximately 09:00 New York time, the trader should walk away instead of manufacturing a setup.
The rule is simple:
No retracement by 09:00 → No setup → No trade
This protects the trader from chasing an already-expanded market.
Bullish Optimal Trade Entry
Once price retraces lower after 07:00 New York time, measure the retracement using the Fibonacci tool.
The primary entry reference is the 62% retracement level.
In bullish conditions:
Price rallies → New York retraces lower → Price reaches 62% retracement → Look for long opportunity
The entry is taken as price is trading lower into the retracement.
This is important.
The ICT trader is attempting to buy lower prices during a bullish narrative.
The model is not:
Price breaks the high → Buy the breakout
Instead:
Bullish narrative established → Wait for discount retracement → Buy the retracement
After entry, the trader anticipates a run toward liquidity above current price.
Bullish Scalping Targets
The first potential objective is a retest of the high of the day.
Another important objective is the previous day’s high.
The target sequence may be:
High of day → Previous day’s high → Target 1 → Target 2 → Symmetrical price swing
Not every setup will reach every target.
The trader should understand that these levels are potential profit objectives rather than guaranteed destinations.
The purpose of the model is to identify logical areas where price may seek liquidity or complete a measured expansion.
Bearish ICT New York Scalping Model
The bearish model is the inverse.
First, the daily directional bias should be bearish.
The trader then studies the London session.
In a bearish model, price may trade above the midnight New York opening price before rejecting higher prices.
The expected sequence is:
Bearish daily bias → Price rallies above midnight open → Higher prices rejected → London declines
Huddleston suggests looking for a London decline of approximately 25 to 30 pips or more as evidence of meaningful bearish price delivery.
Once London demonstrates bearishness, the trader waits for New York.
The complete model becomes:
Bearish daily bias → Bearish London session → Wait until 07:00 → Retracement higher → OTE short → Target liquidity below
The New York session is expected to retrace from a swing low created during London’s decline.
The trader waits for price to move higher instead of selling at the lowest price of the London move.
Bearish Optimal Trade Entry
After 07:00 New York time, wait for price to retrace approximately 20 pips higher.
Measure the retracement using the Fibonacci tool.
When price reaches approximately the 62% retracement level, the trader can begin watching for a potential short setup.
The model is:
London declines → New York retraces 20+ pips higher → 62% OTE → Sell higher prices → Target lows
This reflects a basic institutional trading principle taught throughout ICT concepts:
Buy when price is offered lower in bullish conditions.
Sell when price is offered higher in bearish conditions.
As Huddleston emphasizes in the bearish model, the trader wants to be selling short as price goes higher, not chasing price after a large decline.
Bearish Scalping Targets
After a bearish OTE entry, the trader can anticipate price returning toward:
- Intraday low
- Low of the day
- Previous day’s low
- Target 1
- Target 2
- Symmetrical price swing
The basic target progression is:
Intraday low → Previous day’s low → Fibonacci expansion objectives
The initial low created during the London decline can be an important liquidity objective.
If price trades through the low, the previous day’s low may become the next target.
A Simple Bullish Scalping Process
The bullish model can be summarized as:
Step 1: Confirm bullish daily bias
Expect higher prices based on higher-timeframe price action.
Step 2: Study London
Look for an attempt lower followed by rejection and bullish expansion.
Step 3: Wait until 07:00 New York time
Do not chase London’s rally.
Step 4: Wait for a 20+ pip retracement
Allow New York to trade lower.
Step 5: Measure the retracement
Use the recent price swing.
Step 6: Monitor the 62% OTE
Look for a potential long setup.
Step 7: Define the liquidity target
High of day or previous day’s high.
Step 8: Manage toward expansion targets
Consider Target 1, Target 2, or a symmetrical price swing.
The sequence is:
Bullish bias → Bullish London → New York retracement → OTE long → Run on buy-side liquidity
A Simple Bearish Scalping Process
The bearish model follows the opposite sequence.
Step 1: Confirm bearish daily bias
Expect lower prices.
Step 2: Study London
Look for a rally above the midnight open followed by rejection.
Step 3: Confirm meaningful London decline
Prefer approximately 25 to 30 pips or more of bearish displacement.
Step 4: Wait until 07:00 New York time
Allow the New York session to begin.
Step 5: Wait for a 20+ pip retracement higher
Do not chase lower prices.
Step 6: Monitor the 62% OTE
Look for a short setup at higher prices.
Step 7: Target liquidity below
Intraday low or previous day’s low.
The sequence is:
Bearish bias → Bearish London → New York retracement → OTE short → Run on sell-side liquidity
When to Expect a Possible Reversal
Not every London move should continue during New York.
The 60-minute chart can help traders identify potential reversal conditions.
Look for an obvious old high or old low that previously caused a significant price reaction.
For example, suppose price is bearish and approaching an old hourly low.
If that hourly low previously caused a strong bullish reaction, price may react from the level again.
This does not guarantee a reversal.
Huddleston openly explains:
“I don’t know that.”
He makes this statement while discussing whether an old high or low will definitely hold price.
The lesson is extremely important.
Trading is not about knowing with certainty that every reference point will create a reversal.
Instead, traders use historical price behavior to identify areas where a reaction is reasonable to anticipate.
Avoid Trading Directly Into Hourly Reversal Levels
Suppose you are considering a short trade.
Directly below current price is a significant 60-minute old low that previously produced a major rally.
The short setup may have limited space to develop.
The trader should ask:
Am I selling directly into a potential hourly reversal point?
If the answer is yes, the trade may be avoided.
Alternatively, the trader may need to be very quick with profit-taking.
The same rule applies to bullish setups.
Do not automatically buy directly below a significant 60-minute old high that previously caused a major bearish reaction.
The logic is:
Bullish trade + Major hourly high immediately above = Limited upside opportunity
Bearish trade + Major hourly low immediately below = Limited downside opportunity
This hourly framework acts as a trade filter.
Continuation Setup vs Reversal Setup
One of the most important distinctions in Mastering High Probability Scalping Vol. 3 is understanding whether New York is likely to continue London’s move or reverse it.
Continuation Model
Use the continuation model when:
Daily bias agrees with London price delivery
For example:
Bullish daily bias + Bullish London = Look for New York long continuation
Or:
Bearish daily bias + Bearish London = Look for New York short continuation
Potential Reversal Model
A reversal may become more likely when London drives price into a significant hourly old high or low.
For example:
Bearish London decline → Significant hourly old low → Strong rejection → Bullish market structure break
The following session or trading day may then provide a classic bullish setup.
The trader should always consider where London has delivered price on the higher timeframe.
Risk 1% Per Setup While Learning
Risk management is one of the most important parts of the scalping model.
Huddleston recommends considering approximately 1% risk per setup while practicing and developing consistency.
A trader may gradually consider increasing risk toward 2% if it fits their risk tolerance and experience.
However, risking more than 2% is strongly discouraged for inexperienced traders.
Huddleston warns that excessive risk and overleveraging can severely damage trader development and equity growth.
The preferred progression is:
Start with controlled risk → Build consistency → Gain experience → Consider gradual adjustment
Not:
Increase leverage → Chase fast growth → Recover losses aggressively
The purpose of risk management is survival.
ICT Position Size Example
Suppose a demo trading account contains $1,000.
The trader decides to risk 1%.
The maximum risk is:
$1,000 × 1% = $10
Suppose the stop loss is 20 pips.
The allowed dollar risk per pip is:
$10 ÷ 20 pips = $0.50 per pip
The trader would therefore use a position size that produces approximately $0.50 per pip.
The calculation is:
Account risk ÷ Stop distance = Maximum risk per pip
In this example:
$10 ÷ 20 = $0.50 per pip
If the stop is reached, the loss should remain close to the predefined 1% risk, excluding commissions and trading costs.
The important point is that the position size is determined by the stop loss and account risk.
The trader does not choose a random lot size first.
Why Overleveraging Destroys Scalpers
Scalping provides frequent market movement.
This can create the temptation to use excessive leverage.
A trader may think:
The target is small, so I need a large position size.
This is dangerous.
Overleveraging can cause:
- Emotional decision-making
- Fear of normal retracements
- Premature exits
- Moving stop losses
- Revenge trading
- Large account drawdowns
Huddleston specifically warns traders not to attempt to grow accounts faster by taking oversized risks.
The goal should be responsible equity growth, not short-term excitement.
Using Partial Profits
Partial profit-taking can help traders manage the psychological pressure of holding an open position.
Suppose a long trade begins moving higher.
The trader may take a portion of the position off at the first logical price objective.
This can provide two benefits:
Partial profit realized → Position risk reduced
Huddleston explains that taking something off a trade may help reduce the strong desire to prove the trade is correct.
The trader has already realized some profit and may find it easier to manage the remaining position.
A possible model is:
Entry → First profit objective → Take partial → Target 1 → Manage stop → Target 2 → Symmetrical price swing
However, there is no universal percentage that must always be removed at every target.
Managing the Trade With Target 1 and Target 2
Another approach is to hold the complete position until Target 1.
Once Target 1 is reached:
Move stop to breakeven → Continue toward Target 2
At Target 2, the trader may take a portion of the trade off.
The stop can then be moved behind a logical Fibonacci reference or recent price structure.
The remaining position may target the symmetrical price swing.
A possible sequence is:
Entry → Target 1 → Breakeven stop → Target 2 → Partial profit → Symmetrical price swing
This provides a structured framework.
However, Huddleston also makes it clear that trade exits are highly personal and can require significant screen time and market experience.
There Is No Perfect Exit Strategy
Many traders spend years trying to create the perfect entry.
But exits can be even more difficult.
Huddleston openly describes exits as one of the areas he continually attempts to improve.
Sometimes a trader takes profit early and price continues much farther.
Sometimes a trader holds for a larger objective and price reverses.
Sometimes Target 1 is reached but Target 2 is not.
There is no way to guarantee the perfect exit on every trade.
The trader must develop a repeatable process.
For example:
Conservative trader → Take partial profit early
Balanced trader → Partial at Target 1 and Target 2
Aggressive trader → Hold toward symmetrical price swing
The most important requirement is to determine the management process before emotion controls the decision.
Use Open, High, Low, and Close
One of the strongest lessons in this ICT (Inner Circle Trader) scalping series is the importance of studying raw price.
New traders often cover their charts with indicators.
They use:
- Oscillators
- Moving averages
- Trend indicators
- Signal tools
- Multiple automated systems
This can distract the trader from the actual price behavior.
Huddleston states:
“Open, high, low and close is the four best indicators you’re ever going to find in price action.”
The open, high, low, and close provide the information needed to study:
- Directional movement
- Liquidity
- Session behavior
- Swing formation
- Manipulation
- Expansion
The foundation of the model is price itself.
Mastering High Probability Scalping Vol. 3 Checklist
Before considering a New York scalp, ask:
Direction
What is the daily directional bias?
Bullish or bearish?
London Session
Did London confirm the expected direction?
Was there rejection before expansion?
Higher Time Frame Obstacle
Is price approaching a significant 60-minute old high or low?
Time
Is it after 07:00 New York time?
Retracement
Has price retraced approximately 20 pips or more?
Deadline
Did the setup form before approximately 09:00 New York time?
Entry
Has price reached the 62% OTE retracement area?
Target
Is the objective:
- High of day?
- Low of day?
- Previous day’s high?
- Previous day’s low?
- Target 1?
- Target 2?
- Symmetrical price swing?
Risk
Is account risk controlled near the predefined percentage?
The complete decision process is:
Daily bias → London confirmation → Check hourly reversal levels → Wait for 07:00 → 20-pip retracement → 62% OTE → Enter → Target liquidity → Manage risk
Final Thoughts on Mastering High Probability Scalping Vol. 3
Mastering High Probability Scalping Vol. 3 brings the ICT high-probability scalping framework into a more complete trading model.
The trader begins with daily bias.
London provides directional confirmation.
The 60-minute chart helps identify potential reversal points.
New York provides the retracement.
The 62% Optimal Trade Entry provides a potential entry location.
Previous-day liquidity and Fibonacci objectives provide logical targets.
Risk management protects the trading account.
The basic bullish model is:
Bullish daily bias → Bullish London → 07:00 New York → Retracement lower → 62% OTE long → Target highs
The basic bearish model is:
Bearish daily bias → Bearish London → 07:00 New York → Retracement higher → 62% OTE short → Target lows
The real advantage of the model is not constant trading.
It is having something specific to look for.
As Michael J. Huddleston teaches throughout the ICT Forex – Market Maker Primer Course, traders should focus on recognizable price behavior, liquidity, time, and risk rather than distracting themselves with unnecessary tools.
Mastering high-probability scalping ultimately requires patience, chart study, strict risk controls, and repeated observation of the same price delivery concepts.