Open Interest Secrets & Smart Money Footprints is an ICT framework for reading how money flows into and out of the futures market. Michael J. Huddleston, the founder of ICT (Inner Circle Trader) concepts, teaches traders to combine open interest with higher-time-frame price levels, Commitment of Traders data, institutional order flow and the ICT PD Array Matrix.
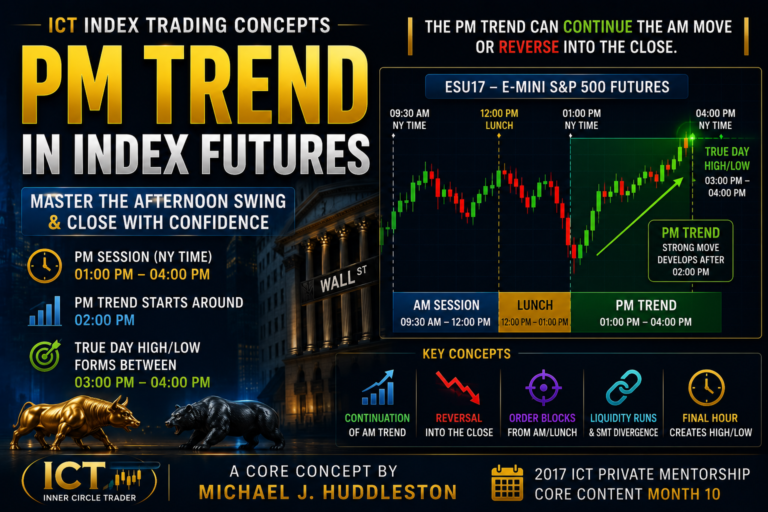
This concept is taught in the 2017 ICT Private Mentorship Core Content Month 10.
Open interest should not be used as a standalone indicator. A rise or decline in open interest means very little unless the trader also understands where price is trading and whether the market is trending or consolidating.
As Michael J. Huddleston explains:
“The study of open interest can provide a trader a very important perspective in a commodity.”
The real value of open interest appears when it reveals whether commercial traders are adding positions, covering positions or quietly preparing for a larger price move.
What Is Open Interest?
Open interest is the total number of outstanding futures contracts held by market participants at the end of a trading session.
Every futures contract requires:
- One buyer
- One seller
- One open contract
A buyer and seller together create one contract, not two contracts.
Open interest increases when new contracts are created.
Open interest decreases when existing contracts are closed.
This is different from volume.
Volume measures how many contracts are traded during a specific period.
Open interest measures how many contracts remain open.
Volume can reveal the intensity of trading activity, while open interest helps measure whether money is entering or leaving the market.
Huddleston describes the difference clearly:
“Where volume measures the pressure or intensity behind a price trend, open interest measures the flow of money into a futures market.”
Why Open Interest Matters
Open interest provides two main forms of information.
First, it can help determine whether a price trend has enough participation or sponsorship to continue.
Second, it can reveal the footprints of commercial traders and professional market participants.
The basic open interest questions are:
- Is price rising or falling?
- Is open interest rising or falling?
- Is price trending or consolidating?
- Is price at higher-time-frame support or resistance?
- Are commercials net long or net short?
- Is current open interest above or below its normal seasonal average?
Open interest becomes much more useful when these questions are studied together.
Rising Price and Rising Open Interest
When price is rising and open interest is also rising, the condition is generally bullish.
New traders are entering the market and creating additional contracts.
New buyers are supporting the trend, while new sellers are taking the other side.
As price continues higher:
- Strong longs remain in control
- Weak shorts are stopped out
- New sellers enter at higher prices
- The market continues receiving new sponsorship
This combination suggests that the bullish trend still has active participation.
The trader should not assume that every rise in open interest guarantees higher prices. However, rising price combined with rising open interest generally supports continuation until price reaches a meaningful Premium PD Array or higher-time-frame objective.
Falling Price and Rising Open Interest
When price is falling and open interest is rising, the condition is generally bearish.
New contracts are being created as the market moves lower.
Weak longs are being stopped out, but new buyers are still entering and attempting to catch the decline.
At the same time:
- Strong shorts remain positioned
- New short sellers may enter
- New buyers become trapped
- The decline receives additional sponsorship
As long as open interest continues rising during a major downtrend, the market may have enough participation to continue lower.
Huddleston summarises this principle:
“As long as the open interest is increasing in a major trend, it will have the necessary sponsorship to continue.”
Rising Price and Falling Open Interest
When price is rising but open interest is falling, the condition can become bearish.
This often means the rise is being supported by position liquidation rather than fresh buying.
Old longs may be taking profits and closing their positions.
Weak shorts may also be covering losing trades.
Price can continue higher temporarily because short covering creates buying pressure. However, declining open interest indicates that fewer contracts remain open.
The rally may therefore lack the new sponsorship required for long-term continuation.
This condition can warn of:
- Long liquidation
- Short covering
- Weakening bullish participation
- A mature trend
- Potential distribution near resistance
The trader should pay particular attention if this combination develops at a higher-time-frame Premium Array.
Falling Price and Falling Open Interest
When price is falling and open interest is also falling, the condition can become bullish.
This often means profitable shorts are covering their positions.
Weak longs may also be liquidating, but the supply of losing long positions is gradually being exhausted.
As the old shorts take profits:
- Selling pressure decreases
- Fewer contracts remain open
- New longs may enter at lower prices
- The downtrend may begin losing sponsorship
Huddleston explains the principle this way:
“When the supply of losers is exhausted, the downtrend ends.”
This condition becomes more meaningful when it appears at a higher-time-frame Discount Array or long-term support level.
Open Interest Rules in Trending Markets
The four basic trend relationships can be summarised as follows:
Price Rising and Open Interest Rising
Generally bullish.
The trend is receiving new participation.
Price Falling and Open Interest Rising
Generally bearish.
The decline is receiving new participation.
Price Rising and Open Interest Falling
Potentially bearish.
The rally may be driven by short covering and long liquidation.
Price Falling and Open Interest Falling
Potentially bullish.
The decline may be driven by liquidation and short covering.
These relationships provide context, but they do not replace technical analysis.
A trader must still determine:
- Where price is located
- Whether institutional order flow is bullish or bearish
- Whether liquidity has been taken
- Whether price is at premium or discount
- Whether commercials support the directional expectation
Open Interest in Consolidations
Open interest can become especially useful when price is consolidating.
A consolidation hides direction because price is not making a clear series of higher highs or lower lows.
Open interest may reveal what is developing behind the range.
The two main consolidation conditions are:
- Rising open interest inside a range
- Falling open interest inside a range
The interpretation depends heavily on the higher-time-frame location.
Rising Open Interest During Consolidation
When price is consolidating and open interest is rising, the condition is generally bearish.
Retail traders often interpret the range as accumulation and buy in expectation of an upside breakout.
Commercial hedgers and professional traders may be taking the opposite side.
Rising open interest suggests that new contracts are being created while price remains unable to advance.
This may indicate:
- Commercial selling
- Short accumulation
- Weak speculative buying
- Distribution near resistance
- Preparation for a downside break
Commercial traders are often major liquidity providers in commodity markets.
When they are willing to sell increasingly large quantities without allowing price to rise, it may indicate they do not expect higher prices.
The condition becomes more bearish when:
- Price is at higher-time-frame resistance
- Price is trading within a Premium PD Array
- Commercial traders are net short
- Commercial short positions are increasing
- Buy-side liquidity has already been taken
- Institutional order flow is bearish
Falling Open Interest During Consolidation
When price is consolidating and open interest is falling, the condition is generally bullish.
Commercial traders who were previously short may be covering their positions.
At the same time, uninformed traders may continue shorting the range and expecting a downside breakout.
Falling open interest suggests contracts are being closed rather than created.
The condition becomes more bullish when:
- Price is at higher-time-frame support
- Price is trading within a Discount PD Array
- Commercial traders are net long
- Commercial short positions are being covered
- Sell-side liquidity has already been taken
- Institutional order flow is bullish
This combination may reveal that the market is preparing for an upside expansion.
Higher-Time-Frame Location Is Essential
Open interest should always be connected to a meaningful price level.
A decline in open interest in the middle of an insignificant range may not provide useful information.
The same decline at a monthly or weekly support level can be highly significant.
For a bullish setup, ICT looks for:
- Higher-time-frame support
- Discount PD Array
- Bullish order block
- Bullish breaker
- Sell-side liquidity sweep
- Commercial bullishness
- Declining open interest during consolidation
For a bearish setup, ICT looks for:
- Higher-time-frame resistance
- Premium PD Array
- Bearish order block
- Bearish breaker
- Buy-side liquidity sweep
- Commercial bearishness
- Rising open interest during consolidation
The higher-time-frame level provides the location.
Open interest provides evidence of how market participants are behaving at that location.
Seasonal Average of Open Interest
Actual open interest should also be compared with its historical or seasonal average.
Open interest naturally changes around:
- Futures contract expirations
- Delivery months
- Rollover periods
- Seasonal production cycles
- Regular hedging periods
For this reason, simply observing that open interest has risen or fallen may not be enough.
The trader should compare:
- Current actual open interest
- The multi-year average of open interest for the same time of year
A seasonal open interest chart may display:
- A solid line for actual open interest
- A dotted line for the multi-year average
The difference between the two lines reveals whether current activity is unusually strong or unusually weak.
Open Interest Above Its Seasonal Average
When actual open interest rises above its normal seasonal average, participation is stronger than usual.
This becomes particularly bearish when:
- Price is consolidating near resistance
- Price is within a Premium Array
- Commercials are net short
- Open interest is rising beyond the seasonal norm
- Institutional order flow is bearish
The unusually high open interest suggests aggressive position building.
If commercial traders are the dominant sellers, the range may eventually break lower.
Open Interest Below Its Seasonal Average
When actual open interest falls below its normal seasonal average, participation is weaker than usual.
This becomes particularly bullish when:
- Price is consolidating near support
- Price is within a Discount Array
- Commercials are net long
- Open interest falls sharply below the seasonal norm
- Institutional order flow is bullish
This may indicate aggressive short covering by commercial traders.
The decline is not merely part of a normal contract rollover. It is unusually large compared with the historical average.
This difference can reveal a Smart Money footprint that is not obvious from price alone.
Why Contract Rollover Is Not the Complete Explanation
Open interest often declines near futures contract expiration.
Some traders dismiss every open-interest decline as a rollover effect.
However, traders who remain bullish or bearish usually transfer their positions from the expiring contract into the next active contract.
They close the nearby contract and establish a similar position in the next delivery month.
This one-for-one transfer allows open interest to remain visible across the market.
Therefore, the trader should not assume that every large change is meaningless.
The important question is whether actual open interest is behaving normally compared with its seasonal average.
An unusually large decline below the seasonal average can carry a different message from an ordinary rollover decline.
Smart Money Footprints
Commercial traders cannot completely hide their activity.
Their buying, selling, hedging and position liquidation eventually appear through:
- Commitment of Traders data
- Open interest
- Price reaction
- Seasonal open-interest deviations
- Institutional order flow
- Higher-time-frame PD Arrays
The footprint becomes clear when several pieces of evidence agree.
For example, a bullish Smart Money footprint may include:
- Commercials net long
- Commercial positions becoming more bullish
- Price at a weekly Discount Array
- Price consolidating at support
- Open interest falling
- Actual open interest dropping below its seasonal average
- Bullish displacement after the consolidation
A bearish Smart Money footprint may include:
- Commercials net short
- Commercial positions becoming more bearish
- Price at a weekly Premium Array
- Price consolidating at resistance
- Open interest rising
- Actual open interest rising above its seasonal average
- Bearish displacement after the consolidation
Huddleston states:
“They can’t hide what they’re doing.”
The objective is not to predict every short-term move. It is to recognise the few occasions each year when commercial activity, price location and market structure strongly align.
British Pound Example
A historical British pound example demonstrates how open interest can confirm a bullish setup.
The higher-time-frame context included:
- A monthly bullish order block
- A weekly bullish breaker
- Price trading near the 1.53 area
- Commercial traders net long
- Price consolidating near higher-time-frame support
During this consolidation, open interest declined sharply.
More importantly, actual open interest fell below its normal seasonal average.
This suggested that commercial traders were covering short positions while price remained supported.
The combination included:
- Discount pricing
- Bullish institutional order flow
- Commercial bullishness
- Declining open interest
- A strong deviation below the seasonal average
Price subsequently rallied approximately 800 points, or around 800 pips in the corresponding forex market.
The open-interest decline did not create the setup by itself. It confirmed the activity taking place at an important bullish price level.
Euro Example
A similar condition developed in the euro.
The higher-time-frame analysis included:
- Commercial traders net long
- A previous extreme bullish commercial reading
- Price returning to a weekly bullish order block
- Support near the 1.26 area
- A small daily consolidation
Open interest then declined sharply below its normal seasonal average.
This indicated that the decline in open contracts was much greater than an ordinary seasonal change.
The setup combined:
- Higher-time-frame support
- Bullish commercial positioning
- Discount pricing
- Consolidation
- Abnormally weak open interest
- Short covering
- Bullish institutional order flow
Price later rallied approximately 1,500 points.
The speed of the advance showed that the market had strong macro sponsorship once the consolidation ended.
Open Interest Is Not a Day-Trading Signal
Open-interest analysis is primarily designed for:
- Swing trading
- Position trading
- Quarterly market analysis
- Macro directional bias
- Finding major price expansions
Open interest is not usually intended to generate a new signal every day or every week.
Instead, it helps the trader identify larger moves that may occur a few times during the year.
Once the higher-time-frame direction is established, the trader can use lower-time-frame ICT models for execution.
For example, after identifying a bullish macro setup, the trader may look for:
- Daily opens near the low of the day
- Bullish London or New York session setups
- One Shot One Kill weekly expansions
- Bullish fair value gaps
- Bullish order blocks
- Sell-side liquidity sweeps
- Higher Friday closes
- Weekly expansion above the opening price
The macro open-interest framework provides the directional foundation.
The lower time frame provides the entry.
Combining Open Interest With Commitment of Traders
Open interest becomes more powerful when combined with the Commitment of Traders report.
The COT report helps identify:
- Whether commercials are net long or net short
- Whether commercials are increasing or reducing exposure
- Whether a hedging buy program is developing
- Whether a hedging sell program is developing
- Whether commercial positioning is near an extreme
Open interest then reveals whether contracts are being created or closed.
A bullish combination may include:
- Commercials net long
- Commercial net position improving
- Price at discount
- Open interest falling during consolidation
- Actual open interest below its seasonal average
A bearish combination may include:
- Commercials net short
- Commercial net position weakening
- Price at premium
- Open interest rising during consolidation
- Actual open interest above its seasonal average
The COT report provides the positioning context.
Open interest provides the participation and liquidation context.
Combining Open Interest With the PD Array Matrix
The ICT PD Array Matrix identifies where price is likely to find support, resistance or an objective.
Bullish reference points may include:
- Bullish order block
- Bullish breaker
- Fair value gap
- Liquidity void
- Previous low
- Discount range
- Weekly or monthly support
Bearish reference points may include:
- Bearish order block
- Bearish breaker
- Fair value gap
- Liquidity void
- Previous high
- Premium range
- Weekly or monthly resistance
Open interest should be interpreted at these institutional reference points.
A rising open-interest line at an insignificant location may not offer a trade.
The same rise at a monthly Premium Array, combined with commercial shorting, can support a major bearish expectation.
Bullish Open Interest Model
A high-quality bullish model may include:
- Price reaches monthly or weekly support.
- Price trades into a Discount PD Array.
- Sell-side liquidity is taken.
- Commercial traders are net long or becoming more bullish.
- Price begins consolidating.
- Open interest declines during the consolidation.
- Actual open interest falls below its seasonal average.
- Bullish displacement forms.
- Price retraces into a lower-time-frame bullish PD Array.
- The trader targets a higher-time-frame Premium Array.
The decline in open interest suggests that shorts are covering and the downtrend is losing sponsorship.
Bearish Open Interest Model
A high-quality bearish model may include:
- Price reaches monthly or weekly resistance.
- Price trades into a Premium PD Array.
- Buy-side liquidity is taken.
- Commercial traders are net short or becoming more bearish.
- Price begins consolidating.
- Open interest rises during the consolidation.
- Actual open interest rises above its seasonal average.
- Bearish displacement forms.
- Price retraces into a lower-time-frame bearish PD Array.
- The trader targets a higher-time-frame Discount Array.
The increase in open interest suggests that commercial sellers are building positions while uninformed buyers become trapped.
Common Open Interest Mistakes
Reading Open Interest Without Price
Open interest must be compared with the direction and structure of price.
A rise in open interest can be bullish or bearish depending on what price is doing.
Ignoring Higher-Time-Frame Location
The most meaningful signals occur at major support, resistance, Premium Arrays or Discount Arrays.
Treating Every Decline as Bullish
Falling open interest is not automatically bullish.
Its meaning depends on whether price is rising, falling or consolidating.
Treating Every Increase as Bearish
Rising open interest is not automatically bearish.
During an established uptrend, it may confirm bullish sponsorship.
Ignoring Seasonal Averages
A normal rollover-related decline may not carry the same meaning as an abnormal decline below the multi-year average.
Using Open Interest as a Precise Entry Signal
Open interest establishes context.
Market structure, liquidity and PD Arrays should provide the actual entry.
Applying One Commodity’s Open Interest to Another
Open interest belongs to the individual market being analysed.
A decline in one commodity’s open interest does not automatically predict movement in another commodity.
Expecting Frequent Signals
The best open-interest conditions may only appear a few times each year.
Quality is more important than frequency.
Open Interest Analysis Checklist
Before using open interest, confirm:
- Is price trending or consolidating?
- Is price rising or falling?
- Is open interest rising or falling?
- Is price at higher-time-frame support or resistance?
- Is price in premium or discount?
- Are commercials net long or net short?
- Is the commercial position becoming more bullish or bearish?
- Is actual open interest above or below its seasonal average?
- Is the change greater than a normal rollover movement?
- Has buy-side or sell-side liquidity been taken?
- Is institutional order flow aligned?
- Is price respecting the relevant PD Array?
- Has displacement confirmed the expected direction?
- Is the setup appropriate for a swing or position trade?
- Is there a clear higher-time-frame target?
Final Thoughts
Open Interest Secrets & Smart Money Footprints is not a simple formula based on whether open interest rises or falls.
Its real value comes from combining several forms of analysis:
- Price direction
- Consolidation or trend conditions
- Higher-time-frame support and resistance
- Premium and Discount Arrays
- Commitment of Traders positioning
- Seasonal open-interest averages
- Institutional order flow
Rising open interest can confirm trend sponsorship.
Falling open interest can reveal liquidation and short covering.
Inside consolidations, rising open interest near resistance can warn of distribution, while falling open interest near support can reveal accumulation and commercial short covering.
The strongest setups appear when open interest behaves unusually at an important higher-time-frame level and agrees with commercial positioning.
As Michael J. Huddleston explains:
“Open interest declining at supports or Discount Arrays, or open interest increasing while at resistance levels or Premium Arrays, we can anticipate much stronger moves.”
Open interest is therefore best used as a macro filter. It helps traders identify the few periods when Smart Money activity, institutional price levels and market participation align for a potentially significant move.
All examples and concepts discussed here are for educational and paper-trading purposes. Futures, forex and commodity trading involve substantial risk, and open-interest analysis cannot guarantee future results.