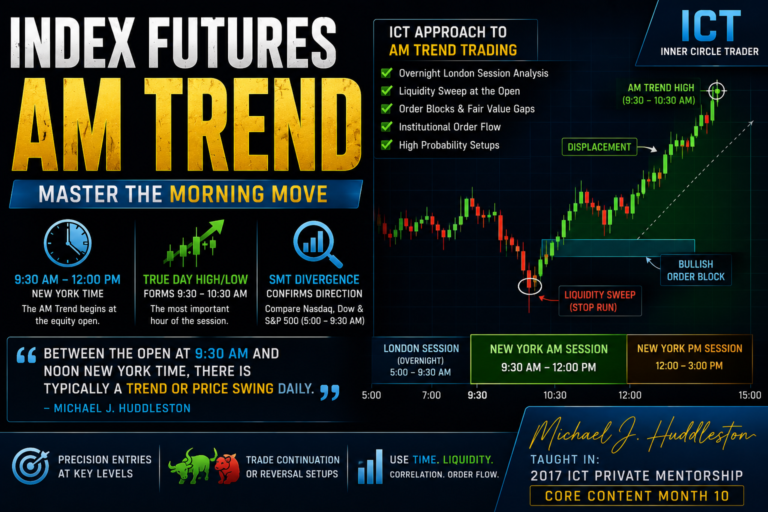
Commodity Seasonals Tendencies describe the recurring periods during the year when a commodity has historically shown a greater tendency to rise, decline, form a high or create a low. Michael J. Huddleston, the founder of ICT (Inner Circle Trader) concepts, teaches traders to use these seasonal patterns as a directional framework rather than as automatic trade signals.
This concept is taught in the 2017 ICT Private Mentorship Core Content Month 10.
Seasonal tendencies can help a trader understand what a market would normally be expected to do during a particular month or season. However, they must always be combined with market structure, commercial positioning, institutional order flow and ICT Premium and Discount Arrays.
As Michael J. Huddleston explains:
“Seasonal tendencies are like a road map or like a treasure map.”
They show the normal historical expectation, but they do not guarantee that price will follow the same path every year.
What Are Commodity Seasonals Tendencies?
Commodity seasonal tendencies are recurring price patterns that appear during similar periods of the calendar year.
These tendencies may develop because of:
- Planting and harvesting cycles
- Weather conditions
- Consumer demand
- Manufacturing requirements
- Holiday consumption
- Storage and transportation needs
- Supply shortages
- Production cycles
- Commercial hedging activity
Agricultural commodities are strongly affected by natural production cycles.
Energy commodities may respond to seasonal demand.
Metals may be influenced by manufacturing, investment and jewellery demand.
Because these behaviours repeat each year, historical price data may reveal certain months when a commodity has a greater probability of becoming bullish or bearish.
However, a seasonal tendency is not an absolute forecast.
Huddleston warns:
“Panaceas don’t exist. Be-all, end-alls don’t exist in trading, and certainly seasonal tendencies are not one.”
Seasonality should therefore be used as a supporting factor rather than the only reason for entering a trade.
How ICT Interprets Seasonal Tendencies
The ICT approach studies two important questions:
- What should the commodity normally do during this time of year?
- Is current price action confirming or rejecting that seasonal expectation?
When price follows its normal seasonal pattern, the tendency may support the trader’s directional bias.
When price moves against the normal tendency, that disagreement can also provide valuable information.
For example, suppose a commodity normally declines during April and May, but price remains strong and continues higher.
That relative strength may indicate:
- Strong commercial demand
- Limited available supply
- Bullish institutional order flow
- Commercial hedging purchases
- A developing long-term bullish condition
Likewise, if a market is normally bullish during a certain period but continues falling, it may indicate excessive supply or weak demand.
The failure of a seasonal tendency can therefore be just as informative as its successful appearance.
How Seasonal Charts Are Analysed
A seasonal chart usually combines several years of historical price data into a single annual pattern.
In the teaching, two important seasonal lines are compared:
- A long-term pattern based on approximately 40 years of data
- A shorter-term pattern based on approximately 15 years of data
The strongest seasonal tendencies appear when the long-term and short-term patterns move in a similar direction.
For example, if both the 15-year and 40-year seasonal studies show a commodity rising from February into June, the bullish tendency is considered more reliable.
The trader should look for:
- Agreement between the short-term and long-term seasonal lines
- Similar periods for highs and lows
- Sustained directional movement
- Repetition across individual historical years
- Confirmation from current price action
Seasonal studies should be compared with actual weekly charts over many years.
A trader should not rely only on the most recent few years. The greater the historical sample, the more useful the study may become.
Seasonal Tendencies and Futures Contract Selection
Commodities trade through futures contracts with different delivery months.
For example, soybean futures may include contracts for:
- March
- May
- July
- August
- September
- November
- January
The trader should generally study the nearby active contract.
The nearby contract usually has the greatest:
- Trading volume
- Open interest
- Liquidity
- Institutional participation
When one futures contract approaches expiration, trading activity gradually moves into the next active delivery month.
The easiest method is to compare the volume and open interest of available contracts. The contract with the strongest participation is usually the most appropriate one for analysis.
Some commodities may not always follow a perfectly sequential contract cycle. Gold, for example, may have greater activity in particular delivery months.
Soybean Seasonal Tendencies
Soybeans often display one of the clearer agricultural seasonal patterns.
The general tendency includes:
- A seasonal low near January or February
- A rally from February into June or July
- A seasonal high near June or July
- A decline into September or October
- A seasonal low near September or October
This creates three possible seasonal phases.
Early-Year Bullish Phase
Soybeans often become bullish from February into the middle of the year.
The trader may look for:
- Bullish institutional order flow
- Discount PD Arrays
- Commercial buying
- Bullish order blocks
- Sell-side liquidity sweeps
Mid-Year Bearish Phase
A seasonal high may form during June or July.
If market structure becomes bearish, the trader may anticipate a decline into September or October.
Autumn Bullish Phase
September or October may produce another seasonal low.
This low can sometimes begin a longer-term rally into the following year.
The strongest soybean setups occur when the seasonal tendency agrees with the broader market trend and commercial positioning.
Wheat and Corn Seasonal Tendencies
Wheat
Wheat may decline during the first half of the year and form a seasonal low between late June and August.
The general tendencies include:
- Bearishness from January into the summer
- Potential low during July or August
- Another possible buying opportunity around November
When wheat is in a strong bear market, the best seasonal opportunity may be selling near the beginning of the year.
When wheat is in a bull market, the July, August or November seasonal lows may provide better opportunities for long-term buying.
Wheat seasonality can be less consistent than some other commodities, so technical confirmation is especially important.
Corn
Corn frequently forms a seasonal high during May or June.
Price may then decline into September or October.
The general pattern is:
- Potential high in May or June
- Bearish tendency through the summer
- Seasonal low in September or October
If corn should be declining during the spring but instead remains supported and moves higher, it may reveal underlying relative strength.
This failure to follow the normal bearish seasonal tendency can indicate strong demand or limited supply.
Livestock Seasonal Tendencies
Feeder Cattle
Feeder cattle often form a seasonal low during the spring.
The low may appear as early as February, but the stronger bullish period often begins during April or May.
The market may then rally into August, September or October.
The general tendency is:
- Buy during the spring
- Expect strength during the summer
- Look for a high during late summer or early autumn
The seasonal tendency becomes more useful when feeder cattle are already showing bullish market structure.
Live Cattle
Live cattle may form a seasonal high during February or March and a seasonal low during June.
The stronger bullish period often develops from the middle of the year into the end of the year.
The general tendency includes:
- Potential selling pressure during February and March
- Seasonal low during June or July
- Bullish movement into the final months of the year
When the broader market is bearish, the February and March seasonal high can create strong short opportunities.
When market conditions turn bullish, the June or July seasonal low becomes more important.
Lean Hogs
Lean hogs are presented as one of the stronger seasonal markets.
The general pattern includes:
- Seasonal low during February, March or April
- Strong rally into May, June or July
- Seasonal high during early or mid-summer
- Decline into September or October
This pattern has historically appeared with considerable consistency.
Huddleston describes lean hogs as:
“The closest thing to perfection in terms of my ability to find and study things over historical data.”
Even with a strong historical pattern, the trader should still wait for technical and institutional confirmation before entering.
Cocoa, Orange Juice, Coffee and Cotton
Cocoa
Cocoa may form a seasonal low during late May or early June.
Price may then rally into August, September or October.
The general seasonal framework is:
- Potential low in May or June
- Bullish movement through the summer
- Potential high near September or October
Cocoa can produce strong directional moves when seasonality agrees with market structure and commercial positioning.
Orange Juice
Orange juice often forms a seasonal low during September or October.
The market may then rally into November or December.
The general tendency is:
- Look for a low around October
- Anticipate strength into the end of the year
Weather conditions can have a large impact on orange juice prices, so seasonal analysis should be combined with price action rather than treated as a fixed forecast.
Coffee
Coffee often forms a seasonal low during June or July.
The market may also form an important high during April or May.
The general seasonal tendencies include:
- Potential bearishness from April or May
- Seasonal low during June or July
- Potential rally after the summer low
Coffee can move aggressively when it begins trending, making its seasonal turning points useful for higher-time-frame analysis.
Cotton
Cotton has a historical tendency to decline during April or May.
The general pattern includes:
- Potential high during spring
- Bearish movement after April or May
However, when cotton remains bullish during a period when it should normally decline, it may indicate significant underlying strength.
A failed bearish seasonal tendency can therefore help identify a strong bull market.
Crude Oil, Copper, Gold and Silver
Crude Oil
Crude oil often shows bullish seasonal influence during the first half of the year.
The market may form a high during the summer or early autumn.
The general tendency includes:
- Potential low around the beginning of the year
- Rally during the first half of the year
- Seasonal high between June and October
- Weakness after the seasonal high
If crude oil fails to rally during its normally bullish period, it may suggest excessive supply.
A lack of seasonal strength can therefore warn that lower prices may follow.
Copper
Copper has less uniform seasonality than some other commodities.
Important seasonal periods may include:
- Potential buying opportunities during June
- Potential buying opportunities during November
- Possible selling opportunities during April
- Possible selling opportunities during September
Copper can move strongly when it is already bullish and the seasonal tendency supports a move from a Discount Array.
Gold
Gold is primarily treated as a seasonal buying market.
The main tendency is:
- Look for a low during July or August
- Anticipate bullishness after the summer low
The seasonal pattern may be connected with jewellery demand and preparation for holiday sales later in the year.
A January or February decline can sometimes provide a short opportunity, but the main ICT focus is the July or August seasonal low.
Silver
Silver has a seasonal pattern similar to gold.
The main tendency is:
- Look for a seasonal low during July or August
- Focus primarily on bullish opportunities
Silver can become extremely volatile during major bull markets.
When the summer seasonal low agrees with bullish institutional order flow and commercial buying, the market may produce a strong longer-term move.
How to Blend Seasonality With ICT Concepts
Commodity Seasonals Tendencies should never be used independently.
The best approach is to combine seasonality with several ICT tools.
Seasonal Direction
Determine whether the market is entering a historically bullish or bearish period.
Commitment of Traders
Study whether commercial traders are increasing or decreasing their net exposure.
Look at:
- The commercial zero-line position
- Six-month commercial range
- Twelve-month commercial range
- Hedging buy programs
- Hedging sell programs
Institutional Order Flow
Determine whether price is respecting bullish or bearish PD Arrays.
Bullish institutional order flow may include:
- Bullish order blocks holding
- Bearish PD Arrays failing
- Short-term highs being broken
- Discount Arrays supporting price
Bearish institutional order flow may include:
- Bearish order blocks holding
- Bullish PD Arrays failing
- Short-term lows being broken
- Premium Arrays resisting price
Premium and Discount
During a bullish seasonal period, look for long setups from Discount Arrays.
During a bearish seasonal period, look for short setups from Premium Arrays.
Liquidity
Identify the likely liquidity objective.
A bullish seasonal setup may target:
- Old highs
- Buy-side liquidity
- Relative equal highs
- Premium PD Arrays
A bearish seasonal setup may target:
- Old lows
- Sell-side liquidity
- Relative equal lows
- Discount PD Arrays
When Price Rejects Its Seasonal Tendency
A market that moves against its normal seasonal tendency is providing important information.
Suppose a commodity normally falls during May, but price continues rising.
This may indicate:
- Strong demand
- Supply shortage
- Commercial accumulation
- Bullish relative strength
- A developing long-term trend
Suppose a commodity normally rallies during January and February, but price continues falling.
This may indicate:
- Excess supply
- Weak commercial demand
- Bearish institutional order flow
- A long-term distribution condition
Huddleston explains:
“If it’s not following the seasonal tendency, it’s telling you something.”
The trader should not force the historical tendency onto current price action.
Instead, the disagreement should be treated as market information.
Practical Monthly Seasonal Routine
A trader can create a monthly seasonal calendar for the commodities being followed.
At the beginning of each month, record:
- Commodities expected to become bullish
- Commodities expected to become bearish
- Markets expected to form a seasonal high
- Markets expected to form a seasonal low
- Markets moving against their seasonal tendency
Then analyse each market using:
- Weekly market structure
- Daily institutional order flow
- Commitment of Traders data
- Premium and Discount Arrays
- Commercial hedging activity
- Liquidity objectives
Do not search for a trade simply because a seasonal date has arrived.
Use the date as a reminder to begin looking for confirming evidence.
Commodity Seasonals Tendencies Checklist
Before trading a seasonal tendency, confirm:
- What is the normal seasonal expectation?
- Do the 15-year and 40-year studies agree?
- Is the broader market bullish or bearish?
- Is price following or rejecting seasonality?
- Are commercials net long or net short?
- Is commercial positioning rising or falling?
- Is price at a Premium or Discount Array?
- Is institutional order flow aligned?
- Has liquidity been taken?
- Is there a market structure shift?
- Is there displacement?
- Is a valid ICT entry model present?
- Is the expected target realistic?
- Does the trade offer acceptable risk and reward?
Common Mistakes With Commodity Seasonality
Treating Seasonality as a Guaranteed Forecast
Historical patterns do not guarantee future results.
Unexpected weather, supply shocks, geopolitical events or economic changes can overpower the seasonal tendency.
Entering Only Because of the Calendar
A seasonal date is not a trade entry.
The trader must wait for price confirmation.
Ignoring the Primary Trend
Bullish seasonality may fail during a strong bear market.
Bearish seasonality may fail during a strong bull market.
Ignoring Commercial Positioning
Seasonality becomes more meaningful when it agrees with Commitment of Traders data.
Forcing the Expected Pattern
When price does not follow seasonality, do not assume the market is wrong.
The failure itself may reveal relative strength or weakness.
Using the Wrong Futures Contract
Analysing an inactive or illiquid contract may produce misleading information.
Focus on the contract with the greatest volume and open interest.
Final Thoughts
Commodity Seasonals Tendencies provide traders with a historical framework for understanding when a market may be more likely to rise, decline, form a high or establish a low.
The ICT approach does not treat seasonality as a mechanical system. Instead, it uses seasonal information as a road map that must be confirmed by current market behaviour.
The strongest conditions appear when:
- The seasonal tendency supports the direction
- Commitment of Traders data confirms commercial activity
- Institutional order flow agrees
- Price is positioned at the correct Premium or Discount Array
- Liquidity and market structure support the setup
When the market fails to follow its normal seasonal tendency, the trader should study that failure carefully. It may reveal significant supply, demand, strength or weakness that is not obvious from the seasonal chart alone.
As Michael J. Huddleston explains:
“Don’t force it, but look and see if there’s reasons to justify that seasonal tendency.”
Commodity seasonality is therefore best used as a higher-time-frame directional filter. It helps traders know when to begin looking for opportunities, but the final decision must always come from price action, institutional order flow and proper risk management.
All examples and concepts discussed here are for educational and paper-trading purposes. Commodity and futures trading involve substantial risk, and seasonal tendencies cannot guarantee profitable results.