Reinforcing Liquidity Concepts & Price Delivery is an important part of understanding how price moves from one liquidity objective to another in the ICT (Inner Circle Trader) methodology. This framework is taught by Michael J. Huddleston in his ICT Mentorship Core Content – Month 04, the founder of ICT concepts, to help traders distinguish liquidity inside a trading range from liquidity resting outside the range.
A trader may see an old high and call it resistance.
Another trader may see an old low and call it support.
ICT looks at these levels from the perspective of liquidity and price delivery.
Buy stops may rest above old highs.
Sell stops may rest below old lows.
Inside the trading range, price may also return to Fair Value Gaps, liquidity voids and order blocks.
Therefore, price can move between internal range liquidity and external range liquidity.
Michael J. Huddleston explains the basic objective clearly:
“Runs on liquidity seek to pair orders with pending order liquidity.”
Understanding this relationship helps the trader identify where price may trade next and whether a potential trade is a low resistance or high resistance liquidity run.
What Is Reinforcing Liquidity Concepts & Price Delivery?
Reinforcing Liquidity Concepts & Price Delivery is the study of how price moves through a trading range and seeks different forms of liquidity.
The main concepts are:
External Range Liquidity
Internal Range Liquidity
Liquidity Pools
Liquidity Voids
Fair Value Gaps
Order Blocks
Gap Risk
Low Resistance Liquidity Runs
High Resistance Liquidity Runs
The trader first identifies a current trading range.
A trading range generally has a defined high and low.
Liquidity outside this range is classified as external range liquidity.
Price inefficiencies and institutional price references inside the range can represent internal range liquidity.
The ICT trader studies both sides.
Where is price now?
Which liquidity has already been taken?
What remains inside the range?
What remains outside the range?
What does the higher timeframe suggest price is seeking?
These questions help create a price delivery narrative.
What Is a Trading Range in ICT?
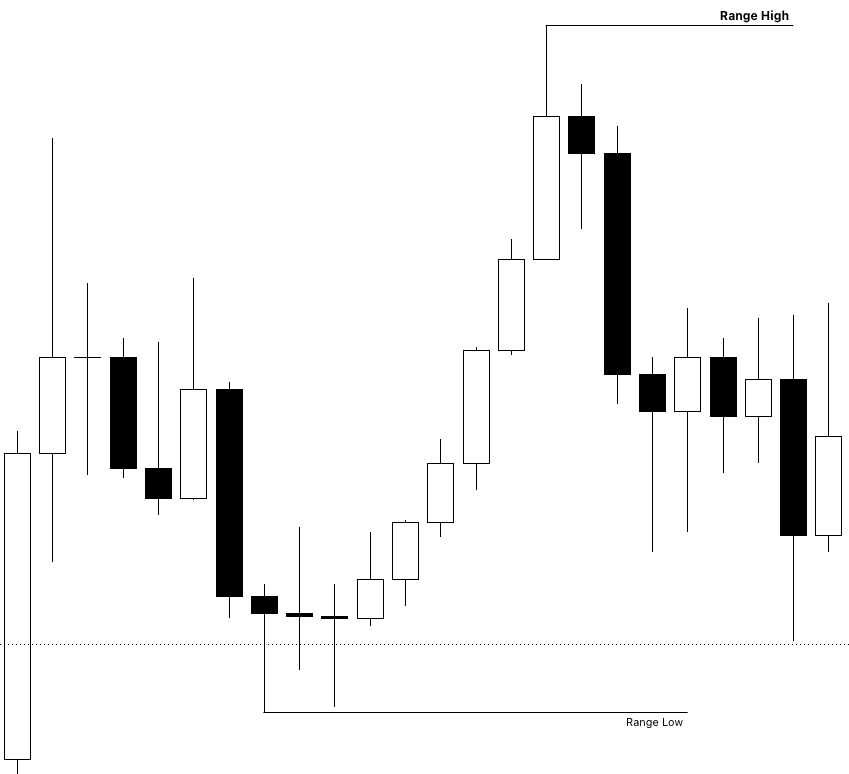
A trading range is a defined price swing between a significant low and high.
For example, price creates a low.
Then price expands higher and forms a high.
The range between these two points becomes the current trading range.
The basic structure is:
Range Low → Price Range → Range High
The range is not permanent.
It changes when price creates new important highs or lows.
Suppose price trades above the existing range high and creates a new high.
The trader may need to redefine the range.
Suppose price clears an old low and creates a lower low.
Again, the current range may need to be updated.
Michael J. Huddleston repeatedly redraws the relevant range in the mentorship lesson as new liquidity is taken.
This is important because the classification of liquidity depends on the current range being studied.
The same price level can be internal liquidity on one timeframe or range and external liquidity on another.
What Is External Range Liquidity?
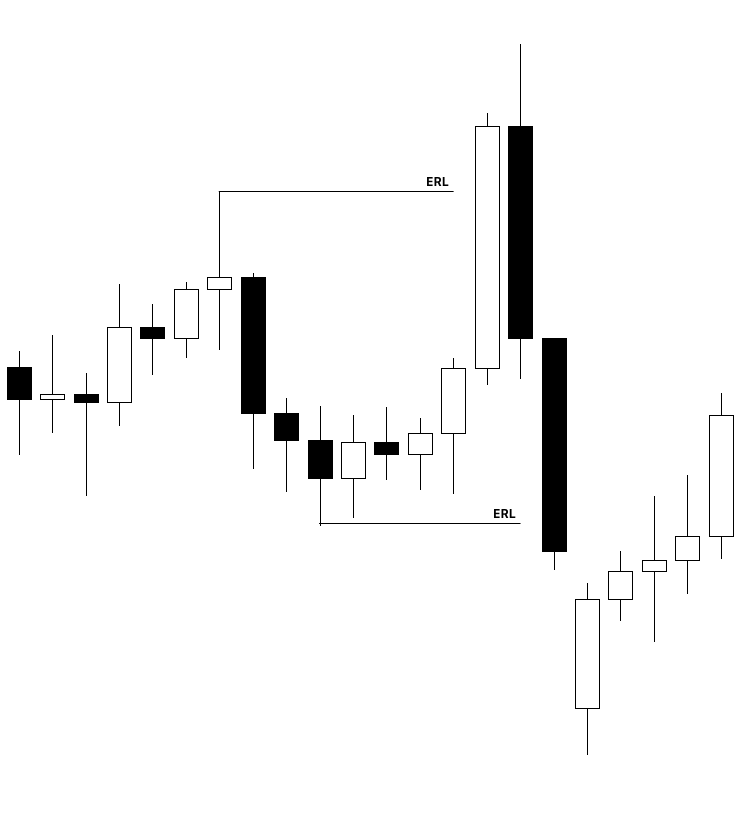
External Range Liquidity or ERL is liquidity located outside the current trading range.
Buy-side liquidity above the range high is external range liquidity.
Sell-side liquidity below the range low is also external range liquidity.
The simple structure is:
Above Range High = External Buy-Side Liquidity
Below Range Low = External Sell-Side Liquidity
For example, suppose the trading range is formed between a low at 100 and a high at 120.
Price above 120 can contain external buy-side liquidity.
Price below 100 can contain external sell-side liquidity.
Old highs, equal highs and stop liquidity above the range may become external liquidity objectives.
Old lows, equal lows and stop liquidity below the range may also become external objectives.
Huddleston explains:
“The current trading range will have buy side liquidity above the range high.”
The opposite applies below the range low.
External liquidity is important because price can expand beyond the current range to seek pending stop orders.
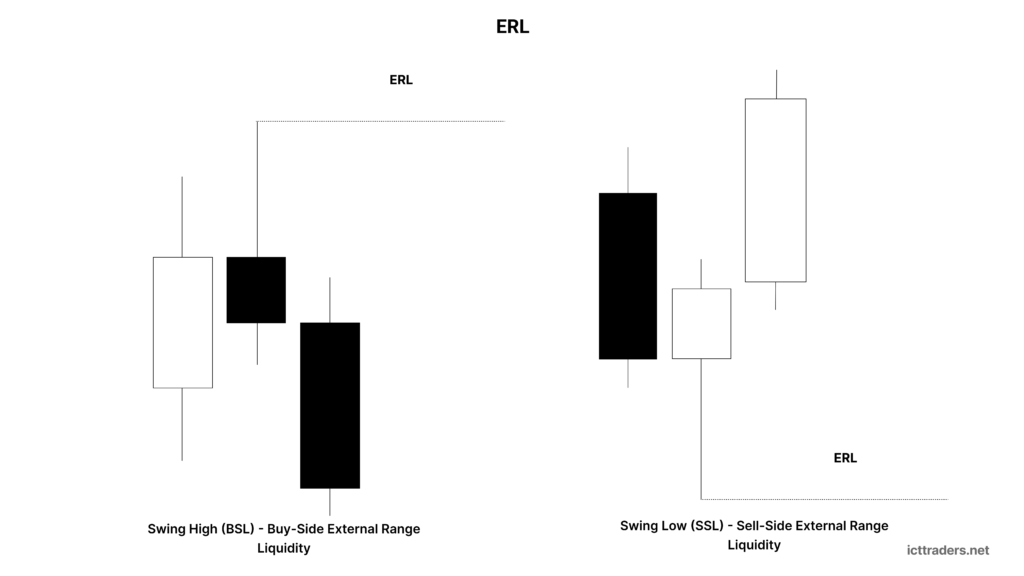
Buy-Side External Range Liquidity
Buy-side external range liquidity is normally found above the current range high.
This may include:
Old highs.
Swing highs.
Equal highs.
Short-term highs.
Buy stops above previous highs.
For example, short traders commonly place protective buy stops above an old high.
Breakout traders may also place buy orders above the same level.
This creates a liquidity pool.
If price is bullish and higher timeframe price delivery supports higher prices, the market may move through the old high.
The stops above the high are taken.
This becomes an external range liquidity run.
In ICT analysis, the old high is not automatically treated as resistance.
The trader asks whether the market has a reason to seek the liquidity above it.
Sell-Side External Range Liquidity
Sell-side external range liquidity is found below the range low.
This may include:
Old lows.
Swing lows.
Equal lows.
Short-term lows.
Sell stops below previous lows.
Long traders commonly place protective sell stops below old lows.
These orders can create a sell-side liquidity pool.
When price moves below the range low, the market is reaching outside the current trading range.
This becomes an external range liquidity run.
If the higher timeframe is bullish, a short-term run below a low may create an opportunity to study a long setup.
The market may trade below the low, take sell-side liquidity and quickly move higher.
ICT traders can study the reaction after the liquidity run.
What Is Internal Range Liquidity?
Internal Range Liquidity or IRL refers to price references and inefficiencies found inside the current trading range.
The ICT mainly connects internal range liquidity with:
Fair Value Gaps
Liquidity Voids
Order Blocks
These price areas remain between the current range high and range low.
Suppose price creates a low at 100 and a high at 120.
A Fair Value Gap exists between 108 and 110.
The FVG is inside the current 100 to 120 range.
Therefore, it represents internal range liquidity within that trading range.
A bullish order block at 104 may also be inside the range.
Price can retrace into these internal price areas before expanding toward external liquidity.
The model can be understood as:
Internal Range Entry → External Range Liquidity Objective
This is one of the central ideas in the mentorship lesson.
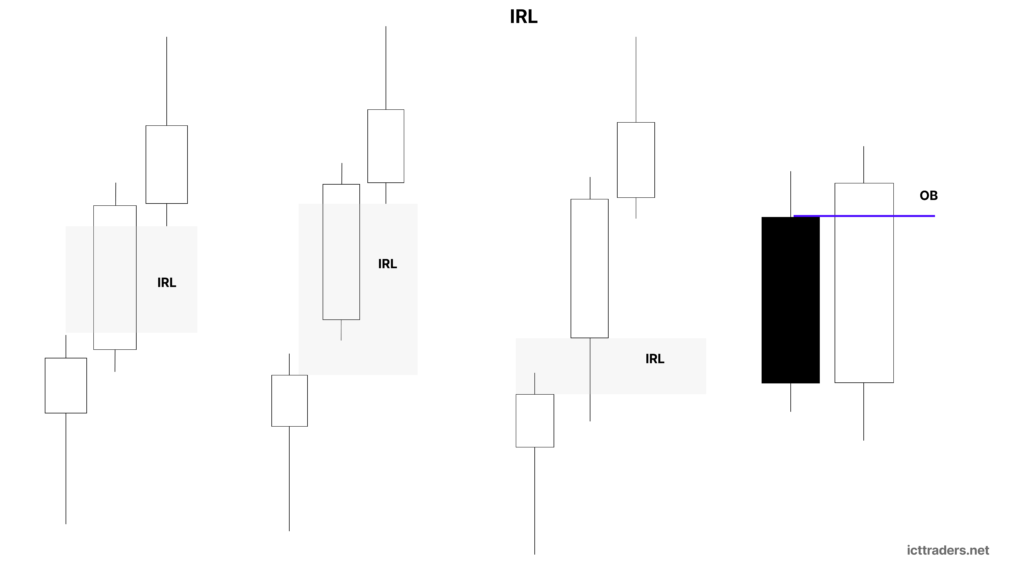
Internal Range Liquidity and Fair Value Gaps
A Fair Value Gap or FVG can represent internal range liquidity when it exists between the current range high and low.
A Fair Value Gap develops from one-sided price delivery.
Price moves rapidly through a range.
One side of price delivery is offered.
The opposing side remains inefficient.
If the current trading range remains valid, price may return to the FVG.
The market can trade into the gap and provide more efficient price delivery.
Therefore, the FVG becomes an internal price objective.
For example:
Price creates a major low.
Price rallies.
A higher timeframe Fair Value Gap remains above current price but below the range high.
The FVG is internal range liquidity.
If higher timeframe analysis suggests price should move higher, the market may continue seeking that Fair Value Gap.
Short-term highs can be taken on the way toward the higher timeframe internal liquidity objective.
Internal Range Liquidity and Liquidity Voids
A liquidity void is another form of internal price delivery studied in the ICT.
A liquidity void forms when price rapidly reprices through a range.
There is very little two-sided trading.
The movement may contain one long candle or several aggressive candles.
If the void remains inside the current trading range, price may later return and fill the range.
Huddleston explains:
“The market quickly reprices to a level where there was very little or no trading.”
This fast repricing creates gap risk.
A trader who enters on one side of a large void may be exposed to an aggressive price movement back through the inefficient range.
ICT traders do not only view this as risk.
The liquidity void can become a price delivery opportunity.
What Is Gap Risk in ICT?
Gap risk refers to the risk created by a nearby inefficient price range such as a liquidity void or Fair Value Gap.
Suppose a trader is long.
Below the current market, a large liquidity void remains open.
Price has not efficiently traded through the range.
The trader may feel comfortable because price is moving higher.
However, the market can aggressively reprice lower and close the inefficient range.
The long trader may be stopped out during the rapid move.
This is gap risk.
Huddleston explains:
“Whenever you’re in a long and you have a big gap underneath you, that’s gap risk.”
The reverse applies to a short trade with a large inefficient price range above the market.
ICT traders study these gaps as potential price objectives.
Instead of being surprised by the aggressive repricing, the trader anticipates where price may seek more efficient delivery.
Internal Range Liquidity and ICT Order Blocks
An ICT Order Block can also become an internal range entry area.
Suppose the market is bullish.
Price creates an impulse move higher.
The last down candle before the expansion may form a bullish order block.
Price then creates a range high.
Later, the market retraces.
The bullish order block remains inside the range between the swing low and range high.
Price trades back into the order block.
According to the ICT narrative, new buy orders may be populated in the range.
Price then moves higher.
The external range liquidity above the old high becomes the price objective.
The basic bullish model is:
Range Low
↓
Bullish Expansion
↓
Range High
↓
Retracement Into Bullish Order Block
↓
Buy at Internal Range Liquidity
↓
Price Expands Higher
↓
External Buy-Side Liquidity Taken
Huddleston describes his approach as:
“Predominantly my entries are internal range liquidity entries with exits at external range liquidity.”
This statement summarizes a major part of the model.
External Range Liquidity vs Internal Range Liquidity
The difference between external and internal range liquidity depends on the range being studied.
External Range Liquidity
Located outside the current range.
Buy-side liquidity above the range high.
Sell-side liquidity below the range low.
Commonly associated with old highs, old lows and stop pools.
Internal Range Liquidity
Located inside the current range.
Can include Fair Value Gaps.
Can include liquidity voids.
Can include order blocks.
Often used to study retracement and return-to-fair-value opportunities.
The basic ICT price delivery model is:
Price Retraces Into Internal Range Liquidity
↓
Price Expands
↓
External Range Liquidity Is Reached
However, the classification can change with timeframe.
This is a very important part of the concept.
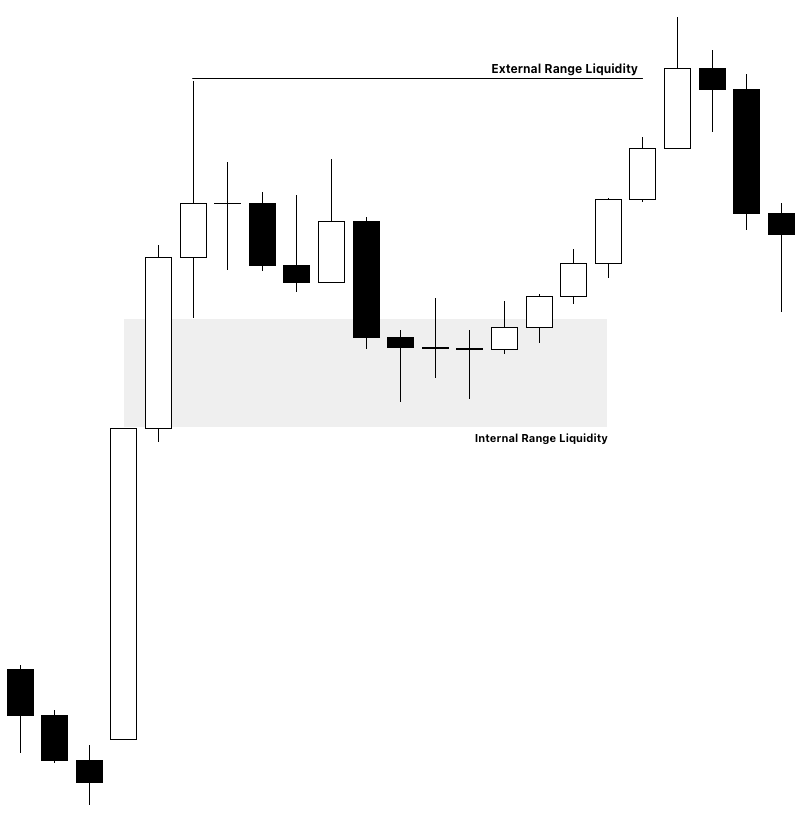
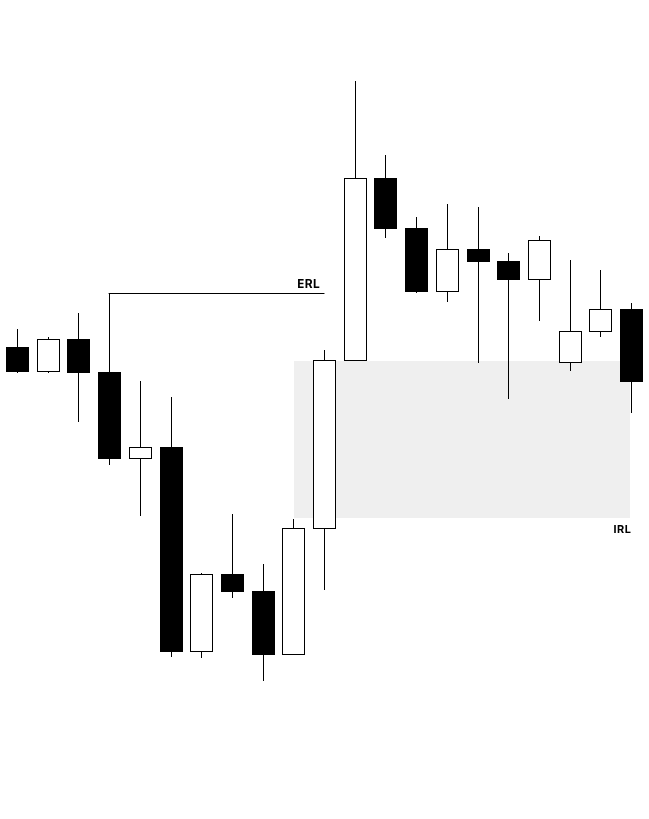
How the Same Liquidity Can Be Internal and External
A price level can be external range liquidity on a lower timeframe but internal range liquidity on a higher timeframe.
Suppose the monthly chart has a large range.
Price is moving from the lower portion of the monthly range toward a monthly Fair Value Gap.
The monthly FVG is the higher timeframe internal range liquidity objective.
Now move to the daily chart.
Price creates a short-term low and high.
When the daily high is taken, price has run external range liquidity on the daily timeframe.
But price is still inside the larger monthly range.
Therefore:
Daily Chart = External Range Liquidity Run
Monthly Chart = Still Moving Through Internal Range Liquidity
This is why timeframe context is important.
Huddleston explains in the lesson that each new daily high can represent an external liquidity run on the daily chart while still being part of the movement toward monthly internal range liquidity.
The trader should always ask:
External or internal relative to which trading range?
Without defining the timeframe and range, the liquidity label has little meaning.
Higher Timeframe Price Delivery
The monthly and weekly charts are important in this ICT lesson.
The trader uses the higher timeframe to determine where price is likely trying to trade.
For example, the monthly chart may show a Fair Value Gap above current price.
The higher timeframe price delivery is bullish.
The market may be drawn toward the monthly FVG.
Once this objective is identified, lower timeframe analysis becomes easier.
Every retracement can be studied from a bullish perspective.
The trader looks for:
Sell-side liquidity runs.
Bullish order blocks.
Bullish Turtle Soup setups.
Retracements into internal range liquidity.
The objective is to trade in the same direction as higher timeframe institutional order flow.
Short-term highs can then become low resistance liquidity objectives.
What Is a Low Resistance Liquidity Run?
A low resistance liquidity run is a price move where the expected liquidity objective agrees with the higher timeframe directional bias.
In simple words, price has very little resistance in the path toward the target.
Suppose the monthly chart is bullish.
A higher timeframe Fair Value Gap exists above current price.
The market is expected to move higher.
On the hourly chart, price retraces into a bullish order block.
An old high is above current price.
If the trader buys the bullish order block and targets the old high, the trade agrees with the monthly price objective.
The short-term high is likely to provide less resistance because higher timeframe price delivery is already bullish.
This creates a low resistance liquidity run.
Huddleston explains:
“You want to be trading with the least resistance.”
The lower timeframe trade is moving in the same direction as higher timeframe institutional order flow.

What Is a High Resistance Liquidity Run?
A high resistance liquidity run occurs when the trade idea conflicts with the higher timeframe price delivery.
Suppose the monthly and weekly charts are bullish.
Price is moving toward a higher timeframe Fair Value Gap.
On a 15-minute chart, the trader sees a short-term bearish pattern.
The trader sells and targets a lower low.
This trade is moving against the higher timeframe objective.
The short position may take a long time to become profitable.
Price may produce large drawdown.
The market may immediately reverse.
The trader can be stopped out.
The liquidity objective below price represents a higher resistance run because higher timeframe order flow supports higher prices.
High resistance trades are commonly the trades that:
Move slowly.
Create more drawdown.
Fail to react immediately.
Reverse against the entry.
Require the trader to sit in the position for too long.
The ICT trader tries to avoid these conditions.
Low Resistance Liquidity Run Bullish Model
A bullish low resistance liquidity run may develop as follows.
Step 1 – Monthly or Weekly Bias Is Bullish
A higher timeframe price objective exists above current price.
This may be:
A monthly Fair Value Gap.
A liquidity void.
An old high.
Another institutional price reference.
Step 2 – Price Retraces on a Lower Timeframe
The daily, 4-hour or hourly chart moves lower.
The trader does not immediately become bearish.
The higher timeframe remains bullish.
Step 3 – Identify Sell-Side Liquidity
Look for short-term lows.
Equal lows.
Old lows.
Stops below swing lows.
Step 4 – Price Runs Sell-Side Liquidity
The market trades below a low.
Sell stops are taken.
Step 5 – Watch the Reaction
Price should show willingness to move away from the liquidity run.
The market should not remain below the low for a long period.
Step 6 – Identify a Bullish Order Block
The last down candle before the bullish expansion becomes important.
Step 7 – Price Returns to Internal Range Liquidity
Price retraces into the bullish order block.
The trader studies a long setup.
Step 8 – Target External Range Liquidity
The old high or buy stops above the range become the first price objective.
Step 9 – Hold Partial Position for Higher Timeframe Objective
If the higher timeframe price delivery remains bullish, part of the position may be held toward the monthly or weekly objective.
The complete sequence is:
Higher Timeframe Bullish → Sell Stops Taken → Bullish Order Block → Buy Internal Range Liquidity → External High Taken
Low Resistance Liquidity Run Bearish Model
The bearish model is the opposite.
Step 1 – Monthly or Weekly Bias Is Bearish
The higher timeframe suggests lower price delivery.
Step 2 – Lower Timeframe Price Retraces Higher
The market moves upward.
Step 3 – Identify Buy-Side Liquidity
Look for:
Old highs.
Equal highs.
Short-term highs.
Buy stops.
Step 4 – Price Runs Buy-Side Liquidity
The market trades above the old high.
Step 5 – Watch for Bearish Repricing
Price should show willingness to move lower.
Step 6 – Identify a Bearish Order Block
The last up candle before bearish displacement becomes a price reference.
Step 7 – Price Returns to Internal Range Liquidity
The market retraces into the bearish order block.
Step 8 – Study the Short Setup
The trader looks for a bearish entry.
Step 9 – Target External Sell-Side Liquidity
The range low or sell stops below old lows become the objective.
The model is:
Higher Timeframe Bearish → Buy Stops Taken → Bearish Order Block → Sell Internal Range Liquidity → External Low Taken
USD/JPY Example From the ICT Lesson
The mentorship lesson uses the Japanese Yen and USD/JPY price delivery to explain the difference between internal and external liquidity.
On the higher timeframe, price had a larger range.
A Fair Value Gap remained above current price.
The monthly price delivery suggested the market could trade higher toward the FVG.
This higher timeframe objective was important.
When the trader moved to the daily and lower timeframes, price repeatedly created short-term highs.
Each old high contained buy-side liquidity.
Price broke through these highs with little difficulty.
From the daily or 4-hour perspective, the market was running external range liquidity.
But on the monthly chart, price was still moving through the larger range toward internal liquidity in the form of the monthly FVG.
This created repeated low resistance liquidity runs.
The higher timeframe objective made short-term highs easier for price to trade through.
Why Old Highs Were Broken Easily
In the USD/JPY example, multiple short-term highs are taken.
The market does not show strong resistance at each high.
Why?
The monthly price delivery is bullish.
Price has a higher timeframe objective above.
Funds operating from monthly and weekly perspectives are supporting the broader movement.
Therefore, short-term highs are only liquidity references inside the larger price delivery process.
Huddleston explains that the market has:
“An agenda. It wants to get to a specific price level relative to a higher time frame.”
When a lower timeframe liquidity objective agrees with the higher timeframe destination, price may move through the level aggressively.
This is the nature of a low resistance liquidity run.
Using Bullish Order Blocks Inside the Range
During the USD/JPY bullish price delivery, price repeatedly creates impulse swings higher.
Then price retraces.
The trader identifies the last down candle before the bullish movement.
This becomes a bullish order block.
The order block is inside the current lower timeframe trading range.
Therefore, it represents an internal range liquidity entry area.
Price returns to the order block.
New buy orders may be accumulated.
The market then expands higher.
The external liquidity above the previous high becomes the next target.
This process can repeat several times.
Impulse Higher
↓
New Range High
↓
Retracement
↓
Bullish Order Block
↓
Internal Range Buy
↓
Previous High Taken
↓
New External Liquidity Run
The higher timeframe objective remains unchanged until price reaches the larger price reference.
Accumulating Positions During Price Delivery
The lesson also explains how larger participants may build positions over time.
Suppose the higher timeframe objective is significantly above current price.
Professional money may not establish the complete position at one exact candle.
Price can rally.
Then retrace to a previous bullish order block.
More buying occurs.
Time passes.
Price rallies again.
Another retracement develops.
The market returns to the same or another institutional price range.
Additional positions can be accumulated.
The sequence may repeat before the final expansion.
This creates the appearance of repeated order block reactions.
The trader who understands the higher timeframe objective can interpret these retracements as possible opportunities to participate in the larger price delivery.
Turtle Soup and External Range Liquidity
The ICT identifies Turtle Soup as another way traders may use liquidity.
Suppose the higher timeframe is bullish.
The lower timeframe trades below a swing low.
Sell-side liquidity is taken.
Price quickly rejects the low.
This creates a potential bullish Turtle Soup condition.
The trader is effectively buying sell stops.
The same concept is reversed in a bearish market.
Price trades above an old high.
Buy stops are taken.
The market rejects the level.
The trader may study a bearish Turtle Soup setup.
Therefore, ICT traders may broadly frame trades using two disciplines:
Liquidity Sweep or Turtle Soup
or
Return to Fair Value/Internal Range Liquidity
Both models should agree with the higher timeframe directional bias.
Return to Fair Value Trading Model
A return to fair value setup focuses on internal range liquidity.
Suppose the market is bullish.
Price creates a strong impulse swing higher.
A bullish order block or Fair Value Gap remains inside the range.
Price retraces.
The trader waits for the market to return to the internal price reference.
The long setup is studied inside the range.
The objective is outside the range at external buy-side liquidity.
Therefore:
Buy Inside the Range
↓
Target Outside the Range
For a bearish market:
Sell Inside the Range
↓
Target Below the Range
This is the internal-to-external liquidity model.
How to Find the Next Liquidity Objective
After price takes an old high or low, the trader should redefine the range.
Suppose a bullish market trades above the previous high.
The buy-side liquidity is taken.
Do not continue targeting the same high.
The high is no longer untouched liquidity.
Identify the new range.
Mark the relevant low.
Mark the new high.
Now ask:
Where is internal range liquidity?
Is there an FVG?
Is there a liquidity void?
Is there an order block?
Where is the next external liquidity?
Huddleston explains that the market continually creates new ranges.
Once one liquidity level is taken, the trader evaluates the next price reference.
The objective is not to call the final top or bottom.
The trader follows price from one logical liquidity objective to another.
Why ICT Does Not Try to Call the Final Market High
A trader may ask:
How high will price go?
Which old high is the final target?
ICT does not need to identify the absolute market top.
Suppose price takes one short-term high.
A new range forms.
Then price takes another high.
The range is redefined.
Price continues toward a higher timeframe Fair Value Gap.
The trader follows the price delivery.
Huddleston explains:
“We don’t ever try to call a high in the marketplace.”
The objective is to identify logical price references.
Once a level is reached, price is reevaluated.
Does the market still show willingness to continue?
Has the higher timeframe objective been reached?
Should consolidation now be expected?
Price action provides the next information.
How to Use Higher Timeframe Bias
The first step in the model is the monthly or weekly chart.
Ask:
Where is the market more likely to trade?
If the monthly chart provides a clear bullish objective, look for buys.
If the weekly chart provides bullish price delivery, lower timeframe buy setups can be studied.
If the monthly or weekly chart is bearish, focus on sells.
The basic framework is:
Monthly/Weekly Bullish
→ Daily, 4H and 1H bullish order blocks.
→ Bullish Turtle Soup setups.
→ Buy sell-side liquidity runs.
→ Target short-term highs and external buy-side liquidity.
Monthly/Weekly Bearish
→ Daily, 4H and 1H bearish order blocks.
→ Bearish Turtle Soup setups.
→ Sell buy-side liquidity runs.
→ Target short-term lows and external sell-side liquidity.
The higher timeframe defines the direction.
The lower timeframe provides the setup.
Choosing the Correct Price Swing
The ICT also discusses the size of the price swing.
Not every small trading range is worth trading.
Suppose the range from the bullish order block entry to the old high is only 20 pips.
The profit potential may be too small for the trader’s model.
Huddleston explains that he would not personally select the 20-pip example discussed in the lesson.
Now suppose the distance from the order block to external range liquidity is 40 pips.
The setup may provide a more reasonable opportunity.
The trader has sufficient price range before the first liquidity objective.
The lesson suggests looking at price legs of approximately 40 pips or more for certain day-trade or short-term models discussed in the module.
The important point is not that every trader must use exactly 40 pips.
The price swing should fit the trader’s objective.
Matching Timeframe With Trading Objective
A trader’s timeframe should match the size of the price movement they are trying to capture.
A trader seeking a small intraday move may use a lower timeframe.
A trader seeking 50 pips or more needs a sufficiently large price swing.
A trader trying to capture 100 to 150 pips may need a 4-hour or daily price structure.
The ICT explains that a trader seeking around 100 pips per week should not force that objective from tiny 5-minute price legs.
The basic idea is:
Small Objective → Smaller Price Structure
Larger Objective → Higher Timeframe Price Structure
If the trader wants a 50-pip opportunity, study a range that provides sufficient price depth.
A 75- to 80-pip range may allow the trader to capture 50 pips without requiring price to completely break the range high.
The trader can take profit inside the range.
This is another benefit of correctly framing price swings.
You Do Not Need the Entire Range
A common mistake is believing the trader must hold from the exact range low to beyond the range high.
This is not necessary.
Suppose the complete trading range is 100 pips.
The trader enters near internal range liquidity.
A 75-pip profit may be available before price reaches the external range high.
The trader can take the required objective.
The market does not need to complete the entire projected move for the trade to be profitable.
The selected range simply needs enough price depth.
Therefore, the trader should be more selective.
Do not force trades in every 20- or 30-pip price swing when the trading objective requires a much larger move.
Why Selectivity Is Important
ICT does not require the trader to find a setup every day.
The lesson repeatedly emphasizes finding quality opportunities.
A trader may only need one clear setup during the week.
The goal is not:
Trade every order block.
Trade every FVG.
Buy every sell-side liquidity sweep.
Sell every buy-side liquidity sweep.
The goal is to find a setup that agrees with higher timeframe price delivery.
Huddleston explains:
“You’re looking for one setup per week.”
Selectivity allows the trader to focus on price ranges with sufficient profit potential.
It also reduces the temptation to trade high resistance liquidity runs.
Important Rules of Reinforcing Liquidity Concepts & Price Delivery
Always define the current trading range.
Mark the range high and range low.
Expect buy-side liquidity above the range high.
Expect sell-side liquidity below the range low.
Identify Fair Value Gaps inside the trading range.
Identify liquidity voids inside the range.
Study bullish and bearish order blocks.
Understand gap risk.
Redefine the range after important highs or lows are taken.
Remember that liquidity classification depends on the timeframe.
A daily external liquidity run can still be monthly internal range price delivery.
Start with the monthly or weekly directional bias.
Trade lower timeframe setups in the same direction.
Buy internal range liquidity in bullish conditions.
Target external buy-side liquidity.
Sell internal range liquidity in bearish conditions.
Target external sell-side liquidity.
Prefer low resistance liquidity runs.
Avoid forcing high resistance trades against higher timeframe price delivery.
Choose price swings large enough for your trading objective.
Do not trade every setup.
Wait for clear price delivery.
ICT Internal to External Range Liquidity Model
The concept can be simplified into one bullish sequence:
Monthly/Weekly Bullish Bias
↓
Higher Timeframe Price Objective Identified
↓
Lower Timeframe Retracement
↓
Sell-Side Liquidity Taken
↓
Bullish Reaction
↓
Bullish Order Block or FVG
↓
Buy Internal Range Liquidity
↓
Price Expands Higher
↓
External Buy-Side Liquidity Taken
↓
Reevaluate the New Trading Range
The bearish model is reversed:
Monthly/Weekly Bearish Bias
↓
Higher Timeframe Downside Objective
↓
Lower Timeframe Rally
↓
Buy-Side Liquidity Taken
↓
Bearish Reaction
↓
Bearish Order Block or FVG
↓
Sell Internal Range Liquidity
↓
Price Expands Lower
↓
External Sell-Side Liquidity Taken
↓
Reevaluate the New Trading Range
Final Thoughts on Reinforcing Liquidity Concepts & Price Delivery
Reinforcing Liquidity Concepts & Price Delivery helps an ICT trader understand why price may move through certain highs or lows with very little resistance.
The first step is to define the trading range.
Buy-side liquidity above the range high and sell-side liquidity below the range low are external range liquidity.
Fair Value Gaps, liquidity voids and order blocks inside the range can represent internal range liquidity.
Michael J. Huddleston’s ICT (Inner Circle Trader) teaching emphasizes using monthly and weekly price delivery to determine where the market is likely trying to trade.
Once the higher timeframe objective is known, lower timeframe setups can be classified more clearly.
A bullish lower timeframe trade targeting an old high can become a low resistance liquidity run when the monthly chart is already bullish.
A bearish trade against the same higher timeframe objective may face greater resistance.
The core model is:
Use Higher Timeframe Institutional Order Flow → Enter at Internal Range Liquidity → Target External Range Liquidity
The ICT trader is not trying to predict every candle.
The trader identifies the larger price objective, waits for price to provide a lower timeframe opportunity and trades toward logical liquidity.
When the trade agrees with higher timeframe price delivery, old highs and lows can be viewed differently.
They are not simply support and resistance.
They are liquidity references that price may seek as part of a larger and more efficient delivery process.