The Double Bottom Double Top Trap is an important price action concept in ICT (Inner Circle Trader) trading. In traditional technical analysis, a double top is commonly viewed as resistance and a double bottom is viewed as support. However, the ICT perspective explained by Michael J. Huddleston studies these formations mainly as liquidity reference points where stop orders can accumulate.
Retail traders may see a double top and immediately look for a short position.
They may see a double bottom and immediately look for a buy.
ICT traders look at the same price structure differently.
Equal or relatively equal highs can create an area where buy stops are expected.
Equal or relatively equal lows can create an area where sell stops are expected.
Price may trade through these levels, collect the liquidity and then create a strong move in the opposite direction.
Michael J. Huddleston gives a direct warning:
“We never trust double bottoms and double tops.”
This idea forms the basis of the ICT Double Bottom Double Top Trap.
What Is a Double Bottom Double Top Trap?
A Double Bottom Double Top Trap is a market condition where traders use a double top as resistance or a double bottom as support, but price trades through the pattern to seek stop liquidity.
A double top contains two highs formed near the same price level.
Retail traders may identify this as resistance.
Short traders can enter below the highs.
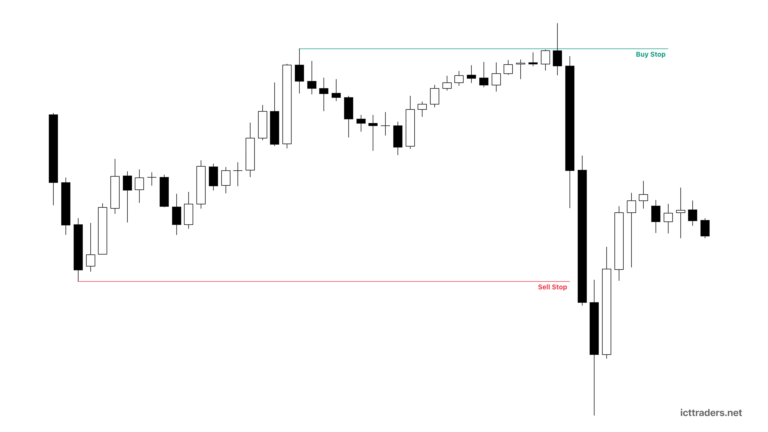
Their protective buy stop is commonly placed above the double top.
This creates buy-side liquidity above the highs.
A double bottom contains two lows formed near the same price level.
Retail traders may identify this as support.
Long traders can buy above the lows.
Their protective sell stop is commonly placed below the double bottom.
This creates sell-side liquidity below the lows.
From the ICT (Inner Circle Trader) perspective, these obvious stop locations can become price objectives.
The market may trade above a double top or below a double bottom before creating the next price movement.
Why Double Tops and Double Bottoms Trap Retail Traders
Traditional technical analysis generally teaches:
Double Top = Resistance
Double Bottom = Support
When price reaches a previous high twice, retail traders may assume sellers will defend that price level.
They sell the market.
Then they place their stop-loss above the equal highs.
When price creates equal lows, retail traders may expect buyers to defend the support.
They buy.
Their protective stop-loss is placed below the lows.
This creates a predictable concentration of orders.
Above a double top, buy stops may accumulate.
Below a double bottom, sell stops may accumulate.
The Double Bottom Double Top Trap occurs when price attacks these stop pools instead of respecting the support or resistance level.
Double Top Trap in ICT Trading
A Double Top Trap forms around relatively equal highs.
Suppose price creates one high.
Price moves lower.
Then price returns and forms another high close to the first high.
Retail traders see resistance.
They may begin selling the market.
Their protective buy stops are placed above the double top.
This creates a pool of buy-side liquidity.
An ICT trader studies the highs as clean highs.
Price has not yet significantly traded through the level.
Therefore, the liquidity above the highs can remain available.
Price may later rally through the double top and trigger the buy stops.
This movement is a buy-side liquidity run.
The retail trader who sold resistance is stopped out.
Price can then reach another ICT price level and reverse.
This creates the Double Top Trap.
Double Bottom Trap in ICT Trading
A Double Bottom Trap is the opposite condition.
Price creates one low.
Then it rallies.
Later, price returns and creates another low near the same price level.
Retail traders identify support.
They may buy the market.
Their stop-loss orders are commonly placed below the double bottom.
This creates sell-side liquidity below the lows.
From an ICT perspective, the double bottom represents a clear downside liquidity reference.
Price may trade through the lows and activate the sell stops.
The long traders are stopped out.
After collecting the liquidity, price may react from another ICT price level and move higher.
This creates the Double Bottom Trap.
Double Tops and Double Bottoms as Liquidity Pools
The most important part of the Double Bottom Double Top Trap concept is liquidity.
A double top can form a buy-side liquidity pool.
A double bottom can form a sell-side liquidity pool.
The basic relationship is:
Double Top → Buy stops above highs → Buy-side liquidity
Double Bottom → Sell stops below lows → Sell-side liquidity
ICT traders do not automatically expect price to reject from these levels.
Instead, the trader asks:
Has the liquidity above the double top already been taken?
Has the liquidity below the double bottom already been taken?
Which side of the market is still clean?
Where is the next opposing liquidity objective?
These questions help create a price delivery narrative.
What Are Clean Highs and Clean Lows?
Clean highs and clean lows are important in the Double Bottom Double Top Trap concept.
A clean high is a price high that has not yet been significantly traded through.
Buy-side liquidity may remain above it.
A clean low is a price low that has not yet been significantly traded through.
Sell-side liquidity may remain below it.
Double tops commonly create clean highs because price forms two highs around the same level without properly clearing the liquidity above them.
Double bottoms commonly create clean lows because the sell-side liquidity below them remains untouched.
ICT traders highlight these price areas because they can become future price objectives.
The level may remain important even after a significant amount of time has passed.
Retail View vs ICT View of a Double Top
Suppose price creates a double top.
The retail trader sees:
Two equal highs.
Previous rejection from the same level.
Resistance.
Possible bearish reversal.
The retail trader sells.
The stop is placed above the highs.
The downside target may be a previous support level.
The ICT trader sees:
Two relatively equal highs.
Buy stops above the highs.
A clean liquidity reference.
Possible buy-side liquidity objective.
The ICT trader then studies the price arrays above and below the current market.
A Fair Value Gap may exist below price.
A bullish order block may be present below price.
A liquidity void may remain above the double top.
Price may first move lower into the Fair Value Gap or bullish order block.
Then price can reverse upward.
The double top is cleared.
Buy-side liquidity is taken.
Price may then continue into the liquidity void above the highs.
The same double top produces two completely different expectations.
Retail View vs ICT View of a Double Bottom
The same idea is reversed with a double bottom.
The retail trader sees:
Two equal lows.
Support.
Possible bullish reversal.
The trader buys.
A stop-loss is placed below the lows.
The ICT trader sees:
Sell stops below the lows.
A clean sell-side liquidity reference.
A possible downside price objective.
Price may first rally into a bearish price array.
Then it can move lower.
The double bottom is violated.
Sell-side liquidity is taken.
After reaching another downside objective, price may react and move higher.
Therefore, ICT traders do not automatically trust the double bottom as support.
The Role of Fair Value Gaps in Double Top and Double Bottom Traps
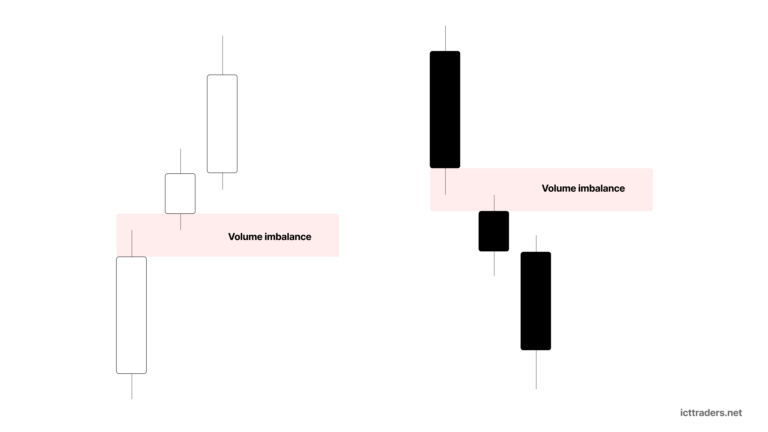
The uploaded ICT mentorship lesson combines double tops and bottoms with Fair Value Gaps or FVGs.
Suppose a double top forms above current price.
Below the market, a bullish Fair Value Gap is present.
Price begins moving lower.
Retail traders may see the movement as confirmation that the double top is working as resistance.
But an ICT trader may expect price to first trade into the FVG.
The Fair Value Gap can become an area for price delivery.
After the gap is closed or partially delivered through, price may show willingness to move higher.
The market can then rally toward the double top.
The buy stops above the highs are taken.
Therefore, the movement lower does not always confirm a bearish double top.
It can be one stage of the liquidity delivery process.
The Role of Liquidity Voids
A liquidity void is another important part of the lesson.
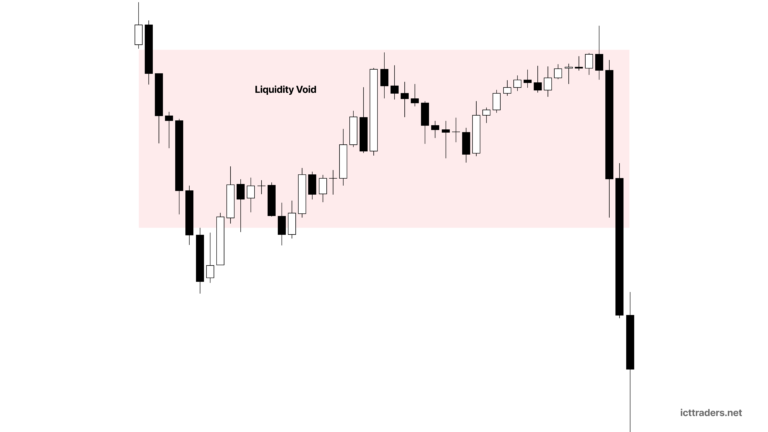
A liquidity void can form when price moves rapidly through a range with one-sided price delivery.
If a liquidity void remains above a double top, price may trade through the equal highs and continue higher into the void.
Consider this sequence:
Price forms a double top.
Buy stops remain above the highs.
Price moves lower into a bullish order block.
Price begins showing bullish price delivery.
Price rallies.
The double top is violated.
Buy-side liquidity is taken.
Price continues higher into the liquidity void.
The void is closed.
Price reaches a bearish area.
The market then moves lower.
In this situation, the double top is not the final reversal point.
It is liquidity on the way toward another price objective.
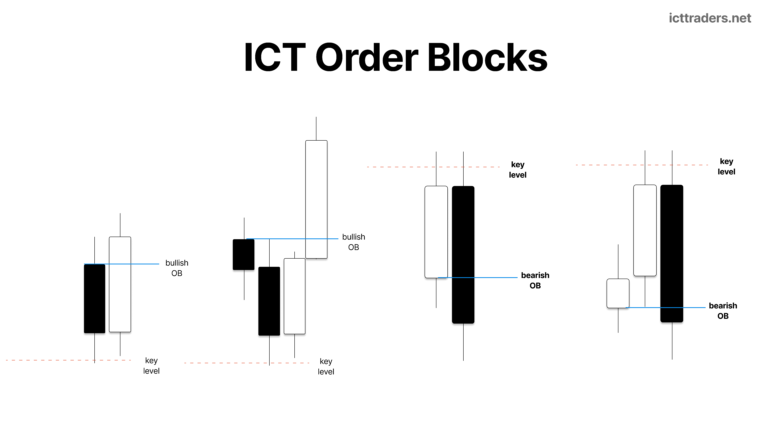
The Role of ICT Order Blocks
Order blocks can help an ICT trader understand where price may react before or after a liquidity run.
In the ICT example, price moves lower into a bullish order block.
The lesson focuses on the last down candle before the significant bullish movement.
Price trades into this range.
Then price shows willingness to rally.
The Double Top Trap begins to unfold.
Price moves higher.
The double top is taken.
Buy stops are cleared.
Price continues toward the liquidity void and a bearish order block.
The opposite concept can occur around a double bottom.
Price may rally into a bearish order block.
Then it can move lower.
Sell-side liquidity below the double bottom is taken.
Therefore, double tops and double bottoms should be studied with other ICT price arrays.
Measured Moves in the Double Bottom Double Top Trap
One of the most important concepts in the ICT is the measured move.
ICT does not only identify the liquidity above a double top or below a double bottom.
The range inside the formation can also be measured and projected beyond the liquidity level.
For a double top, identify the highs of the pattern.
Then identify the low between the two peaks.
Measure the price range from the high to the intermediate low.
This range can be projected above the double top.
The projected level may provide another upside price objective.
The basic idea is:
Double Top High − Intermediate Low = Range
Then:
Double Top High + Range = Projected Upside Objective
For a double bottom, the process is reversed.
Identify the lows.
Find the high between the two bottoms.
Measure the range from the low to the intermediate high.
Project the same range below the double bottom.
The basic idea is:
Intermediate High − Double Bottom Low = Range
Then:
Double Bottom Low − Range = Projected Downside Objective
The market may run the stop liquidity and continue toward the projected level.
Double Top Measured Move Example
In the mentorship example, a double top forms.
Retail traders see resistance and expect price to move lower.
The high-to-low range between the two peaks is measured.
The same range is projected above the double top.
This creates an expected algorithmic objective around 74.45.
Price rallies.
The double top is violated.
Buy-side liquidity is taken.
Price continues higher.
The market reaches approximately 74.46.
The projection was off by only one pip in the example.
Price then creates a subsequent move lower.
This shows why the Double Top Trap is not only about expecting price to move one or two pips above equal highs.
On a higher timeframe, the market may expand significantly beyond the double top.
Double Bottom Measured Move Example
The lesson then reverses the concept for a double bottom.
Retail traders see the equal lows as support.
Sell stops accumulate below the lows.
The price range inside the double bottom formation is measured.
The range is projected below the double bottom.
Price moves lower.
The sell-side liquidity below the lows is taken.
The market reaches the projected downside objective.
After reaching the level, price reacts higher.
The subsequent price move returns toward the double top reference.
This demonstrates how both sides of a trading range can become important algorithmic price references.
Why Price Can Move Beyond the Stop Run
Many traders expect a liquidity sweep to move only a small distance above a high or below a low.
But the ICT explains that the expected expansion can depend on the timeframe.
On a 5-minute or 15-minute chart, an intraday stop run may sometimes extend around 10 to 20 pips beyond an old high or low.
However, the same fixed expectation should not automatically be used on an hourly chart.
Higher timeframe price ranges can be much larger.
The market may use the internal range of the double top or double bottom to determine a larger projected expansion.
In one example, the measured range was approximately 48 pips.
The price objective was based on that range.
Therefore, traders should not blindly expect every stop run to be exactly 10 or 20 pips.
The timeframe and price range matter.
Double Tops and Bottoms at the Extremes of a Trading Range
ICT traders use double tops and double bottoms to frame the extremes of the current trading range.
A double top can define the upper side of the range.
A double bottom can define the lower side.
Huddleston explains:
“Extreme ends of the range is where high probability trading is.”
The middle of a trading range generally provides less clear liquidity information.
At the extremes, the trader can identify where stops may be resting.
Buy-side liquidity may exist above the range.
Sell-side liquidity may exist below the range.
The trader can then study which liquidity pool price is likely to seek first.
After one side is taken, the opposite side can become important.
How to Identify a Double Bottom Double Top Trap
First, find relatively equal highs or relatively equal lows.
For a Double Top Trap, identify two highs formed near the same price level.
For a Double Bottom Trap, identify two lows formed near the same level.
Next, identify the expected stop liquidity.
Above double tops, mark buy-side liquidity.
Below double bottoms, mark sell-side liquidity.
Then study the surrounding price arrays.
Look for:
Fair Value Gaps
Liquidity voids
Bullish order blocks
Bearish order blocks
Old highs
Old lows
Determine which side of liquidity price may attack first.
If necessary, measure the internal range of the double top or double bottom.
Project the range beyond the highs or lows.
Then watch price delivery.
Do not trade simply because two highs or two lows are present.
Build the complete price narrative.
Example of a Bullish Double Top Trap Model
A bullish Double Top Trap may develop like this:
Step 1: Price creates a double top.
Step 2: Retail traders identify resistance and sell.
Step 3: Buy stops accumulate above the equal highs.
Step 4: Price moves lower.
Step 5: The market trades into a Fair Value Gap or bullish order block.
Step 6: Sell-side delivery is completed at the lower price array.
Step 7: Price begins showing willingness to rally.
Step 8: Price moves toward the double top.
Step 9: Buy-side liquidity above the highs is taken.
Step 10: Price continues toward a liquidity void, bearish order block or measured-move objective.
Step 11: Price may react lower after the higher objective is reached.
The retail trader sees resistance.
The ICT trader sees liquidity.
Example of a Bearish Double Bottom Trap Model
A bearish Double Bottom Trap is the reverse.
Step 1: Price creates a double bottom.
Step 2: Retail traders identify support and buy.
Step 3: Sell stops accumulate below the equal lows.
Step 4: Price may first rally.
Step 5: The market reaches a bearish price array.
Step 6: Price begins showing willingness to move lower.
Step 7: Price trades toward the double bottom.
Step 8: The equal lows are violated.
Step 9: Sell-side liquidity is taken.
Step 10: Price may continue toward a measured-move objective or another lower price array.
Step 11: The market can react higher after completing the downside objective.
The retail trader sees support.
The ICT trader studies the sell-side liquidity below it.
What Happens After a Double Top or Double Bottom Is Taken?
Once price has taken the liquidity on one side of the market, the ICT trader should reconsider the next price objective.
Suppose price has already moved above a double top.
The buy stops are taken.
The trader should now ask:
Where is sell-side liquidity?
Are there clean lows below price?
Is there a Fair Value Gap below the market?
Has price reached a bearish order block or completed a measured-move projection?
The opposite applies after a double bottom is taken.
If sell-side liquidity has already been cleared, buy-side liquidity may become the next focus.
The important point is that liquidity conditions change after price trades through the old highs or lows.
Important Rules of Double Bottom Double Top Trap
Do not automatically treat a double top as resistance.
Do not automatically treat a double bottom as support.
Expect buy stops above relatively equal highs.
Expect sell stops below relatively equal lows.
Highlight clean highs and clean lows on the chart.
Study Fair Value Gaps around the double top or double bottom.
Identify liquidity voids that may attract price.
Use bullish and bearish order blocks to refine the price narrative.
Measure the internal range of the double top or double bottom when studying higher timeframe objectives.
Do not always use a fixed 10 or 20 pip stop-run expectation on higher timeframes.
Study the extremes of the trading range.
After one liquidity pool is taken, identify the opposing side of liquidity.
Remember that double top and double bottom reference levels may remain important even after time has passed.
Double Bottom Double Top Trap vs Traditional Support and Resistance
Traditional support and resistance trading assumes that previous highs may prevent price from moving higher and previous lows may prevent price from moving lower.
ICT studies the orders around those levels.
A traditional trader sees:
Double Top = Sell
Double Bottom = Buy
The ICT trader sees:
Double Top = Possible buy-side liquidity
Double Bottom = Possible sell-side liquidity
This does not mean every double top will immediately be broken.
It also does not mean every double bottom will immediately fail.
The lesson explains that these levels may take time to eventually trade through.
However, an ICT trader continues tracking these clean reference levels because the market may later return and seek the liquidity around them.
Final Thoughts on Double Bottom Double Top Trap
The Double Bottom Double Top Trap is based on understanding where traders commonly place their stop orders.
A double top looks like resistance to the retail trader.
But buy stops can build above the equal highs.
A double bottom looks like support.
But sell stops can accumulate below the equal lows.
ICT (Inner Circle Trader) analysis studies these highs and lows as liquidity reference points.
Price can move through a double top, clear buy-side liquidity and continue into a liquidity void, bearish order block or measured-move objective.
Price can trade below a double bottom, clear sell-side liquidity and expand toward a lower projected price level.
The important lesson is not to blindly trust the visual pattern.
Identify the liquidity.
Study the price arrays around it.
Measure the range when appropriate.
Then determine which side of the market price is likely to reach for.
This is the core idea behind the ICT Double Bottom Double Top Trap and why equal highs and equal lows can become some of the most important liquidity levels on a price chart.