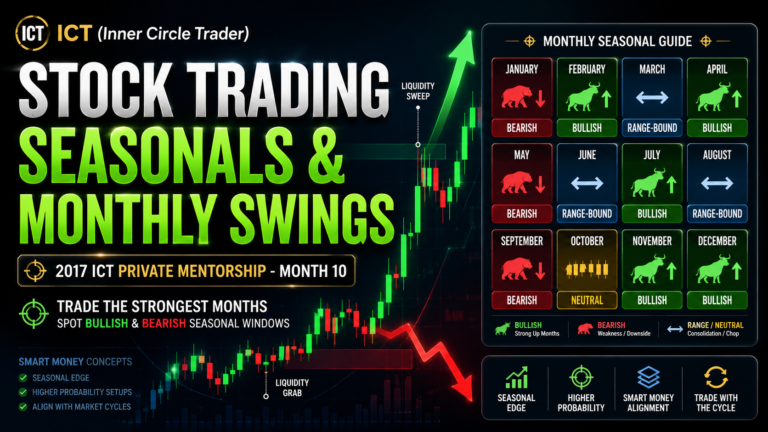
Stock Trading – Building Buy Watchlists is an ICT stock-selection framework used to identify companies that are showing relative strength before a seasonally bullish period in the broader stock market.
This concept was taught by Michael J. Huddleston, the founder of ICT (Inner Circle Trader), in the 2017 ICT Private Mentorship Core Content Month 10.
The method begins with a group of index stocks, such as the 30 companies in the Dow Jones Industrial Average, and gradually removes weaker candidates until only a small number of institutionally sponsored stocks remain.
Michael J. Huddleston explains the basic objective:
“Try to narrow the selection to two to four companies during your stock selection process.”
The purpose is not to buy every stock that appears bullish. It is to build a focused watchlist of companies displaying seasonal strength, bullish market structure, institutional accumulation and a clear path toward higher prices.
What Is a Stock Buy Watchlist?
A stock buy watchlist is a selected group of companies that may offer bullish swing-trading opportunities.
The list should not include every company in an index.
It should contain only stocks that meet specific technical, seasonal and fundamental conditions.
A strong buy watchlist may include companies that:
- Are already trending higher on the weekly chart
- Form higher lows while the broader index declines
- Trade near clean old highs
- Have room for a low-resistance liquidity run
- Show institutional accumulation
- Align with seasonally bullish months
- Have improving sales and profits
The watchlist allows the trader to concentrate on the strongest candidates instead of scanning hundreds of stocks every day.
Begin With a Defined Stock Universe
ICT demonstrates the process using the 30 stocks in the Dow Jones Industrial Average.
This is a practical starting point because the list is manageable and contains large, widely followed companies.
The same process can also be applied to:
- S&P 500 stocks
- Nasdaq 100 stocks
- Sector indices
- Industry groups
- Other liquid large-cap stocks
A larger index provides more choices, but it also requires more work.
For many traders, the Dow 30 alone can produce enough potential opportunities.
Filter One: Is the Stock Market Poised to Rally?
Before selecting individual stocks, determine whether the broader market is technically positioned to move higher.
This is the first and most important filter.
A bullish stock setup has a greater chance of success when:
- The Dow is expected to rally
- The S&P 500 is showing bullish institutional order flow
- Nasdaq is supporting the broader move
- Higher-timeframe indices are trading from discount
- Index SMT suggests accumulation
- Seasonal tendencies support higher prices
The goal is to trade strong stocks when the broader market is also likely to appreciate.
Michael J. Huddleston uses the simple analogy:
“In high tide, all boats rise.”
Most index stocks tend to benefit when the major averages are moving higher.
Filter Two: Select Higher-Low Stocks
During seasonally bullish periods, ICT looks for stocks that have formed a higher low.
The broader index may temporarily make a lower low, but a strong stock refuses to follow it lower.
This is a bullish relative-strength signal.
For example:
- The Dow makes a lower low.
- A stock forms a higher low.
- The stock fails to confirm the index decline.
- Institutional buying may be supporting the stock.
The stock is showing that large participants are unwilling to allow it to trade lower.
This can be interpreted as professional accumulation.
Bullish Seasonal Periods
ICT identifies two primary periods for building bullish stock watchlists.
These are:
- February through May
- October through January
These periods may offer favourable long swing setups.
The objective is not necessarily to hold a trade for the entire seasonal window.
The seasonal tendency provides the broader context in which bullish technical setups are prioritised.
A stock displaying accumulation immediately before a bullish seasonal period may offer an early sign that institutions are positioning ahead of the expected move.
February to May Bullish Window
The first major bullish period begins around February and continues into May.
During January, traders can begin comparing individual stocks with the major indices.
The strongest candidates may form higher lows while the Dow or another major index forms a lower low.
This suggests that institutions are accumulating those shares before the seasonal advance begins.
The process may look like this:
- Review the Dow 30 during January.
- Compare every stock with the Dow Jones Industrial Average.
- Identify stocks that fail to make a lower low.
- Confirm bullish weekly structure.
- Look for a discount PD Array.
- Determine whether price is near a clean breakout level.
- Build the final watchlist before the February-to-May period.
October to January Bullish Window
The same process can be applied during the second half of the year.
The October-to-January period may offer another favourable bullish window.
Before or during this period, traders should again look for:
- Higher lows
- Institutional accumulation
- Strong weekly structure
- Clear old highs
- Bullish Index SMT
- Seasonal support
The strongest stocks are often accumulated before the wider market advance becomes obvious.
Relative Strength Against the Index
Relative strength in this framework is not based on an oscillator.
It is determined by directly comparing the stock’s price movement with the broader market.
A stock displays relative strength when:
- The index makes a lower low.
- The stock forms a higher low.
- The stock declines less than the index.
- The stock breaks highs more easily.
- Bullish order blocks support price.
- Down-close candles attract buying.
This behaviour suggests institutional sponsorship.
Michael J. Huddleston explains that leadership stocks:
“Will be found to fail to drop lower during bullish months when the three major stock indices decline.”
The stock’s unwillingness to move lower is the key signal.
Using the Three Major Indices
The broader stock-market turn can be confirmed by comparing:
- Dow Jones Industrial Average
- S&P 500
- Nasdaq
During a decline, one of these indices may fail to form a lower low.
This creates bullish Index SMT divergence.
The divergence suggests that the wider market may be preparing to reverse higher.
At the same time, the trader should look for individual stocks that are also refusing to make lower lows.
The strongest buy candidates are therefore supported by two layers of relative strength:
- Relative strength among the major indices
- Relative strength between the stock and its benchmark index
Institutional Accumulation
A stock that refuses to make a lower low during index weakness may be under institutional accumulation.
Large institutions require significant liquidity to build positions.
Their activity can appear through:
- Higher lows
- Strong up-close weeks
- Repeated support at down-close candles
- Bullish gaps that later act as support
- Shallow retracements
- Breaks of old highs
- Failure to participate in index declines
The stock may look quiet before the larger move begins.
The lack of downside movement can itself be the evidence of buying.
Avoid Slow or Defensive Stocks
ICT recommends avoiding stocks that are safe but not particularly dynamic.
Examples mentioned in the lesson include companies such as:
- Verizon
- General Electric
- Coca-Cola
These companies may still appreciate, but they may not provide the aggressive expansion desired for a swing trade.
The watchlist should prioritise leadership stocks rather than simply selecting stable companies.
The strongest stocks should have:
- Clear bullish weekly structure
- Institutional sponsorship
- Strong earnings growth
- Nearby breakout levels
- Room for expansion
A safe stock is not always the best trading stock.
Focus on Two to Four Companies
After applying the initial filters, the list should be reduced to approximately two to four companies.
A smaller list helps the trader study each stock properly.
For every remaining candidate, review:
- Weekly market structure
- Daily market structure
- Earnings
- Sales growth
- Old highs
- PD Arrays
- Liquidity
- Seasonal tendencies
- Option pricing, if options are being considered
The goal is quality, not quantity.
A long watchlist can create indecision and encourage lower-quality trades.
Weekly Market Structure
Weekly structure is one of the most important final filters.
A strong bullish stock should already show an obvious tendency to move higher.
Useful weekly characteristics include:
- Higher highs
- Higher lows
- Bullish order flow
- Down-close candles acting as support
- Up-close candles being broken
- Price trading near an old high
- Clean liquidity resting above price
The best candidate is often already close to a major breakout level.
This allows a relatively small advance to trigger institutional buying and a low-resistance liquidity run.
Low-Resistance Liquidity Runs
A low-resistance liquidity run occurs when price has a clear path toward an old high or breakout level.
Institutions often favour stocks that are technically positioned to move through obvious highs.
Suppose a stock is trading at $132 and an old weekly high is located at $135.
Only a small move is needed to reach and break the liquidity above the old high.
This may be more attractive than a stock trading at $105 with its important old high at $120.
The second stock requires much more movement before the breakout can occur.
Michael J. Huddleston explains that institutions prefer:
“Big breakouts, big movements higher, especially on a weekly chart.”
The technical positioning should make the breakout easy to reach.
Clean Old Highs
Old weekly highs are important because they hold buy-side liquidity.
Strong candidates often trade close to:
- Previous yearly highs
- Multi-month highs
- Equal highs
- Major weekly resistance
- All-time highs
The old high should be clear and obvious.
A stock trading near a clean old high may be positioned for institutional breakout buying.
A stock located far below resistance may need too much energy before the larger expansion can begin.
Discount Arrays
The preferred stock should also provide an entry from a discount area.
Discount arrays may include:
- Bullish order blocks
- Fair value gaps
- Liquidity voids
- Old lows
- Discount half of a dealing range
- Sell-side liquidity runs
For example, a stock may gap higher and later retrace into that gap.
If the gap acts as a fair value gap inside discount, the retracement may provide a buying opportunity before the seasonal rally continues.
The strongest setup combines relative strength with a favourable entry location.
Apple as a Relative-Strength Example
Apple displayed bullish relative strength when the Dow made a lower low during January while Apple refused to follow it lower.
The shares formed support around the $118 to $120 area.
This suggested institutional accumulation.
Apple was also positioned near an important weekly high around $135.
The stock therefore had:
- Bullish relative strength
- Seasonal support
- Strong weekly structure
- A nearby breakout objective
- Institutional sponsorship
Once price broke the old high, it continued appreciating.
Boeing as a Breakout Candidate
Boeing also formed a higher low while the Dow moved lower.
Its weekly chart showed a clean old high and a technically favourable breakout structure.
Price had previously run below support, collected sell-side liquidity and then established bullish institutional order flow.
As the seasonal bullish period began, Boeing was positioned near the old high.
This made it attractive for institutional breakout buying.
The stock had less resistance compared with candidates that were positioned far below their historical highs.
Disney as a Weaker Candidate
Disney met the initial higher-low filter, but its weekly structure was less attractive.
The stock was trading significantly below an important high near $120.
It would need to rally a considerable distance before reaching the actual breakout point.
This made the stock less attractive than candidates such as Apple or Boeing.
The lesson is that relative strength alone is not enough.
The trader must also evaluate:
- Distance to the old high
- Cleanliness of market structure
- Potential resistance
- Amount of movement required before breakout
A stock can pass the first filter but fail the final selection process.
Home Depot as a Strong Candidate
Home Depot showed a higher low while the Dow declined.
The stock was also trading near an old weekly high.
This combination made it technically positioned for a breakout.
The setup included:
- Relative strength
- Strong weekly structure
- Nearby liquidity
- Seasonal bullishness
- Institutional accumulation
Once the old high was broken, price produced a meaningful advance.
McDonald’s as a Bullish Candidate
McDonald’s had already respected a bullish order block and was positioned beneath a clear old high.
The stock therefore had a visible low-resistance objective.
When the seasonal bullish period developed, price was able to break the old high and continue higher.
This illustrates why a stock inside a larger bullish consolidation can still be attractive when:
- The weekly structure remains sound
- A bullish order block has been respected
- The old high is close
- Institutional sponsorship is visible
Visa as a Valid but Slower Candidate
Visa also displayed a higher low and bullish weekly structure.
Price was positioned close to its highs and eventually expanded higher.
However, the move was less aggressive than some of the other candidates.
Visa still met the selection criteria, but it may have ranked below stronger stocks such as Apple, Boeing, Home Depot or McDonald’s.
This is why the watchlist should eventually be reduced to only the best two to four names.
Fundamental Confirmation
ICT also considers basic company fundamentals.
A company with improving quarterly sales and profits has a stronger basis for institutional buying.
Useful fundamental factors include:
- Increasing revenue
- Increasing profits
- Strong earnings
- Positive business outlook
- Stable financial condition
- Strong institutional interest
The strategy does not require complicated valuation models.
The fundamental information supports the seasonal and technical case.
Michael J. Huddleston describes the process as blending:
“A simple seasonal, fundamental and ultimately technical trading process.”
All three elements should support the same bullish narrative.
How to Build a Buy Watchlist Step by Step
A practical selection process may look like this:
- Choose a defined universe, such as the Dow 30.
- Identify the upcoming bullish seasonal period.
- Determine whether the broader stock market is poised to rally.
- Compare the Dow, S&P 500 and Nasdaq for bullish Index SMT.
- Overlay each stock with its benchmark index.
- Identify stocks that form higher lows while the index forms a lower low.
- Remove slow or defensive stocks.
- Review the weekly chart of every remaining company.
- Look for clean old highs and nearby buy-side liquidity.
- Eliminate stocks positioned too far below major resistance.
- Identify bullish order blocks, fair value gaps and discount arrays.
- Review quarterly sales and profit growth.
- Rank the remaining stocks by technical strength.
- Reduce the list to two to four companies.
- Wait for a valid entry rather than chasing price.
Buy Watchlist Checklist
Before adding a stock to the final watchlist, confirm:
- Is the broader stock market expected to rally?
- Is the seasonal period bullish?
- Are the major indices showing bullish SMT?
- Did the stock form a higher low?
- Did it resist the broader index decline?
- Is weekly market structure bullish?
- Are down-close weekly candles supporting price?
- Is the stock trading near a clean old high?
- Is there a low-resistance path toward buy-side liquidity?
- Is price near a discount array?
- Are quarterly sales improving?
- Are quarterly profits improving?
- Is the stock institutionally sponsored?
- Is it stronger than the other candidates?
- Can the list be reduced to two to four names?
Common Mistakes
Selecting Stocks Without Analysing the Broader Market
Even a strong company may struggle when the major indices are under bearish pressure.
Always begin with the overall stock-market condition.
Buying Every Higher-Low Stock
A higher low is only the first filter.
Weekly structure, old highs, fundamentals and seasonal timing must also be considered.
Choosing Stocks Far Below Their Breakout Levels
A stock requiring a large rally before reaching an old high may underperform a stock already positioned near its breakout.
Focusing on Safe Companies
Stable companies are not always the strongest trading candidates.
The watchlist should focus on leadership and expansion potential.
Building an Oversized Watchlist
Too many stocks dilute focus.
Reduce the final list to the best two to four candidates.
Ignoring Seasonal Timing
A bullish setup has more context when it forms during or before a historically favourable period.
Ignoring Fundamentals
Strong technical structure becomes more convincing when sales and profits are also improving.
Chasing an Extended Stock
A stock may meet every bullish condition but already be too extended from discount.
Wait for a suitable entry location.
Why the Watchlist Process Works
The process combines several independent forms of confirmation.
Seasonality identifies when bullish conditions are historically more favourable.
Index SMT indicates when the broader market may be turning higher.
Relative strength reveals which individual stocks institutions are accumulating.
Weekly structure identifies which stocks are positioned for clean breakouts.
Fundamental growth gives institutions a reason to continue buying.
When these factors align, the trader is not selecting a stock randomly.
The trader is choosing a technically strong company in a supportive market environment with clear institutional sponsorship.
Final Thoughts
Stock Trading – Building Buy Watchlists gives ICT traders a structured method for reducing a large stock universe into a small list of high-quality bullish candidates.
The process begins with the broader market.
The trader must first determine whether the Dow, S&P 500 and Nasdaq are technically positioned to rally.
During seasonally bullish periods, priority is given to stocks that form higher lows while their benchmark index makes a lower low.
This non-confirmation suggests institutional accumulation.
The strongest candidates should also have:
- Bullish weekly structure
- Nearby old highs
- Low-resistance liquidity
- Discount entry opportunities
- Improving sales
- Improving profits
- Clear institutional sponsorship
The final watchlist should contain only two to four companies.
The central principle is simple: select stocks that institutions are already supporting before the broader market advance becomes obvious.
As Michael J. Huddleston explains:
“You have every portion of a winning recipe for that stock to go higher.”