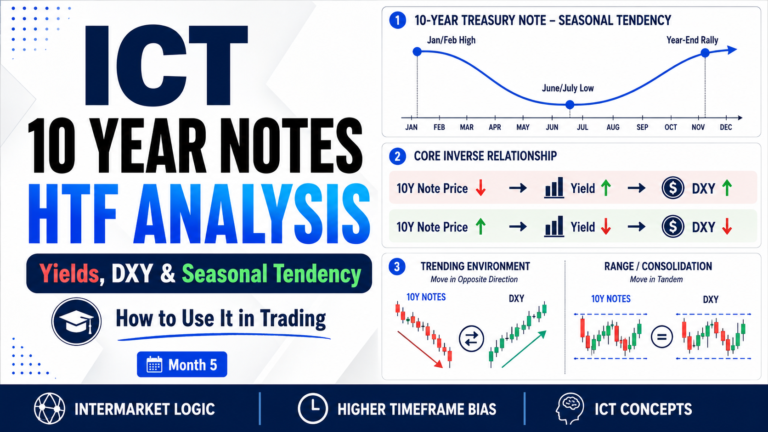
How To Use Bullish Seasonal Tendencies In HTF Analysis is a macro trading concept taught by Michael J. Huddleston, founder of the ICT (Inner Circle Trader) concepts. This concept is taught in the ICT Mentorship Core Content – Month 5 and explains how historical seasonal tendencies can help traders build a higher timeframe directional bias.
Seasonal tendencies show periods of the year when a market has historically shown a repeated tendency to move higher or lower.
However, ICT does not use seasonality as an automatic trade signal.
As Michael J. Huddleston explains:
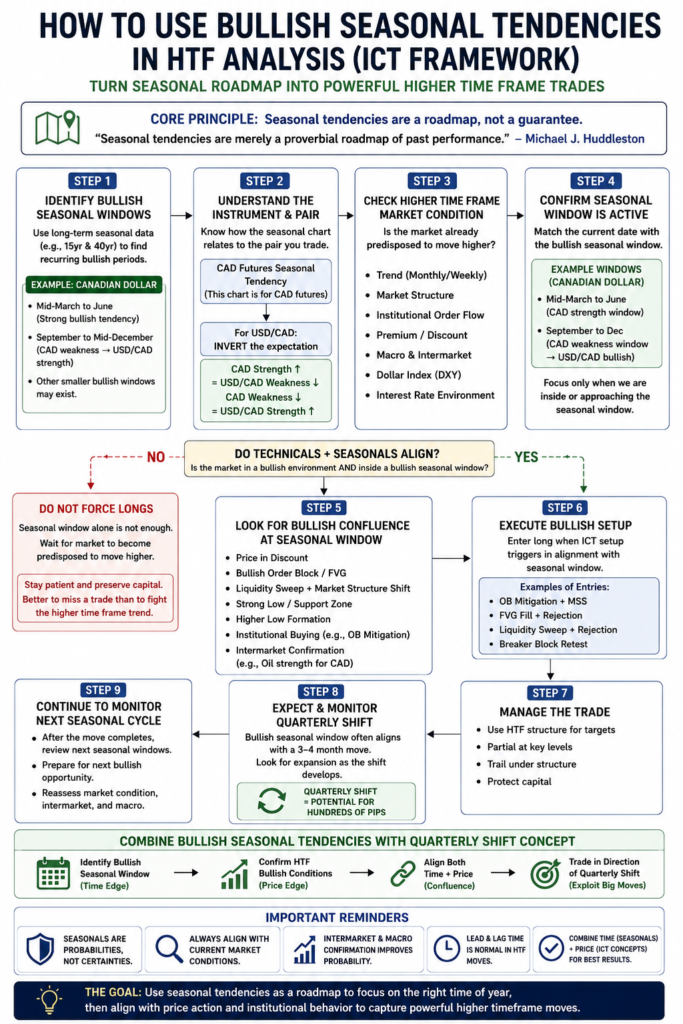
“Seasonal tendencies are merely a proverbial roadmap of past performance.”
The seasonal roadmap must be combined with the existing higher timeframe trend, institutional order flow, Quarterly Shifts, and related market analysis.
What Are Bullish Seasonal Tendencies?
A bullish seasonal tendency is a recurring period where a market has historically shown a stronger tendency to rally.
For example, historical data may show that a currency or commodity frequently moves higher between March and June.
This does not mean price must rally every year.
It simply identifies a time window where bullish movement has occurred frequently in historical market data.
The basic idea is:
Historical bullish period → Identify the recurring time window → Confirm bullish HTF conditions → Look for buying opportunities
ICT uses seasonal tendencies to answer an important question:
At what time of the year should I be more interested in buying?
Seasonal Tendencies Are Not Guaranteed
Seasonality should never be treated as a guaranteed forecast.
A market may historically rally during a specific period and still decline during a particular year.
Michael J. Huddleston explains:
“Simply because it’s done something in the past doesn’t in any way guarantee it’s going to do the same thing in the future.”
Therefore, traders should not buy simply because a bullish seasonal period has started.
Seasonality is one more element of confluence.
The market should already show characteristics that support a bullish higher timeframe idea.
Seasonal Tendencies as a Higher Timeframe Roadmap
The main purpose of seasonal analysis is to create a roadmap for the year.
Some quarters may historically favor bullish price movement.
Other quarters may favor bearish movement.
The trader can study these recurring tendencies and prepare for potential higher timeframe moves.
For example:
First quarter → Possible accumulation or transition
Second quarter → Historical bullish tendency
Third quarter → Possible change in direction
Fourth quarter → Another recurring seasonal move
The exact pattern depends on the individual market.
ICT traders should therefore study the seasonal tendency of the specific currency, commodity, or asset class being analyzed.
Using Long-Term Seasonal Data
ICT discusses seasonal charts built from many years of historical price data.
In the Canadian Dollar example, a 40-year seasonal tendency was compared with a 15-year average.
The important seasonal movements showed very little difference between the two datasets.
The purpose is not to study every small fluctuation in the seasonal chart.
Instead, traders look for the strongest and most obvious recurring seasonal moves.
A gradual two-week rise may not be important.
A repeated three or four-month bullish cycle can be much more useful for higher timeframe analysis.
Canadian Dollar Bullish Seasonal Tendency
The Canadian Dollar provides an example of a bullish seasonal tendency.
Historically, the Canadian Dollar futures market shows a strong tendency to rally from approximately mid-March into May or June.
The seasonal idea becomes:
Mid-March → Bullish seasonal period begins
April → Bullish tendency remains active
May → Seasonal strength continues
June → Potential completion of seasonal move
This creates a period where a trader may become more interested in Canadian Dollar strength.
However, the higher timeframe market should already be predisposed to move higher.
If the weekly chart is strongly bearish, the trader should not blindly force a long position because of seasonality.
The Importance of Futures and Forex Inversion
One of the most important parts of using seasonal tendencies in Forex is understanding how the currency pair is formed.
The seasonal chart may be based on the Canadian Dollar futures contract.
However, most Forex traders study:
USD/CAD
USD is the base currency.
CAD is the quote currency.
Therefore, Canadian Dollar strength generally produces weakness in USD/CAD.
The relationship is:
Canadian Dollar Futures ↑ → CAD strength → USD/CAD ↓
Canadian Dollar Futures ↓ → CAD weakness → USD/CAD ↑
The expected movement must therefore be inverted when applying Canadian Dollar futures seasonality to USD/CAD.
Why USD/CAD Seasonal Analysis Is Inverted
Suppose the Canadian Dollar futures contract has a bearish seasonal tendency between September and December.
A futures trader may look for Canadian Dollar weakness.
However, a Forex trader studying USD/CAD should reverse the idea.
CAD futures bearish → Canadian Dollar weakness
Canadian Dollar weakness → USD/CAD strength
Therefore:
Bearish CAD Futures Seasonality → Bullish USD/CAD Seasonal Bias
This inversion is extremely important.
A trader who directly copies the futures seasonal direction onto USD/CAD may end up trading in the wrong direction.
Bullish USD/CAD Seasonal Tendency
ICT highlights a period from approximately September into mid-December or close to Christmas where the Canadian Dollar futures market has historically shown weakness.
Because USD/CAD is inverted relative to Canadian Dollar futures, this creates a potential bullish seasonal tendency for USD/CAD.
The seasonal roadmap becomes:
September → Begin watching for USD/CAD bullish conditions
October → Bullish seasonal tendency active
November → Potential continuation
December → Seasonal window approaches completion
This does not mean buying USD/CAD every September.
The underlying USD/CAD market should already show bullish higher timeframe conditions.
Match Seasonality With the Higher Timeframe Trend
Seasonal tendency becomes more useful when it agrees with the underlying market direction.
Suppose USD/CAD is already bearish on the weekly chart.
A bullish seasonal window begins.
Should the trader automatically buy?
No.
ICT shows periods where the bullish seasonal tendency produced only a small rally because the underlying weekly market remained bearish.
The stronger opportunity appears when:
USD/CAD higher timeframe trend → Bullish
Institutional order flow → Bullish
Seasonal tendency → Bullish
Quarterly Shift expectation → Bullish
When these conditions align, seasonality becomes a stronger supporting factor.
Market Structure Shift and Seasonal Tendency
A seasonal window can become more significant after a higher timeframe change in market structure.
For example, price may form a major low.
The market then shifts into bullish structure.
Institutional order flow becomes bullish.
At the same time, the historical bullish seasonal window begins.
The process may look like:
Major low forms → Market structure shifts bullish → Institutional order flow turns bullish → Bullish seasonal window begins → Look for long opportunities
The seasonal tendency is not creating the trade by itself.
It is confirming a market that is already showing bullish characteristics.
Combining Seasonal Tendencies With Quarterly Shifts
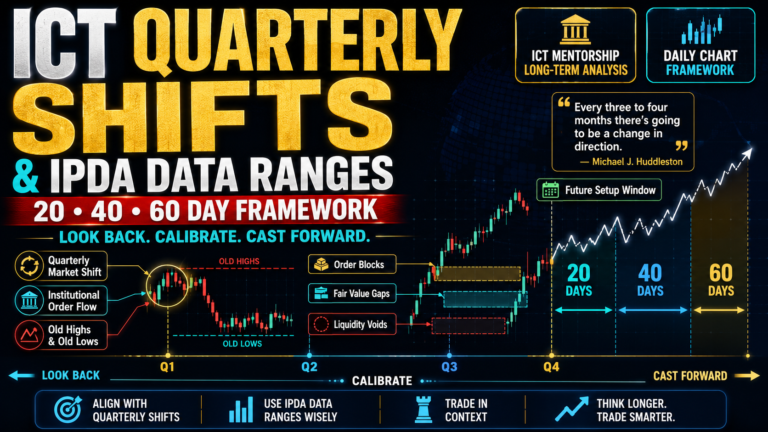
ICT teaches that important higher timeframe moves can develop around three to four-month cycles.
This is the basis of the Quarterly Shift concept.
Seasonal tendencies help traders determine the potential direction of that quarterly move.
Quarterly Shift tells the trader:
A meaningful higher timeframe move may develop.
Seasonal tendency helps answer:
Should I be more interested in buying or selling?
For example:
Market predisposed to move higher
Bullish seasonal period approaching
Potential Quarterly Shift developing
The trader should focus on a bullish Quarterly Shift.
As Michael J. Huddleston explains:
“Seasonal tendencies give us a road map.”
The roadmap helps traders identify quarters of the year where buying or selling may have stronger historical support.
Look for Markets Already Predisposed to Go Higher
ICT does not search for a bullish seasonal tendency and then force the market to fit the idea.
The better process is to first identify a market with bullish higher timeframe conditions.
Then check whether a strong bullish seasonal tendency is approaching.
The ideal alignment is:
Bullish macro condition
Bullish higher timeframe order flow
Strong historical bullish seasonal tendency
Potential Quarterly Shift
Related market confirmation
This produces a stronger seasonal trade idea.
The seasonal tendency should support an existing market narrative.
Using Crude Oil to Confirm Canadian Dollar Seasonality
The Canadian Dollar has an important relationship with crude oil.
ICT uses crude oil as a related market when studying Canadian Dollar seasonal tendencies.
Crude oil historically shows a bullish seasonal tendency from around mid-February or March into May and June.
The Canadian Dollar also shows a strong tendency to rally around the March-to-June period.
Therefore:
Crude oil seasonal tendency → Bullish
Canadian Dollar seasonal tendency → Bullish
The two related markets can support the same macro idea.
This is a form of intermarket confirmation.
Crude Oil Bullish Seasonal Window
The crude oil seasonal tendency discussed by ICT generally focuses on:
March → Seasonal strength begins
April → Potential continuation
May → Bullish tendency remains active
June → Seasonal period approaches completion
Historical price action showed rallies occurring inside this period even when crude oil was in a broader bearish market.
This does not mean the bearish higher timeframe trend should be ignored.
It shows that a recurring seasonal rally can still appear inside a larger downtrend.
ICT warns traders not to force these trades.
The seasonal tendency is simply highlighting a period where bullish price movement has historically occurred.
Canadian Dollar and Crude Oil Seasonal Confluence
The stronger idea appears when Canadian Dollar and crude oil seasonal tendencies align.
For example:
Crude oil → Bullish March-to-June tendency
Canadian Dollar futures → Bullish March-to-June tendency
CAD and crude oil → Related markets
This creates additional confirmation for Canadian Dollar strength.
For USD/CAD traders, remember the inversion:
CAD strength → USD/CAD bearish
Therefore, bullish CAD and crude oil seasonal tendencies may support a bearish higher timeframe idea in USD/CAD.
This is why traders must understand the underlying market before applying seasonal data.
How To Use Bullish Seasonal Tendencies In HTF Analysis
A simple ICT process can be followed.
Step 1: Identify the Strong Seasonal Window
Study historical seasonal data and mark the strongest bullish period.
Step 2: Study the Higher Timeframe Trend
Use the weekly and daily charts.
Determine whether the market is already predisposed to move higher.
Step 3: Understand the Instrument
Determine whether the seasonal chart represents futures price or the Forex pair directly.
Step 4: Check for Inversion
For pairs such as USD/CAD, reverse the Canadian Dollar futures seasonal expectation.
Step 5: Study Institutional Order Flow
Look for bullish higher timeframe conditions and important price levels.
Step 6: Look for a Quarterly Shift
Determine whether a new three to four-month move may be developing.
Step 7: Compare Related Markets
For Canadian Dollar analysis, crude oil can provide supporting seasonal confirmation.
Step 8: Focus on the Seasonal Direction
When the macro trend and seasonal tendency align, prioritize trades in that direction.
Seasonal Tendency Does Not Give the Entry
A seasonal tendency tells the trader when a market may be predisposed to move.
It does not provide the exact entry price.
The trader still needs an execution model.
For example:
Bullish seasonal window identified → HTF order flow bullish → Quarterly Shift favors higher prices → Wait for ICT setup → Execute long
The trader may use ICT concepts such as:
Liquidity
Order Blocks
Fair Value Gaps
Premium and Discount
Market Structure Shift
SMT Divergence
The seasonal tendency creates the higher timeframe context.
The ICT setup provides the trade execution.
The Biggest Mistake With Seasonal Trading
The biggest mistake is assuming every seasonal tendency must work every year.
Michael J. Huddleston discusses making this mistake during his early study of seasonal markets.
Seeing repeated historical patterns can make seasonal charts appear like a guaranteed roadmap.
But they are not guarantees.
A trader should never use excessive risk simply because a seasonal period has historically been strong.
The correct approach is:
Seasonality + HTF trend + institutional order flow + correlated market confirmation
The more elements that support the same direction, the stronger the trade premise may become.
Final Thoughts
How To Use Bullish Seasonal Tendencies In HTF Analysis begins with viewing seasonality as a historical roadmap, not an automatic buy signal.
ICT traders identify periods where a market has repeatedly shown bullish price movement and then compare that seasonal window with the current higher timeframe market condition.
The Canadian Dollar provides an important example. Canadian Dollar futures have shown a bullish seasonal tendency around March to June, while weakness in CAD futures from September toward December can translate into a bullish seasonal bias for USD/CAD because of the futures-to-Forex inversion.
Crude oil can also provide supporting confirmation because its seasonal behavior is closely related to Canadian Dollar analysis.
The strongest seasonal opportunities appear when higher timeframe institutional order flow, market structure, Quarterly Shifts, seasonal tendencies, and related markets all support the same direction.
Seasonality does not tell a trader to blindly buy. It helps identify when a market already predisposed to move higher may have historical seasonal support behind that move.