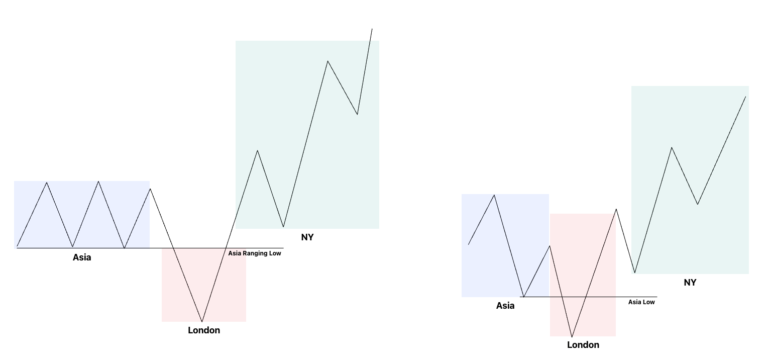
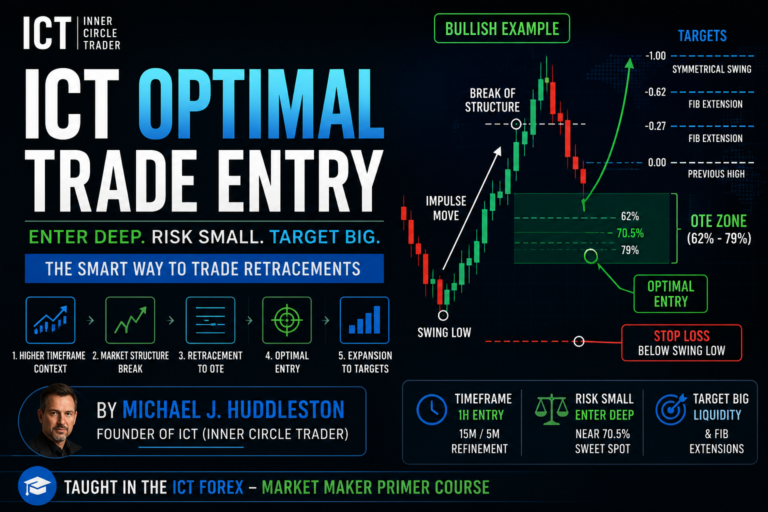
Target Selection & Profit Objectives is an important part of the ICT (Inner Circle Trader) methodology because a trade is incomplete without a logical price objective. Taught by Michael J. Huddleston in the ICT Forex – Market Maker Primer Course, this concept focuses on identifying probable weekly highs and lows by measuring price swings and finding clusters of projected target levels.
The objective is not to enter a trade and randomly choose a fixed number of pips.
Instead, the trader studies where multiple price projections agree.
As Michael J. Huddleston explains:
“The bulk of what I’m gonna teach you here is an overlapping or confluence of Fibonacci levels in the form of extensions.”
When several Fibonacci extensions, measured moves, liquidity levels, and institutional price levels converge in the same area, that price zone can become a logical target.
What Is Target Selection in ICT Trading?
In ICT trading, target selection is the process of identifying a probable price objective before or during a trade.
The target should be based on the expected delivery of price.
For bullish conditions, traders look for areas above price where the market may form a weekly high or reach a significant upside objective.
For bearish conditions, traders look below price for potential weekly lows and downside objectives.
The basic framework is:
Bullish Weekly Bias → Measure Upside Projections → Find Fibonacci Confluence → Select Upside Target
Bearish Weekly Bias → Measure Downside Projections → Find Fibonacci Confluence → Select Downside Target
The target is therefore linked to the directional bias.
Start With the Weekly Bias
Before measuring intraday price swings, ICT traders first need a directional premise.
The trader should determine whether the upcoming or current week is expected to be bullish or bearish.
Huddleston explains:
“Before we even consider running target measurements from the intraday price action each day, we have to have a premise in mind that sets the tone for this market.”
This is important because the same price swings can produce both upside and downside Fibonacci projections.
Without directional bias, the chart can become cluttered with unrelated target levels.
If the weekly expectation is bullish, focus on bullish projections.
If the weekly expectation is bearish, focus on bearish projections.
Bias determines which measurements matter.
Measuring Bullish Weekly Targets
When the weekly bias is bullish, the trader is trying to determine how far price may expand above an existing swing high.
The process begins with a meaningful bullish price swing.
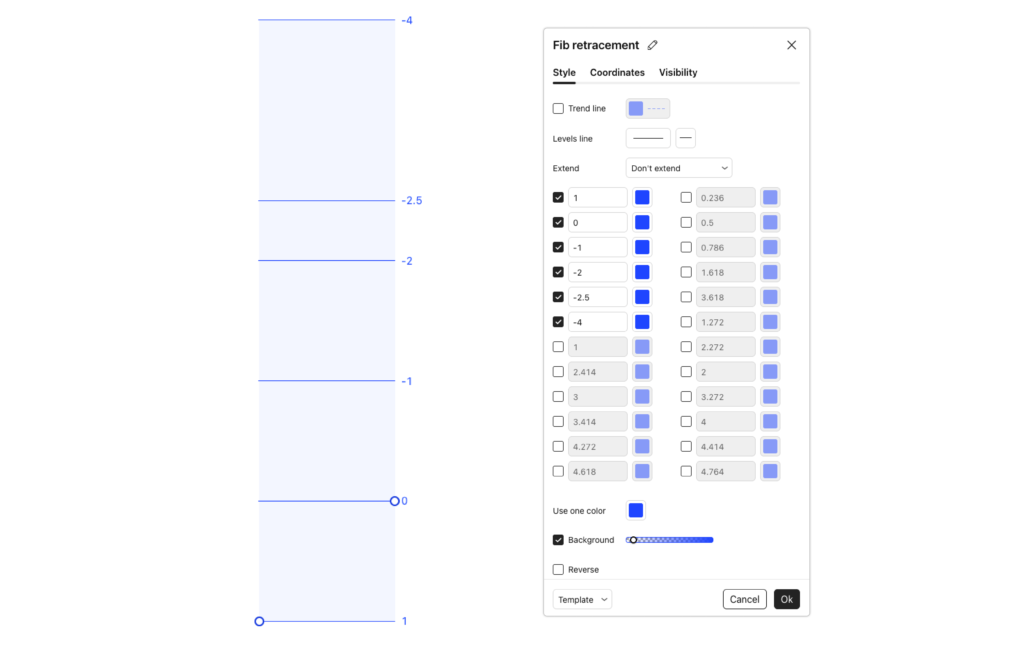
ICT generally measures from the lowest candle body open or close to the highest candle body open or close.
The price swing may look like:
Swing Low → Bullish Impulse → Swing High
The Fibonacci measurement is then used to project upside objectives.
Common objectives include:
- Target 1
- Target 2
- Symmetrical price swing
These projections provide a larger framework before the trader begins measuring smaller intraday movements.
The initial higher timeframe projections remain in the trader’s mind as potential weekly objectives.
Measure the Parent Price Swing First
One important concept in Target Selection & Profit Objectives is identifying the parent price swing.
The parent swing is the larger and more significant price movement.
For example:
Major Low → Strong Bullish Expansion → Major High
Inside this move, there may be several smaller swings.
These smaller swings are subordinate price swings.
The trader should not treat every small movement as equally important.
Huddleston explains that some swings are simply part of consolidation or internal movement and may have little significance.
Therefore:
Large Dynamic Swing = Parent Price Swing
Smaller Internal Swing = Subordinate Price Swing
The parent swing provides the broader target framework.
Subordinate swings are then used to find additional confluence.
Why Some Price Swings Should Be Ignored
Not every high and low needs to be measured.
Suppose price creates a low, rallies slightly, declines again, and then returns into the same consolidation.
That small internal swing may have little importance.
The trader should ask:
Did this price swing create meaningful displacement?
Did it break important structure?
Did it take liquidity?
Did price expand significantly away from the level?
A swing inside a choppy consolidation may be ignored.
Huddleston states:
“This swing is the parent price swing. This is a subordinate price swing within the overall swing.”
The goal is to measure relevant price delivery, not every fluctuation.
Understanding Fibonacci Extension Confluence
The core of ICT target selection is Fibonacci extension confluence.
A trader measures several important price swings.
Each swing creates projected extension levels.
The trader then looks for areas where multiple projections appear close together.
For example:
Price Swing A → Target 2 at 1.1924
Price Swing B → Extension at 1.1928
Price Swing C → 300% Extension at 1.1930
Price Swing D → 200% Extension at 1.1935
These targets are grouped inside a relatively small price range.
This creates a target confluence zone.
The concept is:
Multiple Independent Price Measurements → Similar Projected Price Area → Higher-Probability Objective
The more meaningful measurements that overlap, the more attention the area may deserve.
How Close Should Fibonacci Levels Be?
Huddleston provides a practical guideline for determining whether two projected levels should be considered a confluence.
Approximately 10 to 15 pips of separation may be acceptable depending on market structure.
Less than 10 pips is preferable.
A very tight grouping of less than five pips is particularly noteworthy.
Huddleston explains:
“Anything more than 15 pips I’m not really willing to let that be deemed a confluence. If it can be less than 10 pips, it’s even better.”
Therefore:
0–5 Pips Apart → Very Tight Confluence
Less Than 10 Pips → Strong Confluence
10–15 Pips → Possible Confluence
More Than 15 Pips → Generally Too Far Apart
This gives the trader a practical framework for grouping target projections.
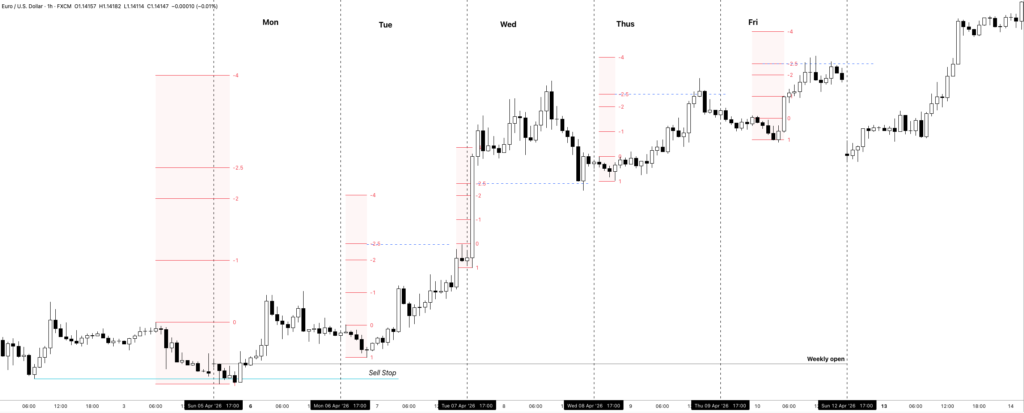
Bullish Target Selection Process
Suppose the weekly bias is bullish.
Price declines into an Optimal Trade Entry area on Tuesday and begins expanding higher.
The trader first uses the parent bullish swing to project larger objectives.
Next, smaller bullish impulse swings are measured.
The trader focuses on price movements where the market moved lower to gather buy orders and then expanded higher.
Each relevant bullish swing is measured.
The sequence is:
Bullish Weekly Bias → Identify Parent Swing → Project Major Targets → Measure Relevant Bullish Swings → Mark Fibonacci Extensions → Find Overlapping Levels
When several levels cluster together, the trader identifies the likely upside objective.
Measuring the Dynamic Price Swing
ICT places particular attention on the largest or most dynamic price move.
Suppose a bearish market creates a sharp impulse lower.
The trader measures the largest move from the relevant candle body high to the candle body low.
Why?
Because the market may replicate that price range.
This creates the concept of a measured move or symmetrical price swing.
For example:
Original Bearish Impulse = 100 Pips
Projected Bearish Expansion = Another 100 Pips
The second movement may reach a similar distance.
The same applies in bullish conditions.
The larger dynamic move can therefore provide an important target projection.
What Is a Symmetrical Price Swing?
A symmetrical price swing is a projected price movement equal to the range of an earlier impulse move.
The logic is:
First Price Swing Range = Projected Second Price Swing Range
For bullish conditions:
Bullish Impulse Range → Project Same Range Higher
For bearish conditions:
Bearish Impulse Range → Project Same Range Lower
Huddleston uses this measurement as one of several possible objectives.
A symmetrical price swing should not necessarily be used as the only target.
Instead, the trader asks whether the measured move overlaps with other Fibonacci extensions.
Symmetrical Swing + Fibonacci Extension Confluence = More Interesting Objective
Finding the Equilibrium Between Larger Targets
Sometimes a smaller price projection appears directly between two larger target levels.
For example:
Higher Timeframe Target 1
Smaller Swing Extension
Higher Timeframe Target 2
If the smaller projection lies near the midpoint between the larger targets, the level may gain significance from an equilibrium perspective.
Huddleston specifically notes that a target appearing directly in the middle of a larger projected range can draw his attention.
The trader is looking for agreement between multiple ways of measuring price.
Measuring Bearish Weekly Targets
The bearish target selection process is the opposite of the bullish model.
The trader begins with a bearish weekly bias.
Price may rally early in the week, particularly into Tuesday, creating an opportunity to establish short positions.
The trader then identifies downside price objectives.
The basic model is:
Bearish Weekly Bias → Early Week Rally → Weekly High Forms → Price Expands Lower → Downside Targets
The trader measures significant bearish price swings and projects Fibonacci extensions below price.
The goal is to identify where the weekly low may form.
Equal Lows as Bearish Profit Objectives
Liquidity remains important in target selection.
Suppose there are equal lows below price.
If the weekly bias is bearish, the trader should immediately consider the possibility that price may seek the sell-side liquidity below those lows.
Huddleston describes thinking approximately 20 to 30 pips below equal lows in certain Forex scenarios.
The concept is:
Equal Lows → Sell Stops Below → Bearish Weekly Bias → Potential Downside Objective
Fibonacci projections can then be used to determine whether extension levels overlap with the liquidity area.
If they do, the target becomes more compelling.
Equal Highs as Bullish Profit Objectives
The same logic applies in bullish conditions.
Equal highs can indicate buy-side liquidity above price.
If the weekly bias is bullish, the market may expand toward or through the equal highs.
The trader can measure bullish Fibonacci extensions and compare them with the liquidity pool.
The model becomes:
Equal Highs → Buy Stops Above → Bullish Weekly Bias → Potential Upside Objective
If several Fibonacci projections overlap near the equal highs, the area may become a high-interest profit objective.
Combine Liquidity With Fibonacci Targets
The strongest target-selection framework does not rely on Fibonacci alone.
ICT traders can combine:
- Buy-side liquidity
- Sell-side liquidity
- Equal highs
- Equal lows
- Old swing highs
- Old swing lows
- Fibonacci extensions
- Symmetrical price swings
- Institutional price levels
For example:
Bearish Weekly Bias → Equal Lows Below → 300% Extension → 200% Extension → Symmetrical Price Swing
If all these elements point toward the same price area, the downside objective becomes more logical.
The complete framework is:
Directional Bias + Liquidity + Multiple Price Projections = Potential Profit Objective
Institutional Price Levels in Target Selection
Huddleston also considers institutional price increments when choosing the final target.
These can include price levels ending in:
- 00
- 20
- 50
- 80
He may also use nearby five and zero levels when refining an exit.
Suppose several bullish Fibonacci projections cluster between 1.1924 and 1.1935.
Possible target choices may include:
1.1920
1.1925
1.1930
1.1935
The trader then determines how aggressive or conservative the exit should be.
Huddleston states:
“I’m either picking a 5 level or a zero level. The closer I can get to an institutional level, the better.”
These round or institutional levels help refine a broader target zone into a practical exit price.
Conservative vs Aggressive Profit Objectives
Once a Fibonacci confluence zone is identified, the trader still needs to decide exactly where to take profit.
Suppose several projected levels cluster from 1.1924 to 1.1935.
The trader could choose:
Conservative Exit → 1.1920
Moderate Exit → 1.1925 or 1.1930
Aggressive Exit → 1.1935
Huddleston generally prefers being conservative.
His objective is to be filled before price reaches the extreme end of the projected area.
This means accepting that some price movement may be left on the table.
The goal is not to sell the exact high or buy back the exact low.
The goal is to secure profit at a logical objective.
Why ICT Takes Profit Before the Exact Target
One of the most practical lessons in Target Selection & Profit Objectives is the importance of exiting slightly before the projected level.
Suppose multiple downside Fibonacci projections cluster between 1.2681 and 1.2689.
A trader holding a short position might technically expect price to reach 1.2681.
However, Huddleston may choose to cover at 1.2695.
Why?
Because he wants the exit order to be filled.
He explains:
“I want to be just a little bit ahead of all those overlapping fibs because I want to make sure I get my price.”
This is a highly practical approach.
The market may reverse one or two pips before the projected objective.
Spread can also affect the actual executable price.
Leaving a small amount of the move unclaimed can improve execution consistency.
Factor the Spread Into Profit Targets
Forex traders must consider the spread when selecting exact exit prices.
Suppose the projected low is 1.2681.
A trader holding a short position needs to buy back the position.
Depending on the spread, the actual executable exit may occur several pips higher.
Therefore, the technical target and practical exit price may not be identical.
The trader should account for:
Projected Price Objective
Broker Spread
Market Volatility
Order Execution
This is another reason ICT may select a target slightly before the exact Fibonacci projection.
Why Candle Bodies Are Used for Measurements
Huddleston emphasizes measuring price swings using the bodies of the candles rather than relying heavily on wicks.
He describes the candle bodies as representing the bulk of price delivery or volume.
Wicks may vary between brokers.
Different price feeds can display slightly different highs and lows.
Huddleston explains:
“The wicks are always going to be slightly off relative to your brokers.”
Therefore, using the highest and lowest relevant opens or closes can create more consistent Fibonacci measurements.
The general method is:
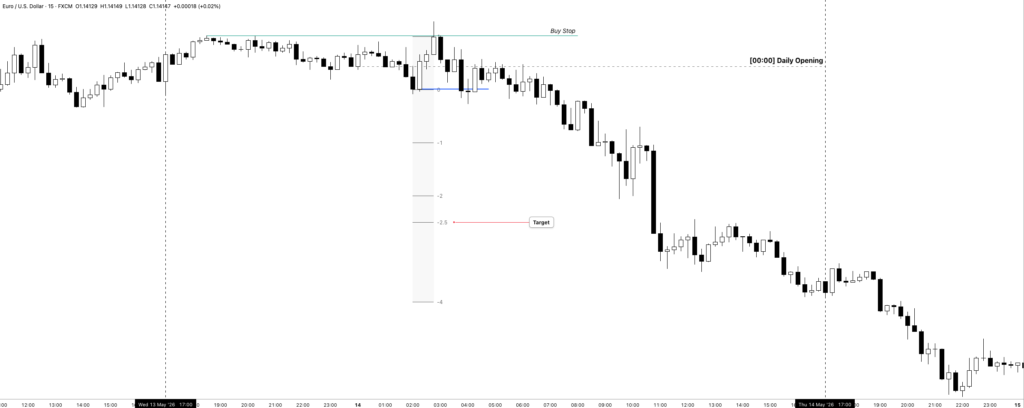
Bullish Measurement → Lowest Relevant Body to Highest Relevant Body
Bearish Measurement → Highest Relevant Body to Lowest Relevant Body
This is especially important when looking for tight Fibonacci confluence.
A Simple Bullish Target Selection Framework
A bullish weekly target can be selected using the following process.
Step 1: Establish a Bullish Weekly Bias
Determine why the market is expected to trade higher.
Step 2: Identify the Parent Price Swing
Find the larger meaningful bullish price movement.
Step 3: Project Major Fibonacci Objectives
Mark Target 1, Target 2, and the symmetrical price swing.
Step 4: Measure Relevant Smaller Swings
Focus on bullish impulse swings that produced meaningful expansion.
Step 5: Mark Extension Levels
Project the Fibonacci objectives from each price swing.
Step 6: Find Tight Groupings
Look for multiple levels within approximately 10 to 15 pips.
Step 7: Compare With Liquidity
Identify old highs, equal highs, and buy-side liquidity.
Step 8: Check Institutional Levels
Look for nearby 00, 20, 50, or 80 price levels.
Step 9: Select a Conservative Exit
Place the target slightly before the main confluence area.
The process is:
Bullish Bias → Parent Swing → Extension Measurements → Fibonacci Confluence → Buy-Side Liquidity → Institutional Level → Profit Target
A Simple Bearish Target Selection Framework
For bearish conditions:
Step 1: Establish a Bearish Weekly Bias
Determine why lower prices are expected.
Step 2: Identify the Parent Bearish Swing
Find the largest meaningful downside move.
Step 3: Project Major Downside Targets
Mark Fibonacci extension and measured-move objectives.
Step 4: Measure Relevant Bearish Swings
Focus on price rallies that led to strong downside expansion.
Step 5: Find Overlapping Extensions
Look for tight clusters of projected downside targets.
Step 6: Compare With Sell-Side Liquidity
Identify equal lows and old swing lows.
Step 7: Consider Institutional Levels
Find nearby round or institutional pricing levels.
Step 8: Account for Spread
Determine the practical executable exit price.
Step 9: Exit Before the Extreme Projection
Choose a conservative profit objective.
The process becomes:
Bearish Bias → Parent Swing → Fibonacci Extensions → Confluence Zone → Sell-Side Liquidity → Institutional Level → Profit Target
Common Mistakes in Target Selection
Choosing a Random Pip Target
A fixed 20-pip or 50-pip target may have no relationship with market structure.
Targets should be based on price objectives.
Measuring Every Price Swing
Some swings are insignificant internal movements.
Focus on parent swings and meaningful impulse moves.
Using Fibonacci Without Directional Bias
Bullish and bearish projections can clutter the chart.
Start with a weekly premise.
Demanding the Exact High or Low
Price may reverse before the projected objective.
A conservative exit is often more practical.
Ignoring Spread
The exact chart price may not be the exact executable exit price.
Using Wicks for Every Measurement
Different broker feeds may create wick discrepancies.
ICT places greater emphasis on candle bodies for these measurements.
Final Thoughts
Target Selection & Profit Objectives provides ICT traders with a structured method for determining where price may form a weekly high or weekly low.
The process begins with directional bias.
A bullish weekly bias directs attention toward upside price projections.
A bearish weekly bias directs attention toward downside objectives.
The trader first measures the parent price swing and then studies meaningful subordinate swings. Fibonacci extensions, symmetrical price swings, liquidity levels, and institutional price levels are compared.
When multiple measurements overlap within a tight area, the trader has a potential target confluence zone.
The core framework is:
Weekly Bias → Parent Price Swing → Multiple Fibonacci Measurements → Extension Confluence → Liquidity → Institutional Price Level → Conservative Profit Objective
The purpose is not to predict the exact final pip of a market move.
The objective is to identify a highly probable price area, select a practical exit slightly before it, and avoid holding a profitable trade without a clear reason for where price is expected to go.