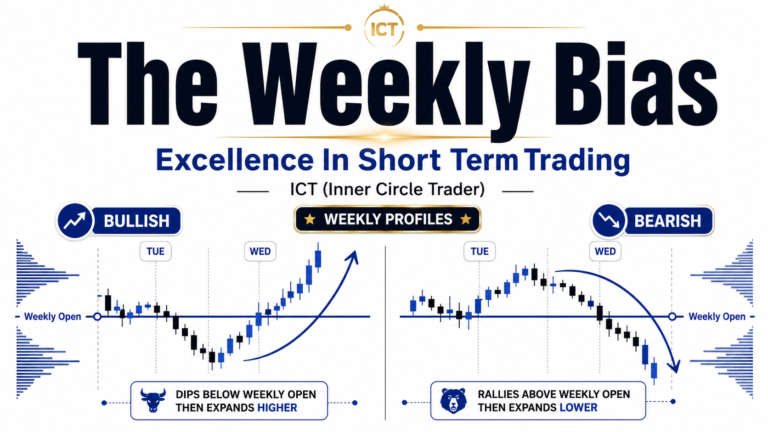
Trading The Key Swing Points is an important timing concept in the ICT (Inner Circle Trader) methodology. Taught by Michael J. Huddleston in the ICT Forex – Market Maker Primer Course, this concept helps traders understand when significant intraday highs, lows, retracements, and reversals are most likely to form.
The main idea is that important price turning points often develop around four major periods:
- Asian Open
- London Open
- New York Open
- London Close
These periods do not always create the same type of price movement. However, when their timing overlaps with an important higher timeframe price level, they can produce significant and high-probability swing points.
As Michael J. Huddleston explains:
“When these specific key swing points or time of day overlap with higher timeframe levels, you can anticipate what would be otherwise expected on the higher time frame.”
What Are Key Swing Points in ICT Trading?
In ICT trading, key swing points are significant intraday turning points that often form during specific market sessions or time-of-day windows.
A key swing point may create:
- The daily high
- The daily low
- An intraday retracement
- A continuation point
- A liquidity raid
- A larger reversal point
The objective is not to assume that London must always create the low or that New York must always create a retracement.
Instead, traders study how price is being engineered through the daily range and determine which session is most likely to create the next meaningful swing.
Engineering the Daily Range
The concept of Trading The Key Swing Points is closely connected to the ICT Power of Three model.
The general Power of Three framework is:
Accumulation → Manipulation → Distribution
In a classic bullish daily profile:
Asia Consolidation → London Creates the Daily Low → Price Expands Higher → London Close Helps Form the Opposite End of the Range
In a bearish profile:
Asia Consolidation → London Creates the Daily High → Price Expands Lower → London Close Helps Form the Opposite End of the Range
However, this is only a general model.
Huddleston makes it clear that the daily range can be engineered differently.
Sometimes:
- Asia creates the daily high or low.
- London becomes a retracement.
- New York creates the daily high or low.
- London Close becomes a liquidity raid or reversal point.
Understanding these variations makes the trader more flexible.
The Asian Open as a Key Swing Point
The Asian Open is often associated with consolidation.
In the classic ICT model, the Asian session establishes a range before London creates the manipulation and expansion.
However, Asia can also create the actual high or low of the day.
For example, in a bullish market:
Asian Session Creates the Daily Low → Price Expands Above the Asian Range → London Retraces Lower → Bullish Continuation
When Asia has already created the low and price begins expanding higher, a decline during London does not necessarily indicate bearishness.
The London decline may simply be a retracement of the initial bullish impulse.
The sequence may appear as:
Asian Low → Bullish Impulse → London Retracement → Optimal Trade Entry Area → Expansion Higher
This is an important distinction.
A trader who assumes that London must create the low may incorrectly interpret the London retracement as a new bearish move.
The London Open as a Key Swing Point
The London Open is one of the most important intraday swing-point periods in ICT trading.
London can create the high or low of the daily range.
In a bullish Power of Three profile:
Asian Consolidation → London Creates Daily Low → Bullish Expansion
In bearish conditions:
Asian Consolidation → London Creates Daily High → Bearish Expansion
However, London can also function as a retracement when the Asian session has already created the daily extreme.
For example:
Asia Creates Daily Low → Price Rallies → London Retraces Into Bullish Price Area → Price Continues Higher
In this situation, the London Open becomes a continuation entry opportunity rather than the origin of the daily range.
The trader must therefore understand the existing intraday price structure before interpreting the London swing.
The New York Open as a Key Swing Point
The New York Open can also create important daily highs and lows.
One scenario involves a liquidity raid.
Suppose price remains in consolidation before New York and the higher timeframe bias is bearish.
During the New York Open, price may rally above equal highs or another buy-side liquidity pool.
This can create:
Consolidation → New York Liquidity Raid → Daily High → Bearish Expansion
In this case, the New York Open creates the high of the day.
The movement above the highs is not necessarily bullish continuation. It may be the liquidity event required before price moves lower.
New York can therefore create the actual daily extreme.
New York as a Retracement From the London Move
One of the classic ICT scenarios occurs when London has already created the daily high or low.
Suppose the market is bullish.
London creates the low and produces a clear bullish impulse swing.
Price then retraces during the London lunch period or approaching the New York Open.
The sequence becomes:
London Low → Bullish Impulse → New York Retracement → Bullish Continuation → Daily High
Huddleston describes this as one of the easier New York Open scenarios.
As he states:
“This is the classic scenario. This is what I teach and have taught for years. This is the easiest setup when we want to trade the New York open.”
The bearish model works in reverse:
London Creates High → Bearish Impulse → New York Retracement Higher → Bearish Continuation
The key requirement is that the trader should already have a directional expectation.
Do not simply trade every New York retracement.
The London Close as a Key Swing Point
The London Close frequently helps create the opposite end of the daily range.
For example, if London created the low of a bullish trading day, London Close may occur near the higher portion of the day’s range.
A typical bullish profile may appear as:
London Daily Low → Expansion Higher → London Close Near Daily High
For bearish conditions:
London Daily High → Expansion Lower → London Close Near Daily Low
However, the London Close does not always create the opposite end of the range.
It can also create the actual daily high or low after raiding liquidity.
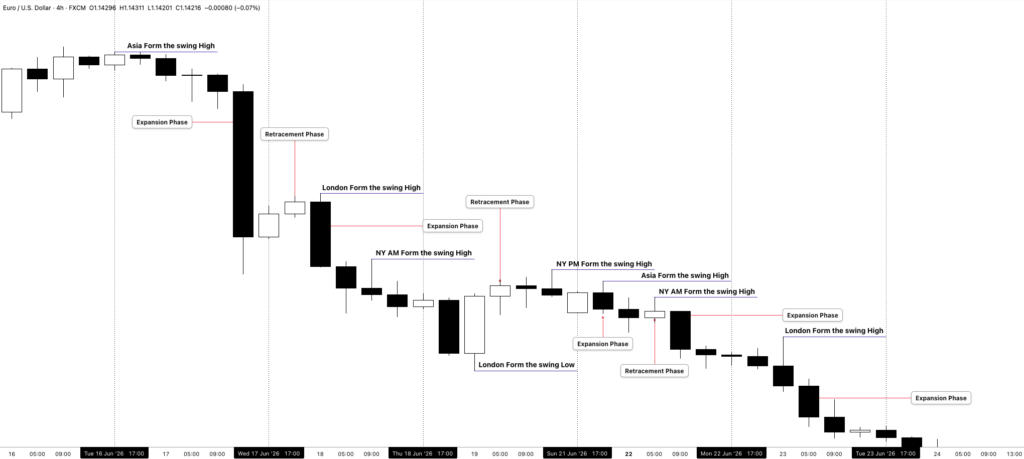
London Close Liquidity Raids
Suppose price has been consolidating and equal highs are visible.
During the London Close, price may trade above those equal highs, take the liquidity, and then reverse lower.
The sequence becomes:
Equal Highs → London Close Buy-Side Liquidity Raid → Daily High → Reversal Lower
The opposite can occur with equal lows:
Equal Lows → London Close Sell-Side Liquidity Raid → Daily Low → Reversal Higher
The timing of the London Close can therefore help identify a potential exhaustion or reversal point.
London Close as a Larger Reversal Point
The London Close can sometimes create more than an intraday turning point.
It may align with a significant longer-term reversal.
For example, price may have been trading higher over several sessions.
During the London Close on Friday, the market creates an important high and reverses.
The following week may consolidate and then begin expanding significantly lower.
This means the London Close swing point can occasionally become:
- A daily turning point
- A weekly turning point
- A significant intermediate-term high or low
The session timing alone does not create the reversal.
The importance comes from its relationship with higher timeframe price structure.
Combine Key Swing Points With Higher Timeframe Levels
This is the most important part of Trading The Key Swing Points.
Session timing should not be used in isolation.
The best setups occur when an important time-of-day swing point overlaps with a meaningful higher timeframe price level.
These levels may include:
- Daily resistance
- Daily support
- Weekly highs or lows
- Monthly highs or lows
- Higher timeframe liquidity
- Important swing points
- ICT PD Arrays
Suppose the daily chart shows an important resistance level.
Price trades higher throughout the day and reaches that resistance during London Close.
Even if the day has been bullish, the combination of:
Daily Resistance + London Close Timing
may create a strong selling opportunity.
The sequence is:
Higher Timeframe Resistance → Price Trades Into Level → Key Swing-Point Time Window → Reversal Confirmation → Sell Setup
The same logic applies to support.
Higher Timeframe Support → Price Trades Into Level → Key Swing-Point Time Window → Bullish Reaction → Buy Setup
Time provides the window.
Price provides the level.
Context provides the directional expectation.
Price and Time Must Work Together
A common mistake is focusing only on time.
A trader may think:
“It is London Open, so price must reverse.”
This is incorrect.
The London Open, New York Open, or London Close becomes more meaningful when price is trading at an important location.
The stronger framework is:
Higher Timeframe Level + Correct Intraday Context + Key Time Window = Potential High-Probability Swing Point
For example:
Daily Resistance + Buy-Side Liquidity + New York Open = Potential Bearish Swing
Weekly Support + Sell-Side Liquidity + London Open = Potential Bullish Swing
Equal Highs + London Close = Potential Liquidity Raid and Reversal
Without higher timeframe context, time-based swing points can produce misleading signals.
Study Key Swing Points on the 15-Minute and 30-Minute Charts
Huddleston recommends studying these concepts on the 15-minute or 30-minute timeframe.
The purpose is to observe when significant highs and lows actually form.
Study:
- Daily highs and lows
- Intraday swing highs and lows
- Weekly highs and lows
- Monthly highs and lows
Then ask:
When did the turning point form?
Was it during Asia?
Was it during London Open?
Was it during New York Open?
Was it during London Close?
Next, compare the swing point with the higher timeframe chart.
Was price trading at daily resistance?
Was price attacking weekly liquidity?
Was price reacting from a major support level?
Over time, the trader begins seeing a repeated storyline.
Huddleston states:
“You will see a storyline over time studying it in reference to the higher time frames’ key support resistance levels.”
This chart study is essential for developing practical understanding.
A Simple Framework for Trading The Key Swing Points
A trader can apply this concept using the following process.
Step 1: Determine the Higher Timeframe Context
Study the daily and weekly charts.
Identify important support, resistance, liquidity, and major swing points.
Step 2: Establish the Directional Expectation
Determine whether price is more likely to seek higher or lower prices.
Step 3: Study the Asian Session
Determine whether Asia is consolidating or has already created a potential daily high or low.
Step 4: Watch the London Open
Ask whether London is creating the daily extreme or retracing the move that began during Asia.
Step 5: Evaluate the London Impulse
If London creates a clear directional move, determine whether New York may retrace that impulse.
Step 6: Watch the New York Open
Look for a liquidity raid, daily extreme, or continuation retracement.
Step 7: Monitor London Close
Determine whether price is completing the daily range, raiding liquidity, or reaching a higher timeframe level.
Step 8: Look for Time and Price Confluence
The highest-quality swing points generally occur when the key time window overlaps with an important price level.
Common Mistakes When Trading Key Swing Points
Assuming London Always Creates the Daily High or Low
London frequently creates the daily extreme, but not always.
Asia or New York can also create the high or low.
Trading Time Without Price Context
A session opening does not automatically produce a valid setup.
Always consider higher timeframe levels.
Ignoring the Asian Expansion
When Asia has already produced a meaningful impulse, London may simply retrace that move.
Misreading New York Liquidity Raids
A New York rally above equal highs can create the daily high in a bearish market.
The liquidity raid should be interpreted within the larger bias.
Ignoring London Close
Many traders stop studying price after the New York morning.
London Close can still create significant liquidity events, daily extremes, and larger reversal points.
Final Thoughts
Trading The Key Swing Points helps ICT traders understand how important intraday highs, lows, retracements, and reversals can develop around specific time-of-day windows.
The four primary swing-point periods are:
Asian Open → London Open → New York Open → London Close
Each period can play a different role in engineering the daily range.
Asia may consolidate or create the daily extreme.
London may create the high or low or retrace the Asian move.
New York may create a liquidity raid, continuation retracement, or daily turning point.
London Close may complete the daily range or create a significant reversal.
The key is to combine time with higher timeframe price levels.
As Huddleston explains, when these time windows trade into important higher timeframe levels, traders may find significant and high-probability turning points.
Instead of predicting every session with a rigid model, study how the daily range is being engineered and wait for price and time to align.