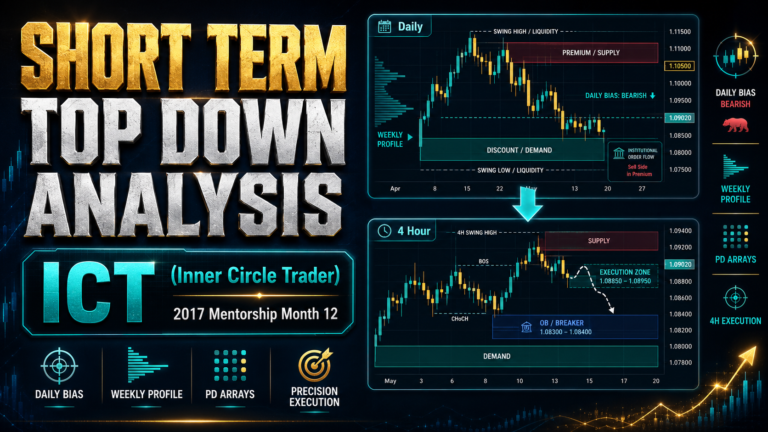
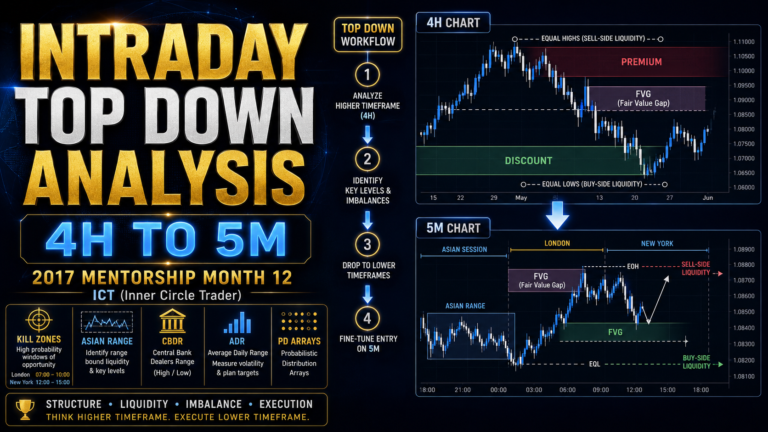
Long Term Top Down Analysis is a structured method of studying the market from the highest relevant timeframe before moving toward weekly, daily, and intraday charts. The objective is to establish a clear directional bias, identify important institutional price levels, and ensure that lower-timeframe trades align with the broader market narrative.
Michael J. Huddleston, the founder of ICT (Inner Circle Trader) concepts, teaches this framework in the 2017 ICT Private Mentorship Core Content Month 12. His approach begins with the monthly chart and combines seasonal tendencies, quarterly shifts, interest rates, market structure, intermarket relationships, market profiles, and the PD Array Matrix.
The monthly analysis is then transferred to the weekly chart, where the trader can refine the long-term idea into an intermediate-term trading plan.
“The more things we have in confluence supporting a specific idea, bias, or analysis perspective, the better.”
What Is Long Term Top Down Analysis?
Long Term Top Down Analysis is the process of beginning with the monthly chart and gradually moving toward lower timeframes.
The trader does not begin by searching for an entry on the five-minute or fifteen-minute chart. Instead, the trader first determines:
- The likely long-term direction
- The current market profile
- The important monthly dealing range
- Relevant premium and discount arrays
- Institutional support and resistance levels
- Potential liquidity objectives
- Conditions that could support continuation or reversal
Once these factors have been defined, the information is transposed to the weekly chart.
The weekly chart then provides a more detailed view of how the monthly expectation may develop.
This creates a clear sequence:
Monthly bias, weekly structure, daily framework, intraday execution.
Why the Monthly Chart Matters
The monthly chart provides the broadest practical view of institutional price delivery.
Each monthly candle contains a large amount of information. It can represent weeks of institutional accumulation, distribution, repricing, or consolidation.
Monthly analysis helps the trader understand:
- Whether the market is trending or ranging
- Whether the recent move is continuation or retracement
- Where long-term highs and lows are forming
- Which liquidity pools may be targeted
- Whether price is trading at a premium or discount
- Which PD arrays may influence the next several months
ICT performs this analysis once a month, preferably as soon as the previous monthly candle closes.
There is no need to repeat the entire long-term process before every intraday trade. The long-term framework is established monthly and then monitored as new price information develops.
“Once a month, you have to define what it is you’re looking for.”
The Purpose of Long Term Top Down Analysis
The main purpose of the process is to create a monthly directional bias.
This bias helps answer several important questions:
- Should the trader primarily look for buying or selling opportunities?
- Is the market likely to continue its current trend?
- Is a quarterly reversal becoming more likely?
- Which monthly levels could act as support or resistance?
- Which external or internal liquidity may be targeted?
- Which lower-timeframe setups should be ignored?
A bullish monthly bias does not mean price must rise every day.
It means that lower-timeframe declines may be interpreted as potential buying opportunities when they reach qualified discount arrays.
A bearish monthly bias means that rallies into premium arrays may provide selling opportunities.
The ICT Long Term Top Down Analysis Process
ICT organizes the monthly analysis into a logical sequence.
The process includes:
- Seasonal tendencies
- Quarterly shifts
- Interest-rate differentials
- Current market profile
- Intermarket analysis
- Market structure
- SMT divergence
- PD Array Matrix
- Key price levels
- Monthly directional bias
Each stage adds another layer of confirmation.
The trader does not rely on one signal. The goal is to build a market narrative from multiple supporting factors.
Start With Seasonal Tendencies
Seasonal tendencies are the first part of ICT Long Term Top Down Analysis.
A seasonal tendency describes the historical tendency of a market to strengthen, weaken, form a high, or form a low during a particular time of year.
Examples may include:
- A currency forming a seasonal low during a specific month
- Bonds strengthening during a recurring yearly period
- Stocks forming a fall low before a year-end rally
- Agricultural commodities responding to planting or harvest cycles
Seasonal tendencies do not guarantee an outcome.
They provide a time-based expectation that must be supported by price action, interest rates, market structure, and institutional levels.
ICT begins with time before price.
“My concepts are primarily time and price, not price and time. It’s time, then price.”
This means the trader first asks what the market historically tends to do during the current or upcoming month.
The trader then studies price to determine whether conditions support that seasonal expectation.
Preparing for Seasonal Tendencies
Seasonal analysis should be performed before the relevant month begins.
A trader can create a yearly calendar that records:
- Important currency seasonals
- Commodity seasonal highs and lows
- Stock-market seasonal buying periods
- Bond-market seasonal tendencies
- Historical turning points
The goal is not to force a trade because a seasonal date has arrived.
The goal is to know which markets may deserve closer attention.
When a seasonal tendency aligns with a quarterly shift, interest-rate conditions, market structure, and a qualified PD array, the setup becomes more significant.
Quarterly Shifts
Markets frequently experience meaningful changes every three to four months.
A market that has been rising for several months may begin a correction or reversal.
A market that has been declining may form an intermediate-term or long-term low and begin moving higher.
Quarterly shifts help the trader avoid assuming that the recent direction must continue indefinitely.
The trader should examine the previous three to four months and ask:
- Has price been rising consistently?
- Has price been declining?
- Is price consolidating?
- Is the recent move likely to continue?
- Is the market approaching a seasonal turning point?
- Is a reversal or retracement becoming more likely?
The quarterly shift is not a rigid three-month rule.
ICT allows flexibility because some market cycles can extend toward four months.
Studying the 9-to-18-Month Trend
The long-term monthly trend is evaluated by reviewing approximately nine to eighteen monthly candles.
This helps determine whether the market has been:
- Bullish
- Bearish
- Consolidating
- Transitioning between trends
When the 9-to-18-month trend is clearly bullish, ICT prefers to look for quarterly buying opportunities.
When it is clearly bearish, he prefers to look for quarterly selling opportunities.
The aim is to avoid repeatedly trying to predict the absolute top or bottom of a long-term trend.
Long-term trends can remain in place much longer than traders expect.
What If the Long-Term Trend Is Unclear?
If the 9-to-18-month trend is unclear or the market is consolidating, ICT considers the possibility that the previous three-to-four-month move may reverse.
For example:
- If price has declined for three months inside a larger consolidation, the coming month may produce a bullish retracement.
- If price has rallied for several months inside a range, the market may begin moving lower.
- If one side of the consolidation has already been raided, price may be drawn toward the opposite side.
This expectation still requires confirmation from other elements of the analysis.
It should not be used as an automatic reversal signal.
Interest Rates as a Fundamental Driver
Interest rates are a major part of Long Term Top Down Analysis.
ICT considers interest rates one of the most important drivers across asset classes.
They can influence:
- Currencies
- Bonds
- Stocks
- Commodities
- Capital flows
- Inflation expectations
- Risk appetite
For currencies, the trader compares central-bank interest rates.
A currency with a higher interest rate may attract capital relative to a currency with a lower rate.
This creates a potential interest-rate differential trade.
For example, if one country has a significantly higher interest rate than another, the trader may search for technical conditions that support buying the higher-yielding currency against the lower-yielding one.
Interest Rates and the Stock Market
Bond prices and interest rates generally move inversely.
When bond prices decline, interest rates rise.
Higher interest rates may create difficulties for stocks because borrowing costs increase and alternative fixed-income investments become more attractive.
When bond prices rise, interest rates decline.
Lower interest rates may provide a more supportive environment for equities.
This relationship should not be used as a mechanical signal, but it provides important macroeconomic context.
Inflationary and Deflationary Conditions
Commodity prices can help traders interpret inflationary and deflationary conditions.
When commodities broadly rise, the market may be experiencing inflationary pressure.
When commodities broadly decline, the environment may be deflationary.
These conditions can affect multiple asset classes.
An inflationary environment may influence:
- Interest-rate expectations
- Bond prices
- Currency valuations
- Commodity trends
- Equity-sector performance
A deflationary environment may produce the opposite response.
Not every commodity will move in the same direction, but the general behavior of the commodity complex can provide useful macroeconomic information.
Determine the Current Market Profile
After seasonal and macroeconomic analysis, ICT determines the current market profile.
The market can generally be classified as:
- Consolidating
- Trending
- Retracing
- Reversing
Each profile creates a different expectation.
Consolidating Market Profile
A consolidation represents a period in which price is trading within a defined range.
ICT views consolidation as the preparation phase for the next expansion.
The trader should identify:
- The range high
- The range low
- The midpoint
- Buy-side liquidity above the range
- Sell-side liquidity below the range
- Institutional clues indicating which side may be taken first
If price breaks one side of the range and quickly returns inside it, the move may represent a false breakout or liquidity raid.
Price may then be drawn toward the opposite side of the consolidation.
Trending Market Profile
When the market is trending, the trader should generally favor continuation.
A bullish trend encourages the trader to search for retracements into discount arrays.
A bearish trend encourages the trader to search for rallies into premium arrays.
ICT avoids attempting to call every top or bottom in a strong trend.
The trend remains the preferred directional framework until evidence suggests that an intermediate-term or long-term reversal has formed.
Retracement Market Profile
When price is retracing, the trader should determine where the retracement may terminate.
The PD Array Matrix provides potential institutional support or resistance levels.
In a bullish trend, price may retrace toward:
- A bullish order block
- A fair value gap
- A breaker
- A rejection block
- An old low
- Equilibrium
- Another discount array
In a bearish trend, price may retrace toward:
- A bearish order block
- A fair value gap
- A breaker
- A rejection block
- An old high
- Another premium array
The trader then looks for continuation after price reaches the appropriate level.
Intermarket Analysis
Intermarket analysis compares related markets to support or challenge a trading idea.
Markets can be:
- Positively correlated
- Negatively correlated
- Influenced by the same macroeconomic driver
For example, a bullish US dollar may support:
- Lower EUR/USD prices
- Lower GBP/USD prices
- Weakness in certain commodities
- Lower gold prices under normal conditions
A bearish dollar may support:
- Higher foreign currency prices
- Stronger commodity prices
- Higher gold prices
- Broader inflationary behavior
These relationships are not perfect.
Safe-haven demand, war, political instability, or unusual macroeconomic conditions can temporarily disrupt normal correlations.
Positively and Negatively Correlated Markets
A positively correlated market should generally confirm the directional idea.
A negatively correlated market should generally move in the opposite direction.
Suppose the trader is bullish on a particular currency.
The trader may look for:
- Strength in a positively correlated market
- Weakness in the opposing currency
- Confirmation from the Dollar Index
- SMT divergence between related instruments
If the related markets disagree, the trader may reduce conviction or wait for more information.
Market Structure Analysis
Market structure helps determine whether short-term, intermediate-term, or long-term highs and lows are controlling price.
The trader studies:
- Higher highs
- Higher lows
- Lower highs
- Lower lows
- Failed swing highs
- Failed swing lows
- Breaks in structure
- Displacement
A possible long-term or intermediate-term high may be forming when:
- Price makes a high
- A lower high follows
- Another lower high develops
- Related markets show bearish SMT divergence
A possible long-term or intermediate-term low may be forming when:
- Price makes a low
- A higher low follows
- Another higher low develops
- Related markets show bullish SMT divergence
SMT Divergence in Long Term Analysis
SMT divergence compares related markets that should normally move in a similar or inverse relationship.
A bullish SMT divergence may occur when:
- One correlated market makes a lower low
- Another related market fails to make a lower low
This indicates relative strength in the market that holds the higher low.
A bearish SMT divergence may occur when:
- One market makes a higher high
- Another related market fails to make a higher high
This indicates relative weakness in the market that forms the lower high.
SMT divergence can be applied to:
- Currency pairs
- The Dollar Index and foreign currencies
- Stock indices
- Commodities
- Positively correlated assets
It helps identify institutional accumulation or distribution that may not be obvious from one chart alone.
Favor the Current Market Structure
ICT prefers to trade in the direction supported by market structure, seasonal tendencies, interest rates, and intermarket confirmation.
When these factors collectively support higher prices, he avoids taking countertrend short positions.
When they collectively support lower prices, he avoids countertrend buying.
This applies even to lower-timeframe scalping.
The monthly directional framework is designed to reduce unnecessary trades against institutional order flow.
Selecting the Monthly Dealing Range
The PD Array Matrix must be applied to a clearly defined portion of price action.
ICT normally selects a meaningful monthly range within the previous nine to eighteen months.
The range should contain a relevant swing high and swing low.
This allows the trader to classify price as being in:
- Premium
- Equilibrium
- Discount
The dealing range also helps identify internal and external liquidity.
The selected range should be based on actual market structure rather than an arbitrary number of candles.
Premium and Discount
Once the dealing range has been selected, the midpoint represents equilibrium.
Price above equilibrium is in premium.
Price below equilibrium is in discount.
In a bullish environment, the trader prefers to buy within discount.
In a bearish environment, the trader prefers to sell within premium.
The premium-discount framework does not independently determine direction.
It must be used together with the broader monthly bias.
A market can remain in premium during a strong bullish trend or remain in discount during a strong bearish trend.
The PD Array Matrix
The PD Array Matrix identifies institutional reference points within the dealing range.
Possible discount arrays include:
- Bullish order blocks
- Bullish breakers
- Fair value gaps
- Liquidity voids
- Rejection blocks
- Old lows
- Sell-side liquidity
Possible premium arrays include:
- Bearish order blocks
- Bearish breakers
- Fair value gaps
- Liquidity voids
- Rejection blocks
- Old highs
- Buy-side liquidity
Not every dealing range will contain every PD array.
The trader should only mark arrays that are clearly present.
“Just because I give you the PD arrays doesn’t mean every price range is going to have every single one of them.”
This keeps the analysis clean and prevents the chart from becoming overcrowded.
Institutional Focus Points
The PD arrays provide potential institutional focus points.
These are the areas where:
- Buying may enter
- Selling may enter
- A retracement may terminate
- Price may rebalance
- Liquidity may be targeted
- A continuation move may begin
A bullish order block inside discount may provide monthly support.
A bearish order block inside premium may provide monthly resistance.
An old high or old low may act as an external liquidity objective.
The trader should combine these levels with all earlier components of the analysis.
Calibrating Key Monthly Price Levels
ICT calibrates monthly PD arrays to practical price levels.
Depending on the market, the level may be rounded to the nearest:
- Zero level
- Five level
- Ten level
When marking a premium objective above current price, ICT rounds down toward the nearest practical level.
When marking a discount level below current price, he rounds up toward the nearest practical level.
The objective is to select the low-hanging fruit rather than assuming price must trade to the exact extreme of the PD array.
This creates realistic objectives and support levels.
Rounding Premium Arrays
Suppose a premium PD array is located above current price.
Instead of rounding the level higher, ICT rounds down to the closest practical five, zero, or ten level.
This provides a more conservative upside target.
The trader is not assuming that price must touch the exact highest possible level.
Rounding Discount Arrays
When a discount PD array is located below current price, ICT rounds upward toward the nearest practical level.
This provides a more conservative level at which price may find support.
The approach recognizes that institutional buying may enter before price reaches the exact mathematical level.
Building the Monthly Directional Bias
The monthly bias is created after all major components have been reviewed.
A bullish monthly bias may include:
- A bullish seasonal tendency
- A possible bullish quarterly shift
- Supportive interest-rate conditions
- A bullish or consolidating market profile
- Bullish market structure
- Bullish SMT divergence
- Price trading inside discount
- A qualified monthly bullish PD array
- Buy-side liquidity above price
A bearish monthly bias may include:
- A bearish seasonal tendency
- A possible bearish quarterly shift
- Supportive interest-rate conditions
- A bearish or consolidating profile
- Bearish market structure
- Bearish SMT divergence
- Price trading inside premium
- A qualified monthly bearish PD array
- Sell-side liquidity below price
Not every factor must align perfectly.
However, the more factors that support the same idea, the stronger the long-term narrative becomes.
Forecasting the Next Three Months
ICT uses monthly analysis to anticipate approximately three months of price action.
The forecast may sometimes extend toward four months because quarterly shifts are not always exact.
The trader does not need to predict every monthly candle perfectly.
Even correctly anticipating a portion of the next monthly move may be sufficient to build profitable weekly or intraday trades.
“You don’t have to be right to be profitable.”
The objective is to create a probable directional framework, not an infallible forecast.
Transposing Monthly Analysis to the Weekly Chart
Once the monthly bias and key levels have been defined, they are placed on the weekly chart.
The weekly chart allows the trader to refine:
- Intermediate-term market structure
- Weekly dealing ranges
- Weekly PD arrays
- Weekly liquidity objectives
- Potential entry zones
- Continuation patterns
- Reversal conditions
The monthly chart provides the destination.
The weekly chart begins defining the route price may take to reach that destination.
Monthly levels should remain visible because they often influence several weekly candles.
How Long-Term Analysis Helps Day Traders
A trader does not need to hold positions for several months to benefit from Long Term Top Down Analysis.
An intraday trader can use the monthly bias to decide which side of the market deserves priority.
For example, under a bullish monthly framework, the trader may:
- Focus primarily on long setups
- Buy lower-timeframe retracements
- Target buy-side liquidity
- Avoid shorting bullish displacement
- Treat bearish intraday movement as potential manipulation or retracement
Under a bearish monthly framework, the trader may:
- Focus primarily on short setups
- Sell lower-timeframe rallies
- Target sell-side liquidity
- Avoid buying into bearish institutional order flow
This creates consistency between long-term expectation and short-term execution.
Long Term Top Down Analysis Example
Consider a hypothetical currency pair that is approaching a historically bullish seasonal period.
The previous three monthly candles have moved lower, suggesting that a quarterly shift may be developing.
The higher-yielding currency in the pair has a more attractive interest rate.
The monthly chart is consolidating rather than trending lower.
One correlated market makes a new extreme, but the currency pair fails to confirm it, creating bullish SMT divergence.
Price trades into a monthly bullish order block below equilibrium.
Above price is a pool of buy-side liquidity near the consolidation high.
This creates a possible bullish monthly narrative:
- Seasonal bullishness
- A potential quarterly reversal
- Supportive interest-rate differential
- Consolidation profile
- Bullish SMT divergence
- A discount market
- Monthly bullish order-block support
- Buy-side liquidity above price
The trader can then transfer this framework to the weekly and daily charts to search for qualified long entries.
The Australian Dollar Example
ICT demonstrates the process using the Australian dollar.
The analysis begins with a seasonal expectation for strength during a specific part of the year.
The previous three months had declined, creating the possibility of a quarterly shift.
At the time, Australian interest rates were higher than US interest rates, providing a supportive fundamental differential.
The monthly Australian dollar chart was consolidating.
The Dollar Index had moved above previous highs and then returned into its range, suggesting a failed breakout.
The Australian dollar also failed to make a corresponding lower low while the Dollar Index made a higher high.
This produced bullish SMT divergence.
A monthly bullish order block was identified inside the discount portion of the range.
Price traded into that order block and then expanded higher.
The monthly framework created a bullish directional bias that could be used for weekly, daily, and intraday buying opportunities.
Using Consolidation to Anticipate Expansion
A consolidation does not reveal direction by itself.
The trader must study what happened before and inside the range.
Important clues include:
- Which side of the range was raided first
- Whether the breakout was accepted or rejected
- SMT divergence between related markets
- Institutional order blocks inside the range
- Seasonal and quarterly expectations
- The location of equilibrium
- External liquidity above and below the range
If price breaks above a range, fails, and trades back through equilibrium, the range low may become a logical objective.
If price breaks below a range, fails, and returns above equilibrium, the range high may become a logical objective.
Internal and External Range Liquidity
Internal range liquidity exists within the dealing range.
Examples include:
- Fair value gaps
- Short-term highs
- Short-term lows
- Order blocks
- Equilibrium
External range liquidity exists outside the dealing range.
Examples include:
- The range high
- The range low
- Old monthly highs
- Old monthly lows
- Buy stops
- Sell stops
The monthly bias helps determine whether price is more likely to target internal liquidity first or expand toward external liquidity.
Common Mistakes in Long Term Top Down Analysis
Starting on a Lower Timeframe
Beginning with the intraday chart can cause the trader to miss the broader institutional objective.
Using Too Many Unrelated Concepts
The goal is confluence, not clutter. Every concept should support a clear market idea.
Treating Seasonal Tendencies as Guaranteed
Seasonality provides timing context but must be confirmed by price and fundamentals.
Ignoring Interest Rates
Interest rates can influence capital flows across currencies, stocks, bonds, and commodities.
Fighting a Clear Long-Term Trend
Repeatedly calling tops or bottoms can lead to unnecessary losses.
Marking Every Possible PD Array
Only obvious and relevant PD arrays should be included.
Selecting an Arbitrary Dealing Range
The range should be supported by meaningful market structure.
Ignoring Correlated Markets
Intermarket analysis may confirm or invalidate the original idea.
Expecting Exact Price Levels
Institutional buying or selling may occur before price reaches the precise level.
Repeating the Entire Process Every Day
The full monthly analysis generally needs to be completed only once per month.
Long Term Top Down Analysis Checklist
At the end of each month, review the following:
Time and Seasonality
- What month is beginning?
- Is there a relevant seasonal tendency?
- Is the market approaching a recurring seasonal high or low?
Quarterly Shift
- What has price done during the last three to four months?
- Is continuation more likely?
- Is a reversal or retracement becoming probable?
Long-Term Trend
- What has price done during the previous 9 to 18 monthly candles?
- Is the trend bullish, bearish, or unclear?
Interest Rates
- Which currency or economy has the stronger interest-rate profile?
- Are bonds supporting or opposing the equity outlook?
- Are inflationary or deflationary conditions present?
Market Profile
- Is the market consolidating?
- Is it trending?
- Is it retracing?
- Is it reversing?
Intermarket Analysis
- Are positively correlated markets confirming the idea?
- Are negatively correlated markets moving in the opposite direction?
- Is there SMT divergence?
Market Structure
- Are long-term highs or lows forming?
- Is price making higher highs and higher lows?
- Is price making lower highs and lower lows?
PD Array Matrix
- What is the relevant monthly dealing range?
- Is price in premium or discount?
- Which PD arrays are clearly visible?
Key Levels
- Which levels should be rounded to practical zero, five, or ten levels?
- Which levels may act as entries?
- Which levels may act as objectives?
Monthly Bias
- Is the final expectation bullish, bearish, or neutral?
- Which side of the market should receive priority?
- What information would invalidate the bias?
Final Thoughts
Long Term Top Down Analysis provides the foundation for the entire ICT trading process.
It begins with time and seasonality, then adds quarterly shifts, interest rates, market profiles, intermarket analysis, market structure, SMT divergence, and institutional PD arrays.
The trader uses these elements to define a monthly directional bias and identify important long-term price levels.
That information is then transferred to the weekly chart, where the analysis becomes more precise.
The process can be summarized as:
Seasonal tendency, quarterly shift, interest rates, market profile, intermarket confirmation, market structure, PD arrays, key levels, and monthly bias.
The purpose is not to predict the market with complete certainty.
The purpose is to create a structured, evidence-based expectation that keeps lower-timeframe trading aligned with institutional price delivery.
Even traders who only scalp or day trade can benefit from this approach. By understanding the monthly framework, they can avoid trading blindly against the larger market narrative and focus on setups that support the most probable long-term direction.