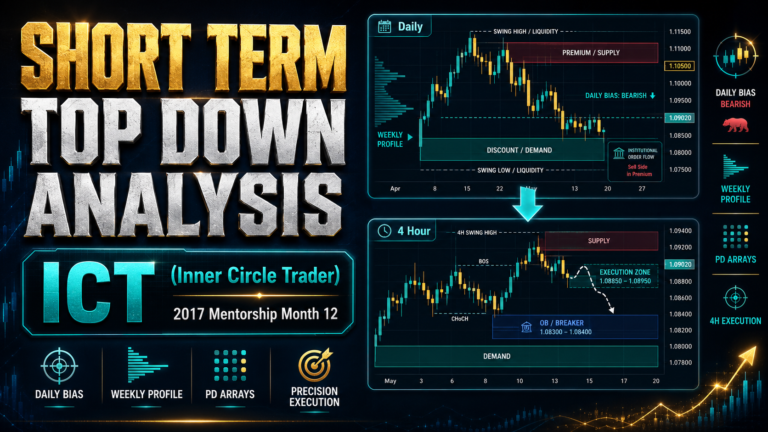
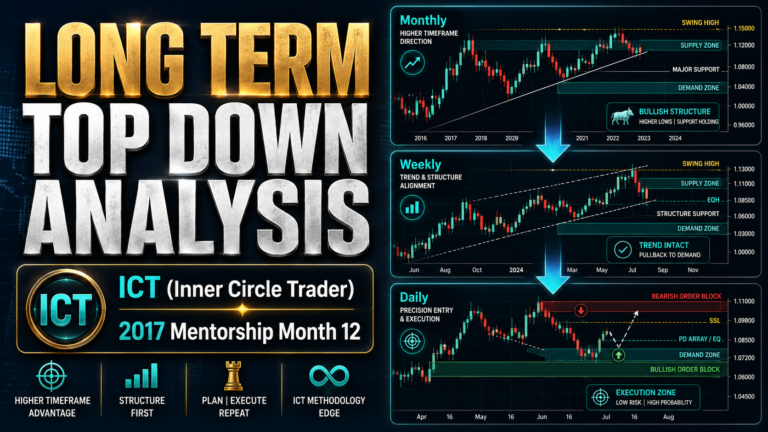
Intraday Top Down Analysis is a structured process for converting higher-timeframe directional bias into precise lower-timeframe trading opportunities.
This concept was taught by Michael J. Huddleston, the founder of ICT (Inner Circle Trader), in the 2017 ICT Private Mentorship Core Content Month 12. The framework begins with the four-hour chart and progressively refines the analysis through lower timeframes such as the 60-minute, 30-minute, 15-minute and five-minute charts.
The purpose is not to search randomly for entries on a five-minute chart. The trader first establishes the broader institutional narrative and then uses intraday tools to determine when, where and how price is likely to deliver.
Huddleston explains:
“This is how I actually employ it from a four-hour down to a five-minute timeframe.”
The four-hour chart provides the intraday higher-timeframe perspective. Lower timeframes reveal the detailed PD Arrays, liquidity pools and entry patterns needed to execute within that larger framework.
What Is Intraday Top Down Analysis?
Intraday Top Down Analysis is the final stage of the wider ICT top-down framework.
The monthly chart provides the long-term context.
The weekly chart establishes the intermediate-term perspective.
The daily chart defines the short-term directional bias.
The four-hour chart then translates that information into an actionable intraday narrative.
Lower intraday charts are used to refine:
- Entry location
- Liquidity
- Fair value gaps
- Order blocks
- Breakers
- Intraday timing
- Daily range projections
- Profit objectives
The trader therefore does not treat the four-hour or five-minute chart as an isolated market.
All monthly, weekly and daily analysis must already be included when the four-hour chart is studied.
The Main Purpose of the Four-Hour Chart
The four-hour chart acts as the higher timeframe for intraday trading.
Its primary functions are to:
- Establish the intraday directional bias
- Define important four-hour PD Arrays
- Identify institutional order flow
- Determine whether price is in premium or discount
- Locate likely continuation or reversal areas
- Provide the context for London and New York setups
- Establish where lower-timeframe analysis should begin
A trader who immediately opens a five-minute chart without this context may see many apparent setups but have no reliable method for determining which ones align with institutional price delivery.
The four-hour chart helps answer the most important question:
Should the trader primarily look for longs or shorts?
Intraday Top Down Analysis Process
The complete process includes the following elements:
- Higher-timeframe monthly, weekly and daily bias
- Day-of-the-week expectations
- ICT True Day
- Time-of-day Kill Zones
- Central Bank Dealers Range
- Asian Range
- FLOUT standard deviations
- Intraday profiles
- Four-hour and intraday PD Arrays
- Average Daily Range projections
- Lower-timeframe refinement
- Entry-pattern selection
- Targeting and trade management
Each part contributes to the complete intraday narrative.
Start With the Higher-Timeframe Bias
Before performing intraday analysis, the trader should already understand the monthly, weekly and daily conditions.
The four-hour chart inherits this information.
If the higher-timeframe bias is bullish, the trader should primarily search for:
- Long setups
- Discount entries
- Sell-side liquidity raids
- Bullish order blocks
- Bullish fair value gaps
- Bullish breakers
- Upside range expansion
If the higher-timeframe bias is bearish, the trader should primarily search for:
- Short setups
- Premium entries
- Buy-side liquidity raids
- Bearish order blocks
- Bearish fair value gaps
- Bearish breakers
- Downside range expansion
The lower timeframe should refine the higher-timeframe idea, not replace it.
Day-of-the-Week Analysis
The first intraday consideration is the current day of the week.
The trader should ask:
- Is it Monday, Tuesday or Wednesday?
- Has the expected weekly move already begun?
- Is the market still building the weekly range?
- Has a late-week setup become more likely?
- Does the economic calendar support the expected weekly profile?
Huddleston generally looks for higher-timeframe-aligned opportunities during Monday, Tuesday and Wednesday.
When the higher-timeframe bias is bullish, he looks for long opportunities during these days.
When the higher-timeframe bias is bearish, he looks for short opportunities.
If the anticipated move does not form during the first half of the week, the trader can begin studying Thursday and Friday templates.
Why Monday, Tuesday and Wednesday Matter
The first three trading days frequently play an important role in forming the weekly range.
Monday may create:
- An initial consolidation
- A false move
- Part of the weekly low
- Part of the weekly high
- A reference range for Tuesday or Wednesday
Tuesday and Wednesday frequently provide more meaningful expansion.
This is particularly important for traders following One Shot One Kill concepts or weekly profiles.
The trader should not assume that every Monday must produce the weekly opportunity.
Instead, Monday’s price action may provide information about what Tuesday and Wednesday are likely to deliver.
Late-Week Scenarios
If the anticipated direction does not appear during Monday, Tuesday or Wednesday, the trader should not continue forcing the original expectation.
Thursday and Friday may then produce:
- A delayed weekly expansion
- A weekly reversal
- A continuation after consolidation
- A retracement into a higher-timeframe PD Array
- A reaction to important economic data
The economic calendar becomes especially important when the expected move has not yet developed.
A significant Thursday or Friday release may provide the liquidity and volatility required to complete the weekly profile.
ICT True Day
Intraday setups should be studied within the hours of the ICT True Day.
The True Day provides the time-based framework within which the majority of meaningful daily price delivery is expected to occur.
Huddleston emphasizes that the bulk of daily volume is generally delivered between:
- 03:00 New York time
- 10:00 New York time
The trader should aim to position:
- Before this window
- During the first half of this window
- Around the London or New York Kill Zone
After the New York open has passed, expectations should generally be reduced.
Later setups may still occur, but the remaining daily objective may be smaller.
The Importance of Time of Day
A technically valid setup is not automatically a high-probability intraday trade.
Time matters.
A fair value gap forming during an inactive period may not have the same significance as one forming during a Kill Zone.
ICT intraday analysis combines price and time.
The trader considers:
- Where price is trading
- Which liquidity has been taken
- Which PD Array is being reached
- Which session is active
- Whether the daily range is expanding
- Whether the expected high or low of the day has formed
This prevents the trader from treating every lower-timeframe pattern equally.
ICT Kill Zones
The main trading windows considered in Intraday Top Down Analysis include:
- Asian session
- London Open Kill Zone
- New York Open Kill Zone
- London Close
- Central Bank Dealers Range
Each period has a different function within the daily price-delivery process.
The London session frequently creates or manipulates the initial daily range.
The New York session may continue the London move or reverse it after price reaches a four-hour PD Array.
London Close commonly becomes a profit-taking period.
London Open Kill Zone
The London Open Kill Zone is an important entry window.
When the higher-timeframe bias is bullish, ICT looks for the low of the day to form during London.
When the higher-timeframe bias is bearish, ICT looks for the high of the day to form during London.
This may occur through:
- A raid below the Asian Range
- A raid above the Asian Range
- A retracement into a lower-timeframe PD Array
- A Central Bank Dealers Range deviation
- A fair value gap
- A liquidity sweep
- A Turtle Soup setup
If the London entry fails or does not form, the trader can look for another opportunity during New York.
New York Open Kill Zone
The New York Open Kill Zone may provide:
- Continuation of the London move
- Repositioning after a missed London entry
- A retracement into the Asian Range boundary
- A reversal after reaching a four-hour PD Array
- A news-driven liquidity sweep
- A fresh lower-timeframe entry pattern
Whether New York is expected to continue or reverse depends heavily on the four-hour chart.
If price has not yet reached its higher-timeframe objective, New York may continue in the same direction as London.
If price reaches a four-hour premium or discount array during New York, a reversal becomes more likely.
London Close
Huddleston generally begins reducing or closing intraday positions between:
- 10:00 New York time
- 11:00 New York time
This period is associated with:
- Profit-taking
- The beginning of London Close
- Completion of the main daily range
- Reduced continuation potential
The trader should not insist on holding for the exact high or low.
The objective is to capture the meaningful part of the daily range, not every final pip.
Choosing the Lower Timeframe
After establishing the four-hour bias, the trader must select the lower timeframe that reveals the clearest price delivery.
Possible choices include:
- 60-minute chart
- 30-minute chart
- 15-minute chart
- Five-minute chart
- One-minute chart
Huddleston personally prefers moving from the four-hour chart to the 30-minute or 15-minute chart.
The five-minute chart can then be used for final entry refinement.
However, the selected timeframe should depend on market clarity.
The trader should not force one fixed timeframe onto every setup.
Why Lower Timeframes Are Flexible
A fair value gap may not be visible on the 60-minute chart but may appear clearly on the 15-minute or five-minute chart.
Higher timeframes smooth price delivery.
Lower timeframes reveal:
- Smaller inefficiencies
- Detailed fair value gaps
- Short-term order blocks
- Liquidity raids
- Breakers
- More precise institutional entry points
The purpose of moving lower is not simply to see more candles.
The purpose is to find the timeframe that presents the clearest institutional PD Array.
Huddleston states:
“What we’re doing is looking for a timeframe that produces fair value gaps.”
The Central Bank Dealers Range
The Central Bank Dealers Range is an important component of ICT intraday analysis.
The trader measures the range and projects standard deviations above and below it.
These deviations are then compared with lower-timeframe premium or discount arrays.
When the higher-timeframe bias is bullish, the trader looks for long opportunities around:
- Negative one standard deviation
- Negative two standard deviations
- Negative three standard deviations
However, the deviation should overlap with a discount PD Array.
When the higher-timeframe bias is bearish, the trader looks for short opportunities around:
- Positive one standard deviation
- Positive two standard deviations
- Positive three standard deviations
The preferred level should overlap with a premium PD Array.
Do Not Trade Deviations Alone
A standard deviation is not an automatic entry.
For a bullish trade, the trader wants the deviation to overlap with a 15- to 60-minute discount array.
Examples include:
- Bullish fair value gap
- Bullish order block
- Previous low
- Breaker block
- Sell-side liquidity
- Discount portion of a dealing range
For a bearish trade, the deviation should overlap with:
- Bearish fair value gap
- Bearish order block
- Previous high
- Breaker block
- Buy-side liquidity
- Premium portion of a dealing range
The power comes from blending time, deviation and PD Array location.
The Asian Range
The Asian Range provides another important intraday reference.
If the higher-timeframe bias is bullish, the ideal long entry forms below the Asian Range low.
However, long opportunities may still be considered while price remains below the Asian Range high.
If the higher-timeframe bias is bearish, the ideal short entry forms above the Asian Range high.
Short opportunities may still be considered while price remains above the Asian Range low.
The strongest setup often involves a liquidity raid outside the Asian Range followed by expansion in the higher-timeframe direction.
Bullish Asian Range Model
In a bullish environment, the preferred sequence is:
- Asian Range forms.
- London trades below the Asian Range low.
- Sell-side liquidity is taken.
- Price reaches a discount PD Array.
- Bullish institutional order flow appears.
- Price re-enters the Asian Range.
- Asian Range high becomes an objective.
- Price expands toward New York or another upside target.
The raid below the Asian Range low provides liquidity for institutional buying.
Bearish Asian Range Model
In a bearish environment, the preferred sequence is:
- Asian Range forms.
- London trades above the Asian Range high.
- Buy-side liquidity is taken.
- Price reaches a premium PD Array.
- Bearish institutional order flow appears.
- Price re-enters the Asian Range.
- Asian Range low becomes an objective.
- Price expands lower toward New York or another downside target.
This is the bearish version of the same liquidity model.
Retesting the Asian Range Boundary
After price moves away from the Asian Range, the boundary may later be retested.
In a bullish environment, the Asian Range high may be retested as support.
This retest may provide:
- A new long entry
- An opportunity to add to an existing position
- A continuation setup during New York
In a bearish environment, the Asian Range low may be retested as resistance.
This may provide:
- A fresh short entry
- A pyramiding opportunity
- A continuation trade
The Asian Range is therefore useful for both initial entries and secondary positioning.
Daily Range Projections Using the Asian Range
Standard deviations can also be projected from the Asian Range.
The trader compares these levels with:
- Central Bank Dealers Range deviations
- FLOUT deviations
- Average Daily Range projections
- 15- to 60-minute PD Arrays
When several levels converge near the same price, the market may be approaching the high or low of the day.
This convergence is more meaningful than any single projection alone.
What Is FLOUT?
In this ICT framework, FLOUT combines the Central Bank Dealers Range and the Asian Range into one total range.
The process is:
- Identify the beginning of the Central Bank Dealers Range.
- Continue through the end of the Asian Range.
- Mark the highest high during that total period.
- Mark the lowest low.
- Measure the complete range.
- Divide that range in half.
- Use half of the range as one FLOUT standard deviation.
- Project additional deviations above and below the midpoint.
For example, if the complete range is 40 pips, one FLOUT standard deviation equals 20 pips.
Using FLOUT in Bullish Conditions
When the higher-timeframe bias is bullish, the trader looks for:
- Negative FLOUT deviations
- Central Bank Dealers Range deviations
- Asian Range deviations
- Lower-timeframe discount arrays
The ideal setup occurs when these references converge.
A FLOUT deviation alone is not sufficient.
It should overlap with a meaningful 15- to 60-minute discount PD Array.
Using FLOUT in Bearish Conditions
When the higher-timeframe bias is bearish, the trader looks for:
- Positive FLOUT deviations
- Central Bank Dealers Range deviations
- Asian Range deviations
- Lower-timeframe premium arrays
The strongest short opportunity forms when these references overlap with a premium PD Array.
FLOUT can produce more standard deviations than the Asian Range or Central Bank Dealers Range.
As the daily range expands, additional FLOUT levels may need to be projected.
Identifying the Daily High or Low
The daily high or low frequently forms near a convergence of:
- FLOUT standard deviation
- Asian Range standard deviation
- Central Bank Dealers Range standard deviation
- Average Daily Range projection
- 15- or 60-minute PD Array
- London or New York timing
- Four-hour premium or discount
This is why ICT does not rely on one isolated measurement.
The trader blends several tools to estimate where price may complete the daily range.
Even then, the projection is not guaranteed.
It is an informed estimate.
Intraday Profiles
Intraday profiles help the trader anticipate how the daily range may form.
Examples include:
- London creates the high before a bearish day
- London creates the low before a bullish day
- London consolidates and New York expands
- London expands and New York continues
- London expands into a four-hour PD Array and New York reverses
- Asian liquidity is raided before directional expansion
The profile must agree with the higher-timeframe bias.
Bullish Intraday Profile
When the higher-timeframe bias is bullish, ICT generally looks for:
- A low of the day during London
- A sell-side liquidity raid
- A discount PD Array
- Bullish displacement
- New York continuation higher
If the four-hour chart has not yet reached a premium objective, the New York session may continue the bullish movement.
Bearish Intraday Profile
When the higher-timeframe bias is bearish, ICT generally looks for:
- A high of the day during London
- A buy-side liquidity raid
- A premium PD Array
- Bearish displacement
- New York continuation lower
If the four-hour chart has not yet reached a discount objective, the New York session may continue lower.
New York Reversal Conditions
A New York reversal becomes more likely when price reaches a four-hour PD Array.
For example, if the market has rallied during London and reaches a four-hour premium array during New York, the session may reverse lower.
If the market has declined during London and reaches a four-hour discount array during New York, the session may reverse higher.
The four-hour location is therefore critical.
Huddleston explains that if the higher-timeframe objective has not been reached, New York is more likely to continue the existing move.
Internal and External Range Liquidity
ICT intraday setups can be divided into two broad categories:
- Internal range liquidity
- External range liquidity
Internal range liquidity exists within a defined dealing range.
Examples include:
- Fair value gaps
- Short-term highs and lows
- Order blocks
- Inefficient price delivery
- Optimal Trade Entry levels
External range liquidity exists outside the range.
Examples include:
- Old highs
- Old lows
- Equal highs
- Equal lows
- Buy stops
- Sell stops
Huddleston’s main entry patterns are built around these two liquidity concepts.
The PD Array Matrix
The PD Array Matrix is essential to Intraday Top Down Analysis.
The trader must identify the sequence of premium and discount arrays above and below current price.
Possible premium arrays include:
- Bearish order blocks
- Bearish fair value gaps
- Breakers
- Mitigation blocks
- Old highs
- Buy-side liquidity
- Rejection blocks
Possible discount arrays include:
- Bullish order blocks
- Bullish fair value gaps
- Breakers
- Mitigation blocks
- Old lows
- Sell-side liquidity
- Rejection blocks
Without understanding the PD Array Matrix, the trader cannot determine which liquidity sweep or standard deviation is most important.
Calibrating Key Levels
After identifying the relevant PD Arrays, the trader calibrates important levels to the nearest 5 or 10 increment.
This creates practical reference points for:
- Entry
- Stop placement
- Targets
- Daily range projections
- Session highs and lows
The levels should be treated as zones rather than perfect prices.
Forex pricing can vary among brokers, and spreads may widen around liquidity pools.
Average Daily Range
ICT uses a five-day Average Daily Range to estimate possible intraday extremes.
When the higher-timeframe bias is bullish, the trader initially looks for price to reach the Average Daily Range high.
When the higher-timeframe bias is bearish, the trader initially looks for price to reach the Average Daily Range low.
The Average Daily Range is a projection tool, not a guaranteed reversal point.
When Average Daily Range Is Exceeded
If price trades beyond the Average Daily Range high or low, ICT uses Fibonacci extensions.
The primary extensions are:
- 127%
- 162%
In a bullish environment, these extensions should overlap with a premium PD Array.
In a bearish environment, they should overlap with a discount PD Array.
The extension has little value by itself.
The strongest objective forms when it converges with:
- Asian Range deviation
- Central Bank Dealers Range deviation
- FLOUT deviation
- 15- or 60-minute PD Array
Why ICT Exits Before the Exact Objective
The projected high or low is not absolute.
Standard deviations and range projections assist the trader, but they do not guarantee an exact turning point.
Huddleston prefers taking profits before the final projected level.
He explains:
“You can’t go wrong with taking profits.”
Trying to capture the exact daily high or low can result in:
- Missed exits
- Reversed profits
- Emotional frustration
- Unnecessary risk
- Overmanagement
The objective is consistency, not perfection.
The Main ICT Intraday Patterns
Huddleston reduces his execution framework to two central patterns:
- Internal range liquidity entry
- External range liquidity entry
These appear in bullish and bearish forms.
A breaker provides a contingency entry when the initial external liquidity setup is missed.
Although many ICT tools exist, the trader does not need to trade every pattern.
Huddleston states:
“As a technical trader, we only need one setup or one pattern to trade on.”
ICT Bullish Pattern One: Internal Range Liquidity
The first bullish pattern requires a bullish higher-timeframe condition.
The sequence is:
- Price reacts from a higher-timeframe discount array.
- A bullish impulse swing forms.
- The impulse creates a fair value gap near the swing low.
- A short-term low forms during the retracement.
- Price fails to continue higher immediately.
- Price drops below the short-term low.
- Sell stops are triggered.
- Price trades into the fair value gap.
- The retracement overlaps with an Optimal Trade Entry.
- Smart money accumulates long positions.
- Price expands toward external range liquidity.
This is an internal range liquidity setup because the entry forms within the impulse range.
Four Bullish Confluences
The highest-quality bullish version may combine:
- Fair value gap
- Short-term low and sell stops
- Bullish order block
- Optimal Trade Entry retracement
When these overlap with bullish higher-timeframe conditions, the setup becomes considerably stronger.
However, it is never guaranteed.
The trader should still manage risk and wait for the complete pattern.
ICT Bullish Pattern Two: Turtle Soup
The second bullish pattern is based on external range liquidity.
The sequence is:
- A higher-timeframe discount array is identified.
- Price initially stops above the discount array.
- A short-term low forms.
- Early buyers enter and place stops below the low.
- Price later trades below the low.
- Sell stops are triggered.
- Price reaches the anticipated discount array.
- Smart money uses the sell-side liquidity to accumulate.
- Price reverses higher.
This is the ICT version of a bullish Turtle Soup setup.
The trader does not buy the first short-term low simply because price appears cheap.
The preferred entry comes after the early low is raided and the deeper discount array is reached.
Patience in the Bullish Turtle Soup
This setup demonstrates the importance of waiting.
If price stops just above the intended discount level and begins to rally, the trader should not automatically chase it.
The temporary low may be designed to attract early buyers.
Their stop-loss orders create sell-side liquidity below the low.
A later raid into the true discount PD Array provides a stronger institutional entry.
Knowing the desired price location allows the trader to remain patient.
ICT Bullish Pattern Three: Bullish Breaker
If the bullish Turtle Soup entry is missed, the trader can use a bullish breaker.
The sequence is:
- Price raids sell-side liquidity.
- Price reaches the discount array.
- Price rallies through a short-term high.
- The violated high becomes part of the bullish breaker structure.
- Price retraces into the breaker.
- The trader enters long or adds to an existing position.
- Price expands toward premium.
The breaker provides a contingency plan.
The trader does not need to chase price after missing the original liquidity raid.
ICT Bearish Pattern One: Internal Range Liquidity
The first bearish pattern is the reverse of the bullish internal range setup.
The sequence is:
- Price reacts from a higher-timeframe premium array.
- A bearish impulse swing forms.
- A fair value gap appears near the swing high.
- A short-term high forms.
- Price fails to continue lower immediately.
- Price rallies above the short-term high.
- Buy stops are triggered.
- Price fills the fair value gap.
- The move overlaps with a bearish order block and Optimal Trade Entry.
- Smart money distributes short positions.
- Price expands toward external sell-side liquidity.
This is one of Huddleston’s preferred bearish patterns.
ICT Bearish Pattern Two: Turtle Soup
The bearish Turtle Soup setup forms around external range liquidity.
The sequence is:
- A higher-timeframe premium array is identified.
- Price initially stops below the premium array.
- A short-term high forms.
- Early sellers enter and place stops above the high.
- Price later trades above that high.
- Buy stops are triggered.
- Price reaches the anticipated premium array.
- Smart money sells into the buy-side liquidity.
- Price reverses lower.
The trader waits for the liquidity raid rather than chasing the first decline.
ICT Bearish Pattern Three: Bearish Breaker
If the bearish Turtle Soup entry is missed, the trader can use the bearish breaker.
The sequence is:
- Price raids buy-side liquidity.
- Price reaches a premium array.
- Price trades lower through a short-term low.
- The violated structure creates a bearish breaker.
- Price retraces into the breaker.
- The trader enters short or adds to an existing position.
- Price expands toward discount.
The bearish breaker allows the trader to participate without expecting price to return to the original high.
Only Trade Clear Patterns
Huddleston emphasizes that he does not trade when the pattern is unclear.
He states:
“If I don’t see price doing these three things, I don’t do anything.”
This principle is essential.
A trader should not force:
- A vague fair value gap
- An incomplete liquidity raid
- A random breaker
- A weak order block
- A setup without higher-timeframe alignment
The pattern should be clear enough that entry, invalidation and objective can all be defined.
Why One Pattern Is Enough
Constantly switching among strategies makes it difficult to measure consistency.
A trader using one setup can evaluate:
- Win rate
- Average reward
- Common errors
- Best trading session
- Best market conditions
- Stop placement
- Psychological response
Confidence develops through repetition.
The trader does not need to trade every available ICT concept.
One well-understood pattern can provide enough opportunities.
The Role of Demo Trading
ICT recommends learning the framework in a demo environment.
Demo trading allows the trader to:
- Make mistakes without financial damage
- Test one pattern repeatedly
- Study execution
- Build confidence
- Understand loss
- Record screenshots
- Review session behavior
- Refine a personal model
Losses and mistakes are part of learning.
The trader should not expect immediate perfection.
Gold Intraday Top Down Analysis Example
The gold-market example demonstrates how the framework can be applied.
The four-hour chart established a bullish condition.
However, price was already trading above the preferred discount area.
The trader therefore needed to wait for a retracement.
Identifying the Gold Discount Array
On the lower timeframe, a fair value gap existed below current price.
Additional discount arrays were located beneath it.
The plan was to buy if price traded into the fair value gap and ran sell-side liquidity below an old low.
The setup included:
- Bullish higher-timeframe bias
- Fair value gap
- External sell-side liquidity
- Internal range discount
- Optimal Trade Entry
- Defined protective stop
The entry was planned before price reached the level.
Gold Optimal Trade Entry
The impulse range was measured from the low to the subsequent high.
The retracement zone included:
- 62% level
- 70.5% level
- 79% level
The fair value gap overlapped with this Optimal Trade Entry zone.
This created a refined discount area.
The protective stop was placed below the next meaningful discount array.
Gold Turtle Soup Entry
Price initially stopped above the intended entry zone and rallied.
The trader did not chase the rally.
Price later returned lower, raided sell stops and traded into the anticipated fair value gap.
The bullish entry was then activated near the planned discount area.
Price rallied away without reaching the protective stop.
This was a clear example of the bullish Turtle Soup and internal range liquidity concepts working together.
Gold Bullish Breaker Contingency
Traders who missed the original liquidity-raid entry could wait for a bullish breaker.
After price rallied through a short-term high, the relevant structure could be extended forward.
A later retracement into the breaker offered another potential buying opportunity.
This demonstrates why a missed first entry does not require emotional chasing.
The model provides a secondary plan.
Broker Pricing and Spread Considerations
Intraday traders must also account for differences between interbank pricing and broker quotes.
Retail brokers may add spreads to the underlying market price.
Spreads can widen around:
- Old highs
- Old lows
- News events
- Session opens
- Liquidity pools
This creates additional risk for tightly placed stops.
The trader should avoid assuming that a level will be respected to the exact pip across every broker.
Reasonable tolerance should be included in entry and stop planning.
Risk Management in Intraday Top Down Analysis
A strong analytical framework does not remove the need for risk control.
Important principles include:
- Risk a small percentage per trade.
- Define invalidation before entry.
- Do not chase missed setups.
- Avoid entering without higher-timeframe alignment.
- Account for spread and volatility.
- Reduce expectations after the main daily move.
- Take profits before projected extremes.
- Do not force a setup on inactive days.
- Accept that some trades will fail.
- Use demo trading until execution becomes consistent.
A high-probability setup can still lose.
The trader’s task is not to eliminate losses but to control them.
Common Intraday Top Down Analysis Mistakes
Starting With the Five-Minute Chart
The five-minute chart cannot provide the full higher-timeframe narrative.
The four-hour, daily, weekly and monthly charts should already support the setup.
Ignoring the Day of the Week
The same intraday pattern may behave differently on Monday compared with Thursday.
Weekly timing and the economic calendar matter.
Trading Outside the True Day
A technically attractive setup may have limited potential if it forms after the main daily volume has already been delivered.
Using Standard Deviations Alone
Central Bank Dealers Range, Asian Range and FLOUT deviations must overlap with PD Arrays.
Treating the Asian Range as a Signal
The Asian Range is a reference framework.
The trader still needs higher-timeframe bias and institutional confirmation.
Expecting Every New York Session to Reverse
New York may continue London when the four-hour objective has not been reached.
Reversal becomes more likely when price reaches a four-hour premium or discount array.
Chasing a Missed Turtle Soup
A breaker can provide a secondary entry.
The trader should not enter emotionally after the first move has already occurred.
Trading Too Many Patterns
Constantly changing setups prevents the development of consistency.
Trying to Capture the Exact Daily High or Low
Projection tools are approximate.
Taking profits while price is moving toward the target is often more practical.
Intraday Top Down Analysis Checklist
Before entering an intraday trade, ask:
- What is the monthly directional bias?
- What is the weekly directional bias?
- What is the daily directional bias?
- What does the four-hour chart suggest?
- Is price in four-hour premium or discount?
- What day of the week is it?
- Has the weekly move already formed?
- Are important economic releases scheduled?
- Is the setup forming within the ICT True Day?
- Which Kill Zone is active?
- What is the Central Bank Dealers Range?
- What is the Asian Range?
- What are the relevant FLOUT deviations?
- Which deviations overlap with PD Arrays?
- What intraday profile is expected?
- Is London likely to create the high or low?
- Should New York continue or reverse?
- What are the 15- to 60-minute premium arrays?
- What are the 15- to 60-minute discount arrays?
- Where is internal range liquidity?
- Where is external range liquidity?
- Is there a fair value gap?
- Is there an order block?
- Is there a breaker?
- Has buy-side or sell-side liquidity been raided?
- What is the Average Daily Range objective?
- Do the 127% or 162% extensions overlap with a PD Array?
- Where is the protective stop?
- Where will profit be taken?
- Is the pattern clear enough to trade?
If these questions cannot be answered, the setup may not be ready.
Simplified Four-Hour-to-Five-Minute Model
The complete process can be simplified into five stages.
Stage 1: Establish Direction
Use the monthly, weekly, daily and four-hour charts to determine whether longs or shorts should be favored.
Stage 2: Establish Time
Determine:
- Day of the week
- True Day
- London or New York Kill Zone
- Economic-calendar influence
Stage 3: Establish Location
Identify:
- Four-hour premium or discount
- Central Bank Dealers Range deviations
- Asian Range deviations
- FLOUT deviations
- Lower-timeframe PD Arrays
Stage 4: Wait for Liquidity and Pattern
Look for:
- Internal range liquidity setup
- External range liquidity raid
- Turtle Soup
- Optimal Trade Entry
- Fair value gap
- Order block
- Breaker
Stage 5: Project and Manage the Trade
Use:
- Average Daily Range
- Fibonacci extensions
- Standard-deviation confluence
- External liquidity
- Higher-timeframe PD Arrays
Exit before the exact projected extreme rather than demanding a perfect high or low.
Final Thoughts
Intraday Top Down Analysis provides a complete bridge between higher-timeframe institutional context and lower-timeframe execution.
The trader begins with the monthly, weekly and daily narrative, then uses the four-hour chart to establish the intraday direction.
Day-of-the-week expectations, ICT True Day, Kill Zones, the Central Bank Dealers Range, Asian Range, FLOUT, intraday profiles and Average Daily Range projections are then combined with lower-timeframe PD Arrays.
The final execution is usually based on one of two ideas:
- Internal range liquidity returning to fair value
- External range liquidity being raided and reversed
If the first liquidity entry is missed, a breaker may provide a secondary opportunity.
The essential principle is straightforward:
Establish direction on the higher timeframe, wait for the correct time and location, then execute only when a clear liquidity pattern appears.
As Michael J. Huddleston explains:
“Once you understand where the market is going and you understand the setup, the entry stuff is easy.”
Intraday Top Down Analysis is not about predicting every candle. It is about aligning higher-timeframe bias, institutional price levels, liquidity and time so that lower-timeframe trades are taken within a complete market narrative.