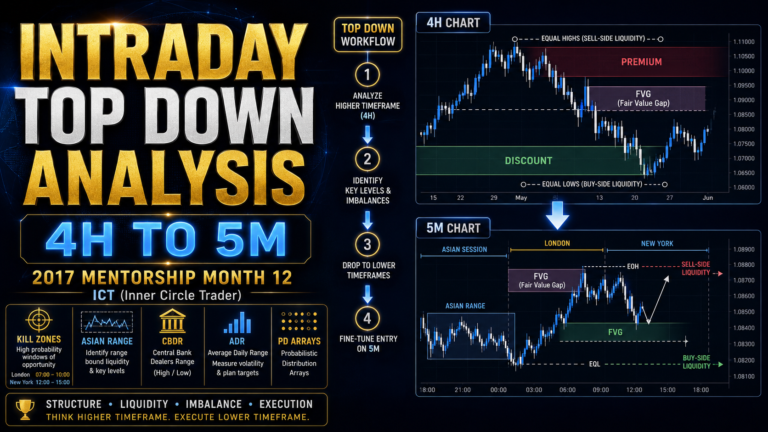
Short Term Top Down Analysis is a structured method of moving from the daily chart to the four-hour chart after the higher-timeframe monthly and weekly biases have already been established. It helps traders refine institutional order flow, identify relevant premium and discount arrays, anticipate the weekly profile, and determine where short-term trading opportunities may develop.
Michael J. Huddleston, the founder of ICT (Inner Circle Trader) concepts, teaches this framework in the 2017 ICT Private Mentorship Core Content Month 12. His approach does not begin with random lower-timeframe entries. It begins with a long-term condition, moves into a recognizable setup environment, and only then looks for execution.
“I’m looking for a condition or bias long term, I’m looking for a stage or a setup, and then I go into a lower time frame and execute.”
The purpose of Short Term Top Down Analysis is not to find a trade every day. It is to identify the specific conditions where time, price, institutional sponsorship, and liquidity align.
What Is Short Term Top Down Analysis?
Short Term Top Down Analysis is the process of analyzing the daily chart and transferring the conclusions to the four-hour chart.
The monthly chart provides the long-term directional framework.
The weekly chart refines that framework into an intermediate-term expectation.
The daily chart then reveals whether institutional order flow supports the higher-timeframe idea.
Finally, the four-hour chart provides more precise price levels and trade-development conditions.
The sequence is:
Monthly bias, weekly bias, daily confirmation, four-hour refinement.
The daily and four-hour charts should not be studied in isolation. All relevant monthly and weekly levels must be carried forward.
The Purpose of the Daily-to-4-Hour Process
The process is designed to help traders determine:
- What institutional traders may be doing
- Whether the daily chart confirms the monthly and weekly bias
- Which weekly profile may unfold
- Where SMT divergence is developing
- Which daily PD arrays are important
- Where four-hour entries or objectives may form
- Whether the trader should be bullish, bearish, or neutral
The result is a daily directional bias.
That bias does not mean buying every day in a bullish market or selling every day in a bearish market.
A valid trade still requires price to reach the correct level at the correct time.
Why Selectivity Matters
ICT emphasizes that traders should not expect high-quality opportunities every trading day.
Retail traders often feel pressured to remain active, but institutional traders wait for specific conditions, levels, and liquidity events.
A trader should be selective because:
- Not every day provides a qualified setup
- Price may not reach a meaningful PD array
- The economic calendar may not support expansion
- Daily order flow may conflict with lower-timeframe movement
- The weekly profile may still be unclear
- The market may remain in consolidation
“Smart money doesn’t do that. They’re waiting for specific setups, conditions, and levels that they already determined.”
The objective is to wait for the market to enter a favorable stage rather than forcing a trade.
Begin With the Higher-Timeframe Bias
Before beginning Short Term Top Down Analysis, the trader should already have completed the monthly and weekly analysis.
The daily chart should ideally confirm the higher-timeframe expectation.
If the monthly and weekly charts are bullish, the trader should search for bullish daily institutional order flow and discount arrays.
If the monthly and weekly charts are bearish, the trader should search for bearish daily institutional order flow and premium arrays.
The higher-timeframe analysis gives context to what may otherwise appear confusing on the four-hour or one-hour chart.
Without that context, lower-timeframe bullishness may simply be a retracement inside a bearish daily structure.
The ICT Short Term Top Down Analysis Process
The complete daily-to-four-hour process includes:
- Commercial hedging analysis
- Open-interest analysis
- Daily institutional order flow
- Weekly profile expectations
- Economic-calendar analysis
- Intermarket relationships
- SMT divergence
- Daily market structure
- Breakers and mitigation blocks
- PD Array Matrix
- Calibrated price levels
- Daily directional bias
- Four-hour chart refinement
Each element helps determine whether the market is ready to produce a meaningful price expansion.
Commercial Hedging Analysis
The first element is commercial hedging through Commitment of Traders data.
ICT focuses on commercial hedgers rather than large speculators.
The purpose is to understand whether commercial participants are positioned in a relatively bullish or bearish manner.
The process involves:
- Reviewing approximately twelve months of commercial net positions
- Identifying the highest net-position reading
- Identifying the lowest net-position reading
- Dividing that range in half
- Treating readings above the midpoint as relatively bullish
- Treating readings below the midpoint as relatively bearish
ICT effectively creates a dynamic midpoint instead of relying only on the traditional zero line.
Using a 12-Month COT Range
The preferred lookback period is twelve months.
This gives a rolling view of commercial hedging behavior based on current market conditions.
If the twelve-month range is too narrow or unclear, the trader may reduce the lookback to approximately six months.
A six-month range may reveal a clearer quarterly shift in commercial positioning.
The trader should use COT data as supporting context rather than a standalone entry signal.
Interpreting Commercial Positioning
If commercial positioning is above the midpoint of its recent range, ICT considers it relatively bullish.
This may support a search for:
- Higher-timeframe discount arrays
- Bullish daily order flow
- Buy-side objectives
- Long opportunities
If positioning is below the midpoint, it is interpreted as relatively bearish.
This may support:
- Higher-timeframe premium arrays
- Bearish daily order flow
- Sell-side objectives
- Short opportunities
Commercial positioning should agree with the monthly and weekly analysis whenever possible.
Open Interest in Short Term Top Down Analysis
Open interest becomes more important when the analysis reaches the daily chart.
ICT does not place as much emphasis on it during the earliest monthly analysis stage.
On the daily chart, open interest can help confirm or reject the developing trade idea.
Open interest represents the number of outstanding futures contracts that remain open.
A substantial change can reveal whether positions are entering or leaving the market.
Bullish Open-Interest Condition
ICT looks for open interest to decline by approximately 15 percent or more when price is trading at a higher-timeframe discount array.
This condition may be especially bullish when:
- Monthly bias is bullish
- Weekly bias is bullish
- Price is at a discount array
- Daily structure is supportive
- Institutional order flow is bullish
The reduction may indicate that bearish positions are being closed while price is reaching an area of institutional interest.
Bearish Open-Interest Condition
ICT looks for open interest to increase by approximately 15 percent or more when price is trading at a higher-timeframe premium array.
This may be especially bearish when:
- Monthly bias is bearish
- Weekly bias is bearish
- Price is at a premium array
- Daily structure is bearish
- Institutional order flow supports lower prices
If neither bullish nor bearish open-interest condition is present, ICT may exclude open interest from the analysis.
It is not necessary to force an interpretation when the data provides no meaningful confirmation.
Daily Institutional Order Flow
Daily institutional order flow is one of the most important parts of Short Term Top Down Analysis.
It reveals whether price is being supported or resisted by institutional activity.
When the monthly or weekly bias is bullish, ICT wants to see:
- Support at down-close daily candles
- Bullish order blocks holding
- Up-close candles being broken
- Higher lows
- Bullish displacement
- Price expanding away from discount arrays
When the monthly or weekly bias is bearish, ICT wants to see:
- Resistance at up-close daily candles
- Bearish order blocks holding
- Down-close candles being broken
- Lower highs
- Bearish displacement
- Price expanding away from premium arrays
Why the Daily Chart Is Essential
The daily chart is the minimum higher timeframe a trader should study before attempting lower-timeframe analysis.
A four-hour or one-hour chart may appear bullish, but the move may only be a retracement into a daily bearish order block.
Similarly, a short-term decline may look bearish while price is actually retracing into daily institutional support.
“If you don’t know what the daily chart is implying in terms of institutional bullish or bearish order flow, you’re playing Russian roulette.”
The daily chart helps determine which lower-timeframe movements deserve trust.
Daily and Higher-Timeframe Agreement
The ideal condition occurs when:
- Monthly bias agrees with the weekly bias
- Weekly bias agrees with the daily order flow
- Daily order flow agrees with the four-hour setup
This creates multi-timeframe alignment.
If the monthly and weekly charts disagree, the daily chart may reveal which direction is gaining control.
The daily timeframe can become the first place where a directional change becomes visible.
Anticipating the Weekly Profile
After assessing daily order flow, ICT considers which weekly profile is most likely to develop.
A weekly profile describes the probable distribution of the weekly high, weekly low, expansion, and retracement.
The economic calendar helps frame this expectation.
The trader looks for:
- High-impact releases
- Central-bank announcements
- Inflation data
- Employment data
- Major London-session events
- Major New York-session events
- Quiet periods before important news
The calendar helps identify when liquidity runs and weekly expansion may occur.
Bullish Weekly Profile
In a bullish weekly environment, ICT may expect:
- A low to form on Monday, Tuesday, or Wednesday
- Price to trade below an important opening price
- A move into a discount array
- Expansion higher through the middle of the week
- A weekly high forming around Wednesday or Thursday
- Friday producing consolidation or retracement
A Monday low is possible, but ICT is willing to wait.
Tuesday often provides an optimal entry based on Monday’s range.
If Tuesday fails to produce the expected setup, Wednesday may create the low of the week.
Bearish Weekly Profile
In a bearish weekly environment, ICT may expect:
- A high to form on Monday, Tuesday, or Wednesday
- Price to trade above an important opening price
- A move into a premium array
- Expansion lower through the middle of the week
- A weekly low forming around Wednesday or Thursday
- Friday producing retracement or consolidation
The trader is not trying to predict the exact weekly profile with certainty.
The goal is to create a probable roadmap based on the economic calendar and institutional order flow.
The Tuesday-to-Thursday Weekly Range
ICT observes that much of the meaningful weekly range often develops between Tuesday and Thursday.
This does not mean Monday or Friday are unimportant.
Monday may establish the initial range, liquidity, or manipulation.
Friday may complete the move, rebalance price, or retrace from the weekly objective.
However, the central portion of the week frequently contains the strongest directional expansion.
The trader does not need to capture the absolute weekly high or low.
Capturing the main portion of the Tuesday-to-Thursday move may be sufficient.
Using the Economic Calendar
The weekly analysis should begin during the weekend.
The trader should review the entire week rather than checking one day at a time.
Important questions include:
- Which day contains the strongest economic driver?
- Will the event occur during London or New York?
- Is the beginning of the week quiet?
- Could the market consolidate before the event?
- Is price approaching a premium or discount array?
- Could the news create the manipulation phase?
- Which day is most likely to form the weekly high or low?
The economic calendar does not provide a perfect weekly-profile formula.
It provides timing context for possible liquidity events and expansion.
Correcting the Weekly Profile
The trader’s initial weekly-profile assumption may be wrong.
ICT adjusts the expectation as more information becomes available.
For example:
- Monday may fail to produce the expected low
- Tuesday may rally before reaching the buy level
- Wednesday may create a lower low and become the true weekly low
- A late-week economic event may shift the expansion toward Thursday
A wrong forecast does not invalidate the entire top-down analysis.
It requires the trader to update the short-term expectation using new price information.
Weekly Opening Prices
ICT monitors two important weekly reference prices:
- The natural Sunday weekly opening price
- The Monday midnight opening price in New York time
The Monday midnight opening can be taken from the opening price of the hourly candle that begins at 00:00 New York time.
These opening prices provide a framework for weekly Power of Three.
Bullish Use of Weekly Opens
When the higher-timeframe bias is bullish, ICT prefers to see price trade below one or both opening prices.
Price may then enter a discount array before expanding higher.
This can create:
- Accumulation near the opening price
- Manipulation below the open
- Expansion toward buy-side liquidity
The weekly opening price provides context for whether price is trading at a favorable discount during a bullish week.
Bearish Use of Weekly Opens
When the higher-timeframe bias is bearish, ICT prefers to see price trade above one or both opening prices.
Price may then reach a premium array before expanding lower.
This can create:
- Accumulation or consolidation near the open
- Manipulation above the opening price
- Expansion toward sell-side liquidity
The opening prices should be used with the PD Array Matrix rather than independently.
SMT Divergence From Daily to Four Hour
SMT divergence becomes particularly useful when moving from the daily chart to the four-hour chart.
The trader compares related markets and looks for disagreement at important highs or lows.
A bullish SMT divergence may appear when:
- The Dollar Index makes a higher high
- A foreign currency fails to make a lower low
It may also appear when:
- A currency makes a lower low
- The Dollar Index fails to make a higher high
This can indicate a sell-side liquidity run and a possible bullish reversal.
Bearish SMT Divergence
A bearish SMT divergence may occur when:
- The Dollar Index makes a lower low
- A foreign currency fails to make a higher high
It may also occur when:
- One positively correlated market makes a higher high
- Another fails to confirm that high
This may reveal distribution or relative weakness.
SMT divergence is strongest when it appears:
- At a daily PD array
- Near a weekly high or low
- During an important session
- Around a major economic release
- In agreement with higher-timeframe order flow
Daily Market Structure
The next step is to define the daily market structure.
The trader studies:
- Higher highs
- Higher lows
- Lower highs
- Lower lows
- Intermediate-term highs and lows
- Breaks in structure
- Displacement
- Institutional swing points
The daily chart reveals whether price is maintaining bullish or bearish delivery.
The four-hour chart then shows how the shorter-term swings are forming inside that daily structure.
Daily Breakers
ICT gives particular importance to daily bullish and bearish breakers.
A daily breaker can identify where the next intermediate-term price swing may begin.
A bullish breaker can provide support and create a one-sided bullish environment.
A bearish breaker can provide resistance and create a one-sided bearish environment.
Price can produce significant movement between a bullish breaker and a bearish breaker.
The trader does not need to capture the exact top or bottom.
The central portion of the move often provides sufficient opportunity.
Trading Between Daily Breakers
When price has reacted from a daily bullish breaker, the trader may focus on:
- Bullish Power of Three
- London Judas swings lower
- Discount entries
- Expansion into New York
- Buy-side liquidity targets
When price has reacted from a daily bearish breaker, the trader may focus on:
- Bearish Power of Three
- London Judas swings higher
- Premium entries
- Expansion lower into New York
- Sell-side liquidity targets
Daily breakers provide a clear directional framework for lower-timeframe execution.
Mitigation Blocks
Mitigation blocks also become more relevant during the daily-to-four-hour process.
A mitigation block can mark the area where institutional traders may rebalance previous positions before continuing price delivery.
In a bullish environment, a bullish mitigation block may provide support.
In a bearish environment, a bearish mitigation block may provide resistance.
The trader should not treat every candle as a valid mitigation block.
The level should fit the broader market structure and PD Array Matrix.
Applying the PD Array Matrix
After defining the daily market structure, the trader identifies relevant premium and discount arrays.
Possible discount arrays include:
- Bullish order blocks
- Bullish breakers
- Bullish mitigation blocks
- Fair value gaps
- Liquidity voids
- Rejection blocks
- Old lows
- Sell-side liquidity
Possible premium arrays include:
- Bearish order blocks
- Bearish breakers
- Bearish mitigation blocks
- Fair value gaps
- Liquidity voids
- Rejection blocks
- Old highs
- Buy-side liquidity
Not every array will be present.
Only clearly defined and contextually relevant arrays should be marked.
Why the PD Array Matrix Matters
The PD Array Matrix answers one of the most common trading questions:
Which order block should be used?
The correct answer depends on:
- The higher-timeframe bias
- The selected dealing range
- Premium and discount
- Institutional order flow
- Market structure
- Liquidity objectives
- Correlated-market confirmation
An order block is not important merely because it exists.
It becomes important when it is the correct array inside the correct portion of the dealing range.
Calibrating Key Price Levels
Once the daily PD arrays have been identified, ICT calibrates the levels to practical price points.
Depending on the market, levels may be rounded to the nearest:
- Five level
- Ten level
- Zero level
This creates realistic entry and target zones.
The exact PD array may not always be traded to the pip.
Price may react slightly before reaching it.
The trader should seek practical levels rather than demanding unnecessary precision.
Defining the Daily Bias
The final objective of the analysis is to establish a daily bias.
A bullish daily bias may include:
- Bullish monthly or weekly expectation
- Supportive commercial positioning
- Bullish open-interest condition
- Bullish daily order flow
- A bullish weekly profile
- Bullish SMT divergence
- A daily discount array
- Buy-side liquidity above price
A bearish daily bias may include:
- Bearish monthly or weekly expectation
- Bearish commercial positioning
- Bearish open-interest condition
- Bearish daily order flow
- A bearish weekly profile
- Bearish SMT divergence
- A daily premium array
- Sell-side liquidity below price
The daily bias provides direction, but it does not create an automatic entry.
Bullish Does Not Mean Buy Every Day
A bullish daily bias means that the trader prefers long opportunities when price reaches a qualified discount array.
The trader may still wait several days before entering.
Price may need to:
- Trade below the weekly opening price
- Reach a daily or four-hour discount array
- Raid sell-side liquidity
- Produce SMT divergence
- Align with an economic-calendar event
- Show lower-timeframe displacement
Only then does the trader consider execution.
“Just because we’re bullish doesn’t mean we’re buying every day.”
Bearish Does Not Mean Sell Every Day
A bearish daily bias means that the trader prefers short opportunities when price reaches a qualified premium array.
The trader waits for:
- Price above the weekly opening price
- A daily or four-hour premium array
- A buy-side liquidity run
- Bearish SMT divergence
- A relevant session
- Bearish displacement
The directional bias narrows the trader’s focus but does not eliminate the need for timing.
Time and Price Must Meet
A valid Short Term Top Down Analysis setup requires both time and price.
Price provides:
- Premium and discount arrays
- Liquidity pools
- Breakers
- Order blocks
- Fair value gaps
- Market structure
Time provides:
- Day of the week
- Session
- Economic release
- Weekly profile
- London or New York manipulation
- Monthly or weekly seasonal context
A setup becomes more meaningful when price reaches the correct institutional level during the correct time window.
“We have time and price meeting, and when it happens, we execute.”
Transposing the Daily Bias to Four Hour
Once the daily bias is established, the analysis is transferred to the four-hour chart.
The trader carries forward:
- Monthly levels
- Weekly levels
- Daily PD arrays
- Daily breakers
- Daily order blocks
- Weekly opening prices
- Liquidity objectives
- SMT relationships
The four-hour chart helps refine:
- The active dealing range
- Short-term premium and discount
- Four-hour institutional order flow
- Potential entry zones
- Intermediate liquidity targets
- Session-based execution
The four-hour chart should remain subordinate to the daily bias.
The Four-Hour Chart as a Refinement Tool
The four-hour timeframe provides enough detail to identify price delivery without creating excessive lower-timeframe noise.
It can reveal:
- A retracement into a daily PD array
- A smaller four-hour order block
- A four-hour breaker
- A fair value gap
- A liquidity sweep
- Displacement in the daily direction
- A more precise invalidation level
The four-hour chart connects the daily narrative to intraday execution.
A Bullish Short Term Top Down Example
Assume the monthly and weekly charts are bullish.
Commercial positioning is above the midpoint of its twelve-month range.
Price trades into a weekly discount array while open interest declines significantly.
The daily chart shows support at a down-close candle and breaks through an up-close candle.
The economic calendar shows an important event on Tuesday during New York.
Price trades below the Sunday open and Monday midnight open.
A related market makes a lower low, but the selected market forms a higher low, creating bullish SMT divergence.
Price is also trading from a daily bullish breaker.
This creates a bullish daily bias.
The trader then moves to the four-hour chart and looks for:
- Sell-side liquidity to be raided
- A four-hour bullish PD array
- Bullish displacement
- A retracement entry
- Buy-side liquidity as the objective
A Bearish Short Term Top Down Example
Assume the monthly and weekly charts are bearish.
Commercial positioning is below the midpoint of its recent range.
Price trades into a weekly premium array while open interest increases significantly.
The daily chart finds resistance at an up-close candle and breaks down through a down-close candle.
A high-impact economic release is scheduled for Wednesday.
Price trades above the Sunday open and Monday midnight open.
A related market makes a higher high, but the selected market fails to confirm it, creating bearish SMT divergence.
Price is reacting from a daily bearish breaker.
This creates a bearish daily bias.
The trader then moves to the four-hour chart and searches for:
- Buy-side liquidity to be raided
- A four-hour premium array
- Bearish displacement
- A retracement entry
- Sell-side liquidity as the objective
Common Mistakes in Short Term Top Down Analysis
Beginning With the Four-Hour Chart
The four-hour chart should refine an established daily bias, not create one without context.
Ignoring Monthly and Weekly Levels
Higher-timeframe levels can dominate short-term price action.
Trading Every Day
A directional bias does not guarantee a valid setup every session.
Misusing COT Data
The focus should be on commercial hedgers and their relative position within a recent range.
Forcing Open-Interest Analysis
Open interest should only be used when it meets meaningful bullish or bearish conditions.
Ignoring the Economic Calendar
Economic events often provide the timing for liquidity runs and weekly expansion.
Expecting Perfect Weekly Profiles
Weekly profiles are probabilities, not fixed templates.
Ignoring Weekly Opening Prices
The Sunday open and Monday midnight open help frame weekly premium and discount.
Marking Every PD Array
Only clear and relevant arrays should be included.
Treating Every Order Block Equally
The correct order block depends on the dealing range, bias, and institutional context.
Trading Against Daily Order Flow
Lower-timeframe setups can fail when they oppose the daily institutional direction.
Short Term Top Down Analysis Checklist
Before moving from the daily chart to the four-hour chart, review the following.
Higher-Timeframe Context
- What is the monthly bias?
- What is the weekly bias?
- Are they aligned?
Commercial Hedging
- What is the twelve-month commercial range?
- Is the current position above or below the midpoint?
- Does it support the trade idea?
Open Interest
- Has open interest declined significantly at a discount array?
- Has open interest increased significantly at a premium array?
- Is the change meaningful enough to include?
Daily Institutional Order Flow
- Are down-close candles supporting price?
- Are up-close candles resisting price?
- Which candles are being broken?
- Is displacement present?
Weekly Profile
- Is the week likely bullish or bearish?
- Which day may form the weekly high or low?
- Where are the important economic drivers?
- Is the likely expansion between Tuesday and Thursday?
Weekly Opening Prices
- Where is the Sunday open?
- Where is the Monday midnight New York open?
- Is price above or below these levels?
- Is price moving toward premium or discount?
Intermarket Analysis
- Are related markets confirming the idea?
- Is SMT divergence present?
- Which market is relatively stronger or weaker?
Daily Market Structure
- Is structure bullish or bearish?
- Where are the daily breakers?
- Are mitigation blocks relevant?
- Which intermediate-term swing is controlling price?
PD Array Matrix
- What is the active daily dealing range?
- Is price in premium or discount?
- Which arrays are clearly present?
- What is the next opposing array?
Four-Hour Refinement
- Has price reached a daily level?
- Is there a four-hour entry array?
- Has liquidity been raided?
- Has displacement confirmed direction?
- What is the invalidation level?
- What is the objective?
Final Thoughts
Short Term Top Down Analysis connects the higher-timeframe market narrative with practical short-term execution.
The process begins with monthly and weekly context and then studies:
- Commercial hedging
- Open interest
- Daily institutional order flow
- Weekly profiles
- Economic-calendar timing
- Weekly opening prices
- SMT divergence
- Daily market structure
- Breakers and mitigation blocks
- Premium and discount arrays
- Key price levels
These elements produce a daily directional bias that is then transferred to the four-hour chart.
The goal is not to trade every daily candle.
The goal is to wait until price reaches a qualified premium or discount array during a favorable time window, while institutional order flow and the higher-timeframe bias support the same direction.
The framework can be summarized as:
Higher-timeframe condition, daily institutional confirmation, weekly setup environment, and four-hour refinement.
By following this structure, traders can avoid reacting to isolated lower-timeframe movement and instead focus on opportunities that align with the broader institutional delivery of price.