The Next Setup – Anticipatory Skill Development is an important trading framework taught by Michael J. Huddleston, the founder of ICT (Inner Circle Trader). This concept is taught in ICT Mentorship Core Content – Month 3 and explains how traders can use higher timeframe institutional order flow to anticipate future setups before they become obvious on lower timeframe charts.
Many traders open a chart and immediately ask, What should I trade today?
ICT teaches a different approach.
Instead of waiting for a setup to suddenly appear, the trader studies the Monthly Chart, defines the institutional price range, marks important reference levels, and then waits for price to move into an anticipated setup area.
As Michael J. Huddleston explains:
“It gives you a context to actually look into the marketplace with a specific mindset.”
The objective of anticipatory skill development is to know where the next setup may form before price reaches the level.
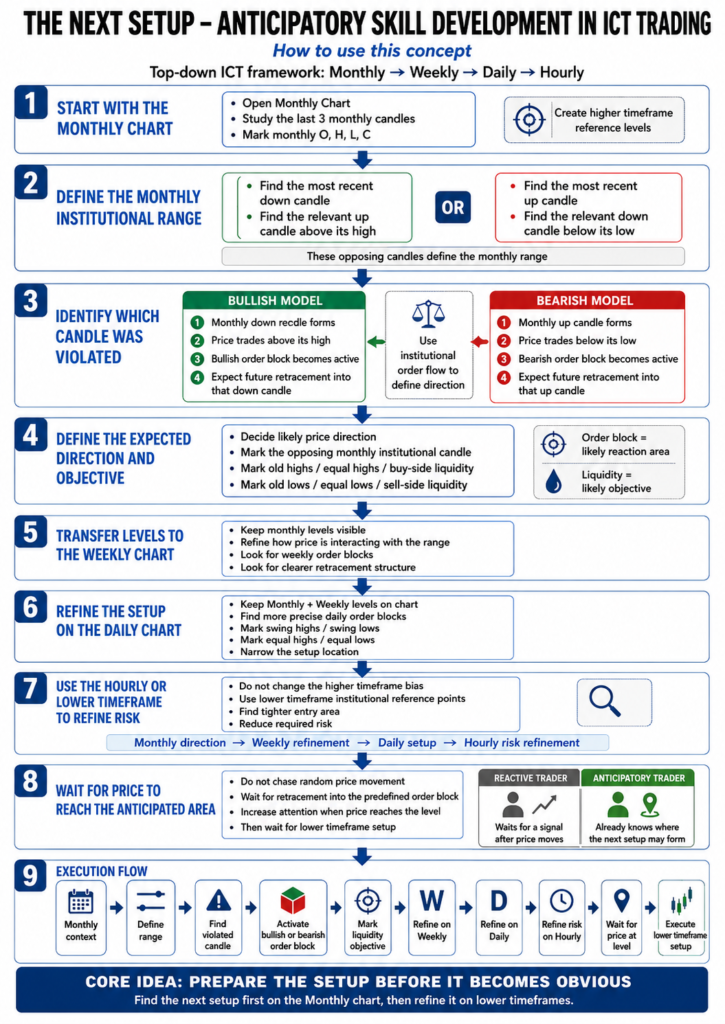
What is The Next Setup – Anticipatory Skill Development?
The Next Setup – Anticipatory Skill Development is the process of using higher timeframe institutional order flow to forecast the areas where future trading setups may develop.
The trader is not trying to predict every candle.
Instead, the trader identifies:
- The current Monthly price range
- Recent institutional order flow
- Bullish and bearish order blocks
- Important Monthly open, high, low, and close levels
- The probable direction of price
- The next opposing institutional reference point
These levels are then transferred to lower timeframes.
The trader knows where to focus before a lower timeframe setup forms.
This creates anticipation instead of reaction.
Why ICT Starts With the Monthly Chart
The Monthly Chart is important because large Monthly price swings require significant capital.
Retail traders cannot independently create major Monthly price expansion.
Large movements on this timeframe suggest strong buying or selling interest from major market participants.
ICT teaches traders to study where large amounts of money may be entering the marketplace.
Huddleston explains:
“Monthly charts are only going to move with a great deal of money behind these price swings.”
Therefore, the Monthly Chart can provide a broad view of institutional order flow.
A trader may use this information to identify a price area where future Weekly, Daily, or hourly setups may form.
Mark the Last Three Monthly Candles
One exercise used for developing anticipatory skill is studying the recent Monthly candles.
For markets or currency pairs that interest you, study approximately the last three months of price action.
Mark the:
Open
High
Low
Close
of each Monthly candle.
These Monthly OHLC levels can then be transposed onto the Weekly, Daily, and lower timeframe charts.
Some levels may overlap or appear very close together.
That is not necessarily a problem.
The purpose is to create important higher timeframe reference points.
When price reaches these levels on a lower timeframe, the trader already understands where the level originated.
Find the Most Recent Down Candle and Up Candle
The next step is to define a Monthly price range.
ICT teaches a simple process.
First, find the most recent down candle.
Then look to the left for the relevant up candle above the high of that down candle.
These two opposing candles can help define the Monthly range.
In a bearish situation, the process can be reversed.
Find the most recent up candle and identify the opposing down candle associated with the range.
The trader is essentially identifying two important institutional reference points.
Michael J. Huddleston explains:
“Find the most recent up candle and most recent down candle. There’s your range.”
This range gives the trader a framework for anticipating the next price move.
How a Bullish Monthly Order Block Becomes Activated
Suppose a down candle forms on the Monthly Chart.
Later, price trades above the high of that down candle.
In the ICT framework, this violation can activate the down candle as a bullish order block.
The trader can now anticipate a future return to that Monthly down candle.
The basic idea is:
Monthly down candle forms
↓
Price trades above its high
↓
Bullish order block becomes active
↓
Wait for price to retrace into the down candle
↓
Look for bullish setup
↓
Anticipate movement toward the opposing up candle or higher objective
The trader does not need to chase price after the bullish expansion.
The trader already has an area where a future setup may form.
That is anticipatory trading.
How a Bearish Monthly Order Block Becomes Activated
The bearish model is the opposite.
Suppose an up candle forms on the Monthly Chart.
Price later trades below the low of that up candle.
The violation may activate the candle as a bearish order block.
The trader can then wait for price to retrace higher into this Monthly institutional range.
The framework becomes:
Monthly up candle forms
↓
Price violates its low
↓
Bearish order block becomes active
↓
Price retraces into the up candle
↓
Look for bearish setup
↓
Anticipate lower price objectives
The opposing Monthly down candle or liquidity below old lows may become the next objective.
Use Institutional Order Flow to Define Direction
The Monthly range alone is not enough.
The trader must also determine where recent institutional order flow has delivered price.
Ask:
Did price violate a down candle and activate bullish order flow?
or
Did price violate an up candle and activate bearish order flow?
If price trades above an important Monthly down candle, the trader may anticipate bullish conditions.
The Monthly bullish order block can become a future buying area.
Price may then seek the opposing Monthly up candle.
If price breaks below an important Monthly up candle, bearish order flow may be expected.
The activated bearish order block can become a future selling area.
The trader may then anticipate lower institutional objectives.
This provides directional context for the next setup.
Transfer Monthly Levels to the Weekly Chart
After defining the Monthly range, move to the Weekly Chart.
Do not remove the Monthly levels.
Keep them visible.
The Weekly Chart provides more price detail and allows the trader to see how price is interacting with the Monthly institutional range.
Suppose a Monthly down candle has become a bullish order block.
On the Weekly Chart, price may retrace into that Monthly level.
The trader may also see Weekly down candles being violated by bullish price movement.
These Weekly candles can provide more refined bullish order blocks.
The Monthly Chart gives the directional framework.
The Weekly Chart begins refining the setup.
Refine the Setup on the Daily Chart
After studying the Weekly Chart, move to the Daily Chart.
The Monthly and Weekly reference levels should remain visible.
The Daily Chart may reveal:
- Bullish order blocks
- Bearish order blocks
- Equal highs
- Equal lows
- Old swing highs
- Old swing lows
- More precise retracement levels
Suppose the Monthly Chart is bullish.
Price retraces toward a Monthly bullish order block.
On the Daily Chart, the trader may identify a smaller down candle before a strong bullish move.
Price retraces into this Daily bullish order block.
The trader now has a more refined area for risk.
The process is:
Monthly direction
↓
Weekly refinement
↓
Daily setup
↓
Lower timeframe risk refinement
This is the ICT top-down approach.
Use Lower Timeframes to Refine Risk
The trader may continue from the Daily Chart to the hourly or another lower timeframe.
The objective is not to change the higher timeframe analysis.
The objective is to find a more precise setup and reduce the required risk.
For example:
A Monthly bullish order block covers a large price range.
The Weekly Chart narrows the important area.
The Daily Chart reveals a more precise bullish order block.
The hourly chart may provide a smaller institutional entry range.
The trader is moving closer to price while maintaining the original Monthly directional framework.
This is how higher timeframe analysis can lead directly into a lower timeframe setup.
Anticipate the Opposing Order Block as an Objective
Once the Monthly range is defined, the opposing institutional candle may provide a logical price objective.
Suppose price activates a bullish Monthly order block.
The trader looks above price for the previous Monthly up candle.
That up candle may act as a bearish order block or an opposing institutional reference point.
Price can potentially trade from the bullish order block toward this bearish reference point.
The range can be simplified as:
Bullish Monthly Order Block
↓
Price expansion higher
↓
Opposing Monthly Bearish Order Block
The same concept works in reverse.
A bearish Monthly order block may provide the starting point for a price move toward a lower bullish institutional level.
The trader is therefore working inside a known higher timeframe range.
Old Highs and Equal Highs as Price Objectives
Institutional order flow should also be combined with liquidity analysis.
Suppose the Monthly framework indicates higher prices.
Above the marketplace, the trader identifies:
- Old highs
- Equal highs
- Buy-side liquidity
These price levels can provide additional objectives.
The bullish order block tells the trader where buying may occur.
The highs above price tell the trader where price may be drawn.
A trader can therefore anticipate:
Price retracement into bullish order block
↓
Bullish reaction
↓
Price expands higher
↓
Old highs or equal highs are targeted
This gives the setup both an entry framework and a logical objective.
You Do Not Need to Trade Every Market
The Monthly Chart exercise can be performed across multiple markets.
However, this does not mean the trader should trade every currency pair or instrument.
The purpose is to develop price-reading skill.
Study different markets.
Mark the recent Monthly open, high, low, and close.
Identify the latest up candle and down candle.
Define the Monthly range.
Determine which institutional candle has been violated.
Then observe how price moves through the range.
With repeated study, traders can develop the ability to quickly identify markets where a future setup may be developing.
The goal is to find the clearest opportunities.
Stop Waiting for a Neon Sign
One of the biggest benefits of The Next Setup – Anticipatory Skill Development is that the trader no longer needs to wait for an obvious setup to suddenly appear.
Many traders approach the chart with no directional context.
They wait for an indicator signal.
They wait for a pattern.
They wait for something to tell them to buy or sell.
ICT teaches traders to perform the analysis before the setup appears.
Huddleston explains that traders should not be:
“Waiting for a neon sign to jump off at you.”
The trader should already know the important Monthly levels.
The trader should already understand the higher timeframe range.
The likely institutional direction should already be defined.
When price moves toward the anticipated area, attention increases.
Now the trader waits for the lower timeframe setup.
A Simple ICT Anticipatory Setup Process
The entire process can be simplified into a step-by-step model.
Step 1. Open the Monthly Chart
Start with the higher timeframe.
Do not begin by searching for entries on a 5-minute chart.
Step 2. Mark Recent Monthly OHLC Levels
Study approximately the previous three Monthly candles.
Mark their open, high, low, and close.
Step 3. Find the Recent Up and Down Candles
Use the opposing Monthly candles to define the current institutional range.
Step 4. Study Which Candle Has Been Violated
A down candle violated to the upside may become a bullish order block.
An up candle violated to the downside may become a bearish order block.
Step 5. Define the Expected Direction
Use recent institutional order flow to determine whether price is more likely to seek higher or lower objectives.
Step 6. Identify the Opposing Institutional Level
Find the next Monthly up candle or down candle that may act as an objective.
Also study old highs, equal highs, old lows, and equal lows.
Step 7. Transfer the Levels to the Weekly Chart
Keep the Monthly reference points visible and refine the price action.
Step 8. Move to the Daily Chart
Look for more precise order blocks and lower timeframe setup characteristics.
Step 9. Refine Risk on the Hourly Chart
Use a lower timeframe institutional reference point when a more precise entry is needed.
Step 10. Wait for Price to Reach Your Anticipated Area
Do not chase random price movement.
The setup location should already be defined before price arrives.
Why Anticipatory Skill is Important in ICT Trading
Anticipatory skill changes how a trader studies price.
A reactive trader sees a large bullish candle and begins searching for a reason to buy.
An anticipatory trader previously identified the Monthly bullish order block and expected price to react from the area.
The reactive trader sees price collapse and starts looking for shorts.
The anticipatory trader already identified the Monthly bearish order block and the lower institutional objective.
The difference is preparation.
ICT traders use higher timeframe information to develop an expectation.
Lower timeframe price action is then used to refine the idea.
The trader is not trying to know every future candle.
They are trying to identify where the next high-probability setup may logically develop.
Final Thoughts
The Next Setup – Anticipatory Skill Development teaches ICT traders how to use the Monthly Chart and institutional order flow to prepare for future trading opportunities.
Start by studying recent Monthly candles.
Mark their open, high, low, and close.
Find the most recent up candle and down candle.
Use these institutional reference points to define the Monthly range.
Then determine whether price has activated a bullish or bearish order block.
Once the higher timeframe direction is understood, transfer those levels to the Weekly, Daily, and hourly charts.
The Monthly Chart tells you where the larger institutional range exists.
The lower timeframes help refine the setup and control risk.
Instead of opening the chart and asking, “What should I do today?”, you begin with specific levels, a directional framework, and an anticipated setup location.
That is the purpose of anticipatory skill development in ICT trading—finding the next setup before it becomes obvious to everyone else.