The ICT Institutional Order Flow Concept is an important price action framework taught by Michael J. Huddleston, the founder of ICT (Inner Circle Trader). This concept is taught in ICT Mentorship Core Content – Month 3 and explains how price moves between institutional liquidity, higher timeframe reference points, order blocks, and large pools of stop orders.
Institutional Order Flow is not simply about identifying whether a chart looks bullish or bearish. The main idea is to understand where large institutional liquidity is located and which area price is likely to seek next.
As Michael J. Huddleston explains:
“Institutional order flow is the seeking of large institutional liquidity.”
This means the trader should stop thinking only about small retail stop losses and instead study the areas where large funds may have significant money at risk.
What is ICT Institutional Order Flow?
ICT Institutional Order Flow is the directional movement of price as it seeks large pools of liquidity and moves between important institutional price levels.
In the ICT framework, the market is continuously moving from one area of liquidity to another.
Price may move toward:
- Buy stops above old highs
- Sell stops below old lows
- Monthly and Weekly liquidity
- Bullish order blocks
- Bearish order blocks
- Liquidity voids
- Mitigation blocks
- Breakers
Institutional Order Flow helps the trader understand the likely path of price delivery.
For example, if price has reached a higher timeframe bearish reference point and large sell-side liquidity is present below old lows, Institutional Order Flow may become bearish.
The trader can then look for selling setups that align with this bearish expectation.
Think Like a Market Maker
To understand ICT Institutional Order Flow Concept, Michael J. Huddleston teaches traders to think from a market efficiency perspective.
Ask one important question:
Where is the maximum amount of liquidity relative to where price has traded and where price is currently trading?
Suppose price has already moved lower and cleared a major pool of sell stops.
The sell-side liquidity has already been absorbed.
The next important liquidity may now exist above the market.
Price may therefore begin moving higher toward:
- Previous highs
- Buy stops
- A bearish order block
- An unbalanced price range
The trader is not predicting price because of a moving average crossover.
The trader is studying where price has already delivered and where the next large pool of liquidity may exist.
Institutional Order Flow Starts from Higher Timeframes
The most important Institutional Order Flow levels are generally identified from the Monthly and Weekly Charts.
According to ICT, large funds operate with significant amounts of capital.
Their positions and protective orders can create important pools of liquidity on higher timeframes.
Michael J. Huddleston explains:
“You have to find them on the higher time frame and arrive at where the higher time frame charts are going to seek liquidity.”
This is why ICT traders should not begin Institutional Order Flow analysis from a 1-minute or 5-minute chart.
The process normally starts with:
Monthly Chart → Weekly Chart → Daily Chart
The Monthly Chart provides the broad institutional framework.
The Weekly Chart refines the price movement.
The Daily Chart allows the trader to observe detailed price responses and trading setups around those higher timeframe levels.
Why Monthly and Weekly Liquidity is Important
Large institutional funds may control billions of dollars.
Because of their position size, their orders create much more meaningful liquidity than the stop loss of an individual retail trader.
ICT teaches that large price moves often seek areas where large funds may be positioned.
This may include liquidity:
Above major Monthly or Weekly highs
or
Below major Monthly or Weekly lows
When large pools of stop orders exist around these levels, price may reprice toward them.
As Huddleston explains:
“It’s not our liquidity. It’s not our stops it’s looking for.”
The idea is that the largest price swings are generally connected with fund-level institutional liquidity.
This is why Monthly and Weekly price levels can influence major movements visible on the Daily Chart.
Focus on Candle Bodies and Institutional Volume
One important part of ICT Institutional Order Flow analysis is the study of candle bodies.
Traditional technical analysis generally considers the absolute wick high or wick low as the important price level.
ICT gives more attention to the bodies of higher timeframe candles.
According to the concept, the candle body is treated as a more important representation of institutional price delivery.
The wicks may represent extreme price delivery and areas where retail stops are positioned.
Therefore, when studying higher timeframe liquidity, the trader may focus on where multiple candle bodies terminate around the same general price level.
For example, several Monthly candles may have bodies that close around a similar low.
The candle wicks may extend below the area.
ICT traders may study the price below those candle bodies as a potential area of sell-side liquidity.
Price does not always need to completely violate every wick.
A movement below the bodies of the candles may be enough to reach an important liquidity area.
How Price Seeks Institutional Liquidity
Consider a simple bearish example.
Price has traded higher into a Monthly bearish order block.
The market previously delivered price lower from this area.
Below current price, several Monthly candle bodies terminate around a similar level.
These lows may represent an area where large sell stops are positioned.
The trader can now form a bearish expectation.
The Institutional Order Flow narrative becomes:
Higher timeframe bearish reference point reached
↓
Large sell-side liquidity identified below price
↓
Price expected to seek the lower liquidity
↓
Trader looks for bearish setups
The trader is not simply selling because price appears overbought.
There is a known institutional reference point and a logical liquidity objective.
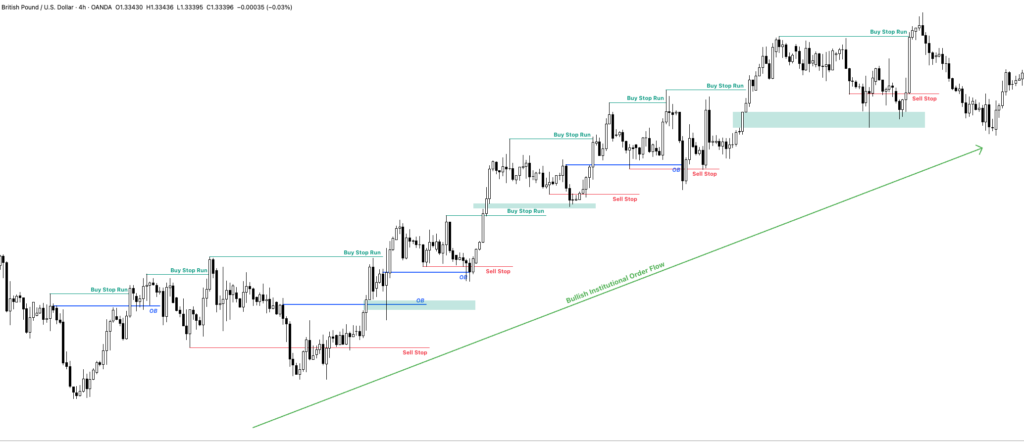
Bullish Institutional Order Flow
Institutional Order Flow is considered bullish when higher timeframe analysis suggests price is likely to seek liquidity above the market.
Suppose price trades lower and clears sell-side liquidity.
Price then reaches a Monthly bullish order block.
The liquidity below the market has already been absorbed.
Above price, there may be:
- Old highs
- Buy stops
- A liquidity void
- A Monthly bearish order block
Price may now begin repricing higher.
During bullish Institutional Order Flow, ICT traders expect bullish price characteristics.
A down candle followed by strong expansion higher may form a bullish order block.
When price retraces into the bullish order block, new buying may appear.
The trader may continue looking for buying setups while the higher timeframe bullish Institutional Order Flow remains valid.
Bearish Institutional Order Flow
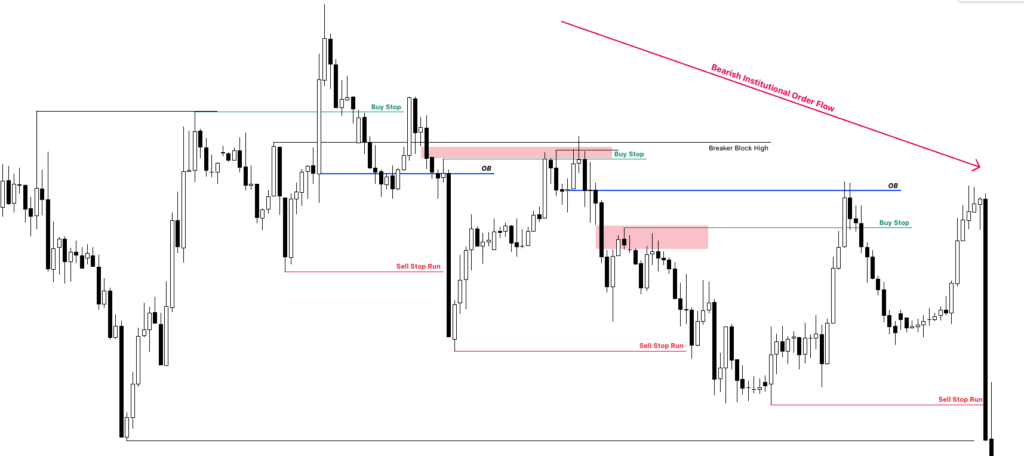
Bearish Institutional Order Flow occurs when the higher timeframe narrative indicates lower prices.
For example:
Price reaches a Monthly bearish order block.
A large pool of sell-side liquidity exists below the market.
Price begins showing bearish displacement.
The trader can now expect price to continue seeking lower liquidity.
During this bearish environment, the trader may focus on:
- Bearish order blocks
- Breakers
- Runs above old highs
- Buy-side liquidity sweeps
- Retracements into institutional price levels
Every short-term rally is not automatically a buying opportunity.
The higher timeframe Institutional Order Flow may suggest that the rally is simply positioning price for another bearish expansion.
The Shift in Institutional Order Flow
Institutional Order Flow does not remain permanently bullish or bearish.
Price may move from one liquidity objective to another.
Suppose Institutional Order Flow is bearish.
Price moves lower and eventually clears the expected sell stops.
The bearish liquidity objective has now been reached.
Price also enters a higher timeframe bullish order block.
The trader must now ask:
Where is the next large pool of liquidity?
If significant liquidity exists above price, Institutional Order Flow may shift bullish.
The sequence may look like:
Bearish Order Flow
↓
Price seeks sell-side liquidity
↓
Sell stops cleared
↓
Bullish institutional reference point reached
↓
Institutional Order Flow turns bullish
↓
Price seeks buy-side liquidity
Understanding this shift is important.
A trader should not remain permanently bearish simply because the previous market move was bearish.
The liquidity objective and higher timeframe price location must always be considered.
Using the Monthly Chart to Map Institutional Order Flow
The Monthly Chart can be used to map large bullish and bearish areas of Institutional Order Flow.
First, identify important Monthly order blocks and liquidity voids.
Then identify major concentrations of liquidity above or below price.
The trader can now determine the likely direction between these institutional reference points.
For example:
A Monthly bearish order block is present above.
Large sell-side liquidity is present below.
Price reaches the Monthly bearish order block.
The trader may expect bearish Institutional Order Flow until price reaches the sell-side liquidity.
After the lower liquidity is cleared, the trader studies the next higher timeframe reference point.
The process is repeated.
In this way, a large period of price action can be divided into bullish and bearish Institutional Order Flow environments.
Refining Institutional Order Flow on the Weekly Chart
After identifying Institutional Order Flow from the Monthly Chart, move to the Weekly Chart.
The Weekly Chart provides more detailed price structure.
Suppose the Monthly Chart indicates bearish Institutional Order Flow.
On the Weekly Chart, the trader may identify:
- A bearish order block
- A breaker
- A mitigation block
- A run above previous highs
These Weekly setups can provide opportunities to align with the Monthly bearish direction.
For example, price retraces into a Weekly bearish order block.
The Monthly liquidity objective remains below price.
The Weekly bearish order block may provide an area where new selling enters the market.
The Monthly Chart tells the trader where price may be going.
The Weekly Chart helps identify where the next institutional reaction may occur.
Transposing Monthly and Weekly Levels to the Daily Chart
One of the most useful ideas in the ICT Institutional Order Flow Concept is transposing higher timeframe levels onto the Daily Chart.
First, identify the important levels on the Monthly Chart.
Then refine them on the Weekly Chart.
Keep these levels visible when studying Daily price action.
Michael J. Huddleston explains:
“If you can find the levels on the monthly, weekly chart, keep them on your daily chart.”
This allows traders to observe Daily setups forming around higher timeframe institutional reference points.
A large Daily price expansion may appear random when viewed alone.
But after adding a Monthly bullish order block to the Daily Chart, the reaction may become much easier to understand.
This is why higher timeframe analysis is important in ICT trading.
Reading Bullish Order Flow on the Daily Chart
Suppose the Monthly and Weekly Institutional Order Flow is bullish.
Price reaches a higher timeframe bullish order block.
On the Daily Chart, the trader should wait for evidence that buyers are entering the market.
One important sign is a break above a short-term high.
Price may then retrace into a Daily down candle that formed before the bullish expansion.
This down candle can act as a bullish order block.
The sequence may look like:
Higher timeframe bullish area reached
↓
Short-term high is violated
↓
Bullish expansion appears
↓
Price retraces into bullish order block
↓
New buying appears
↓
Price continues toward higher liquidity
During bullish Institutional Order Flow, Daily bullish order blocks may repeatedly provide buying opportunities.
Reading Bearish Order Flow on the Daily Chart
The opposite process occurs during bearish Institutional Order Flow.
Suppose price has reached a Monthly bearish order block.
The higher timeframe liquidity objective is below the market.
On the Daily Chart, price begins breaking lower.
The last up candle before bearish displacement may act as a bearish order block.
When price retraces into this area, selling may appear.
The trader may also look for a breaker or a stop run above an old high.
The sequence becomes:
Higher timeframe bearish area reached
↓
Bearish displacement develops
↓
Short-term structure shows weakness
↓
Price retraces into bearish reference point
↓
Selling appears
↓
Price expands toward sell-side liquidity
The Daily Chart helps traders see the smaller price formations that support higher timeframe Institutional Order Flow.
Institutional Order Flow and Order Blocks
Order blocks become much more meaningful when studied in the context of Institutional Order Flow.
A trader should not mark every up candle as a bearish order block and every down candle as a bullish order block.
The expected direction of institutional price delivery is important.
During bullish Institutional Order Flow, the trader focuses more on bullish order blocks.
These are generally down candles connected with bullish expansion.
Price may retrace into these candles and find new buying.
During bearish Institutional Order Flow, the trader focuses more on bearish order blocks.
These are generally up candles connected with bearish expansion.
Price may retrace into these candles and find new selling.
The higher timeframe narrative tells the trader which side of the market to focus on.
Institutional Order Flow and Mitigation Blocks
ICT Institutional Order Flow also explains why mitigation occurs.
Banks may have both buying and selling positions as price moves between range extremes.
For example, smart money may buy to move price higher while also selling into the higher price movement.
Later, price is driven lower to attack liquidity.
Some positions may then need to be unwound.
When price returns to a previous institutional price range, large participants may offset or mitigate earlier positions.
This can form a mitigation block.
A strong reaction from a mitigation area is therefore connected with the process of unwinding previous institutional exposure.
The setup should still be studied within the higher timeframe Institutional Order Flow.
Institutional Order Flow and Breakers
A breaker can also provide a setup that aligns with Institutional Order Flow.
Suppose price is expected to move lower.
Price first trades higher through an old high and takes buy-side liquidity.
A previous down candle associated with this liquidity run may later act as a bearish breaker.
When price returns to the breaker, the trader may anticipate renewed bearish price delivery.
The breaker becomes more significant because the higher timeframe analysis already suggests that price should move lower.
Again, the setup is not isolated.
The Institutional Order Flow gives the setup its directional context.
Liquidity is the Objective of Price
The most important lesson behind ICT Institutional Order Flow Concept is that traders should always consider the next logical area of liquidity.
When bullish, ask:
Where are the buy stops?
Which old high may price attack?
Is there a higher timeframe bearish order block above price?
When bearish, ask:
Where are the sell stops?
Which old low may price attack?
Is there a higher timeframe bullish order block below price?
Price moves between institutional reference points and liquidity objectives.
Understanding this process helps traders create a directional expectation before searching for an entry.
How to Analyse ICT Institutional Order Flow
A simple top-down process can be used.
Step 1. Start with the Monthly Chart
Identify major order blocks, liquidity voids, old highs, and old lows.
Look for large pools of liquidity.
Step 2. Determine the Likely Liquidity Objective
Ask where the largest institutional liquidity may exist relative to current price.
Is price more likely to seek liquidity above or below?
Step 3. Define Institutional Order Flow
If price is expected to seek higher liquidity, maintain a bullish framework.
If price is expected to seek lower liquidity, maintain a bearish framework.
Step 4. Move to the Weekly Chart
Refine the higher timeframe idea.
Mark Weekly order blocks, breakers, mitigation blocks, and liquidity.
Step 5. Transfer the Levels to the Daily Chart
Keep important Monthly and Weekly institutional levels visible.
Study how Daily price reacts around these levels.
Step 6. Wait for a Setup in the Institutional Direction
During bullish order flow, look for bullish price formations.
During bearish order flow, look for bearish price formations.
Step 7. Use Liquidity as the Price Objective
Your target should be connected with a logical liquidity area or higher timeframe institutional reference point.
Final Thoughts
The ICT Institutional Order Flow Concept teaches traders to understand price from the perspective of liquidity and higher timeframe institutional participation.
The market is not simply moving randomly between support and resistance.
In the ICT framework, price continuously seeks liquidity and reprices between important institutional areas.
Monthly and Weekly Charts help identify fund-level liquidity.
The Daily Chart shows how price delivers toward these higher timeframe objectives.
When Institutional Order Flow is bullish, traders can focus on bullish order blocks, bullish price reactions, and liquidity above the marketplace.
When Institutional Order Flow is bearish, traders can focus on bearish order blocks, breakers, runs above old highs, and liquidity below the marketplace.
The key is always to ask:
Where is the large institutional liquidity?
Which higher timeframe level is price reacting from?
Where should price logically reach next?
Once these questions become part of your analysis, ICT Institutional Order Flow can provide a clearer framework for understanding directional price delivery and defining high-probability trading setups.