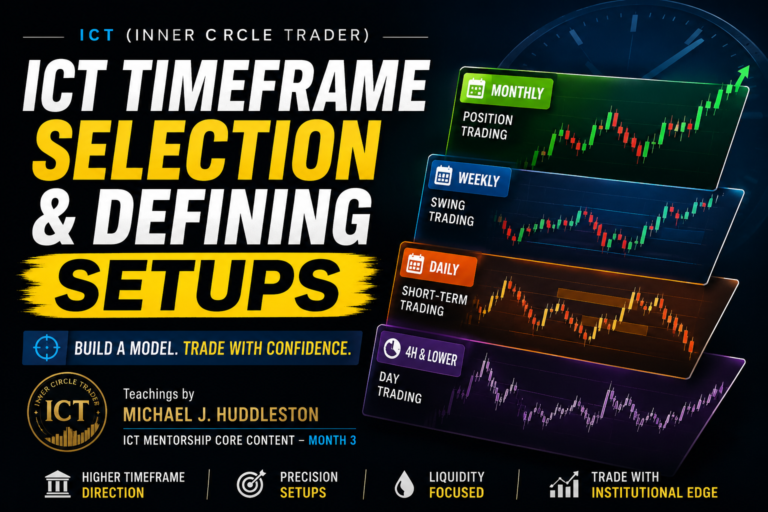
The ICT Macro Economic To Micro Technical concept is a higher timeframe analysis framework taught by Michael J. Huddleston, the founder of ICT (Inner Circle Trader). This concept is taught in ICT Mentorship Core Content – Month 3 and explains how traders can use the bond market, interest rates, and the U.S. Dollar Index to build a three-to-six-month market outlook before refining that macro idea into technical trade setups.
Many traders begin with a 15-minute or 5-minute chart and immediately search for an entry.
ICT approaches the market from the opposite direction.
First, determine the larger macroeconomic influence.
Then identify the likely direction of the U.S. dollar.
After that, move into individual currency pairs and use technical price action to find the trade.
As Michael J. Huddleston explains:
“It’s a macro perspective using macroeconomic principles, interest rates, and then utilizing that down to a micro technical.”
This is the main idea behind ICT Macro Economic To Micro Technical analysis.
What is the ICT Macro Economic To Micro Technical Concept?
The ICT Macro Economic To Micro Technical concept is a top-down method of using macroeconomic market relationships to create a long-term directional view and then applying ICT price action concepts for technical execution.
The macro part focuses mainly on:
- Interest rates
- 30-year U.S. Treasury bond futures
- 10-year Treasury note futures
- U.S. Dollar Index
- SMT divergence
- Quarterly market shifts
The micro technical part focuses on:
- Order blocks
- Liquidity
- Buy-side and sell-side liquidity
- Higher timeframe bias
- 4-hour and 60-minute setups
- Intraday execution models
The macro analysis tells the trader which direction deserves attention.
The technical analysis helps define where and how to enter.
Why ICT Studies Interest Rates
Interest rates have a major influence on global financial markets.
ICT uses the interest-rate market as a barometer for the longer-term direction of currencies.
Instead of studying a large number of economic reports, Huddleston focuses on the price action of debt instruments.
He explains:
“What I require is a visual interpretation of that data.”
For ICT, the bond market provides that visual interpretation.
If a trader can read price action in the bond market, the trader may develop an expectation for the future direction of interest rates.
Once the likely interest-rate direction is understood, the trader can study its possible influence on the U.S. Dollar Index.
Why ICT Uses the 30-Year Treasury Bond
The 30-year Treasury bond market is one of the main markets used in this concept.
The relationship between bond prices and interest rates is inverse.
When bond prices rise, interest rates generally move lower.
When bond prices fall, interest rates generally move higher.
The simple relationship is:
Bond prices higher = Interest rates lower
Bond prices lower = Interest rates higher
This inverse relationship is important because interest-rate conditions can influence demand for the U.S. dollar.
ICT studies the 30-year Treasury bond futures market to anticipate longer-term changes in interest rates.
The 10-Year Treasury Note
ICT also compares the 10-year Treasury note with the 30-year Treasury bond.
The two debt instruments can be studied for SMT divergence.
For example, the 10-year note may create a higher high while the 30-year bond fails to make a corresponding higher high.
This non-symmetrical condition can indicate an underlying change in the interest-rate market.
The same SMT principle used between DXY and foreign currencies can therefore be applied to debt instruments.
The trader compares the respective highs and lows of the 10-year and 30-year markets.
When one market fails to confirm the other, the divergence may provide an early indication of a future move in interest rates.
Understanding the Interest Rate and Dollar Relationship
In the framework taught by ICT, increasing interest rates can support demand for the U.S. dollar.
If Treasury bond prices begin declining, the decline suggests interest rates are increasing.
If the interest-rate environment is moving higher, ICT may anticipate stronger demand for the Dollar Index.
The basic relationship used in the concept is:
Bond market declines
Then:
Interest rates increase
Then:
Dollar demand may increase
Then:
DXY may rally
If DXY is expected to rally, traders may begin studying dollar-based currency pairs for opportunities aligned with dollar strength.
This macro relationship provides the directional foundation.
The Three-to-Six-Month Market Outlook
ICT Macro Economic To Micro Technical analysis is not primarily a day trading concept.
The first objective is to create a three-to-six-month outlook.
The trader studies Daily Charts.
There is no need to begin on a 15-minute, 1-hour, or even 4-hour chart.
The trader wants to understand the larger market direction.
Huddleston explains:
“I’m looking for an insight that would give me a three to six month outlook on where currencies may be heading.”
Once the long-term directional view is established, short-term and day trading setups can be aligned with that expectation.
ICT Quarterly Shift Concept
ICT also teaches that an important change in market conditions may occur approximately every three to four months.
This is referred to as a quarterly shift.
The existing market condition may experience:
- A reversal
- A prolonged consolidation
- A continuation after consolidation
- A change in directional order flow
The trader should therefore pay close attention to major market changes around these three-to-four-month periods.
The quarterly shift does not mean price must reverse every three months.
It means the trader should look for an underlying change in market conditions.
Interest-rate markets can provide important evidence of these changes.
Interest Rate SMT Divergence
The concept uses SMT divergence to compare interest-rate markets and the Dollar Index.
Suppose the bond market creates a higher high.
At the same time, the Dollar Index should normally show corresponding weakness.
But DXY fails to create a lower low.
This failure indicates non-symmetrical price action.
The Dollar Index is showing underlying strength.
If bond prices later begin moving lower, interest rates are increasing.
The higher interest-rate environment may support a rally in DXY.
The trader can therefore use the divergence as an early indication of a macro directional shift.
DXY Failure to Make a Lower Low
One important example occurs when the Dollar Index refuses to make a lower low.
Suppose the bond market reaches a higher high.
Based on the expected relationship, DXY should be weak.
However, the Dollar Index forms a higher low.
DXY has failed to make the expected lower low.
This may indicate underlying dollar accumulation.
If the bond market then begins to sell off, interest rates begin increasing.
Now both conditions may support dollar strength.
The trader can develop a bullish DXY outlook.
This macro framework can then be used to study dollar-based currency pairs.
Using Bond Order Blocks
ICT also applies order block analysis to bond futures.
Suppose the bond market rallies into an up candle that previously produced a strong bearish move.
This candle may act as a bearish order block.
If bonds retrace into the bearish order block and begin selling off, the decline suggests increasing interest rates.
At the same time, DXY may retrace into a bullish order block.
The trader may now have two supporting conditions:
Bond market at a bearish order block
and
DXY at a bullish order block
If bonds decline and DXY rallies, the macro narrative is confirmed.
This is where macroeconomic market relationships and ICT technical analysis begin to work together.
Using the 10-Year and 30-Year SMT Divergence
The 10-year note and 30-year bond can also reveal changes before the Dollar Index begins its larger move.
Suppose the 10-year note creates a higher high.
The 30-year Treasury bond creates a lower high.
The two debt instruments do not confirm each other.
This SMT divergence may warn that the bond rally is weak.
If both debt instruments then decline, interest rates are increasing.
The trader can anticipate stronger dollar conditions.
Now the trader studies DXY for:
- Bullish order blocks
- Sell-side liquidity runs
- Bullish displacement
- Higher lows
- Institutional accumulation
The interest-rate divergence provides the macro clue.
The Dollar Index provides further confirmation.
From the Dollar Index to Currency Pairs
Once ICT develops a bullish or bearish outlook for DXY, the analysis moves into individual currency pairs.
If the Dollar Index is expected to move higher, ICT may study currency pairs beginning with USD for bullish setups.
Examples include:
USD/CHF
USD/CAD
USD/JPY
In these pairs, U.S. dollar strength may support higher prices.
For currency pairs where USD is the quote currency, the trader may expect bearish conditions.
Examples include:
EUR/USD
GBP/USD
AUD/USD
NZD/USD
Dollar strength can place downward pressure on these foreign currencies.
The trader now has a directional framework before studying the technical chart.
Bullish Dollar Macro Framework
A bullish DXY macro view can be simplified as follows.
Bond prices begin showing weakness.
Interest rates are expected to increase.
Interest-rate SMT divergence supports the change.
DXY shows underlying strength or accumulation.
The trader expects the Dollar Index to move higher.
The trader can now focus on:
Buying USD/CHF
Buying USD/CAD
Buying USD/JPY
or
Selling EUR/USD
Selling GBP/USD
Selling AUD/USD
Selling NZD/USD
The trader is not required to trade every pair.
The objective is to identify the clearest technical setup that agrees with the macro dollar bias.
Bearish Dollar Macro Framework
The opposite condition applies when bond prices are expected to rally.
A rally in the bond market may indicate lower interest rates.
Lower interest-rate conditions may support a weaker Dollar Index.
If DXY also shows bearish Institutional Market Structure, the trader may develop a bearish dollar outlook.
Now the trader can study:
Selling USD-based pairs where USD is the base currency
and
Buying foreign currencies where USD is the quote currency
The macro analysis again determines the preferred side of the market.
Technical analysis is then used for execution.
Macro Direction Does Not Give the Exact Entry
One important point is that macro analysis does not automatically give the exact trade entry.
Knowing that the Dollar Index may rally for the next several months does not mean the trader should randomly buy USD pairs.
The macro view provides direction.
The trader must still wait for an ICT setup.
For example, suppose the macro framework is bullish DXY.
GBP/USD is therefore expected to move lower.
The trader may move to the Daily, 4-hour, or 60-minute chart and wait for:
- Bearish order block
- Buy-side liquidity run
- Turtle Soup
- Breaker
- Premium retracement
- Bearish displacement
The micro technical setup provides the actual trade opportunity.
From Daily Macro Analysis to 4-Hour Setup
Suppose interest-rate analysis suggests higher rates.
DXY is showing bullish conditions.
GBP/USD is expected to move lower.
The trader moves to the 4-hour chart.
Price retraces into a bearish order block.
Buy-side liquidity is taken above a short-term high.
Bearish displacement then develops.
The trade now has several layers of context.
The macro environment supports dollar strength.
The foreign currency is expected to weaken.
The 4-hour price action provides a bearish setup.
This is the transition from macroeconomic analysis to micro technical execution.
From Daily Macro Analysis to Day Trading
The same macro framework can be used by a day trader.
Suppose the long-term outlook is bullish DXY and bearish EUR/USD.
The day trader does not need to hold a trade for three to six months.
Instead, the trader can use the macro view as a directional filter.
During a New York session, EUR/USD may trade above the New York midnight opening price.
Price may run buy-side liquidity and enter a bearish order block.
The trader can look for an intraday short setup.
The macro analysis gives the directional bias.
The intraday model gives the entry and exit.
A long-term macro view can therefore guide short-term trading.
Why ICT Does Not Depend on Bank Reports
Huddleston explains that he does not rely heavily on bank reports to determine the long-term market direction.
His reasoning is simple.
Large financial institutions have no reason to publicly reveal their complete trading intentions.
Instead of depending on their published outlook, ICT studies the market they must participate in.
Interest-rate markets show price.
Bond futures show price.
The 10-year Treasury note shows price.
The Dollar Index shows price.
Price action provides a visual representation of changing market conditions.
The trader studies these relationships and develops a macro outlook.
The Macro to Micro Analysis Process
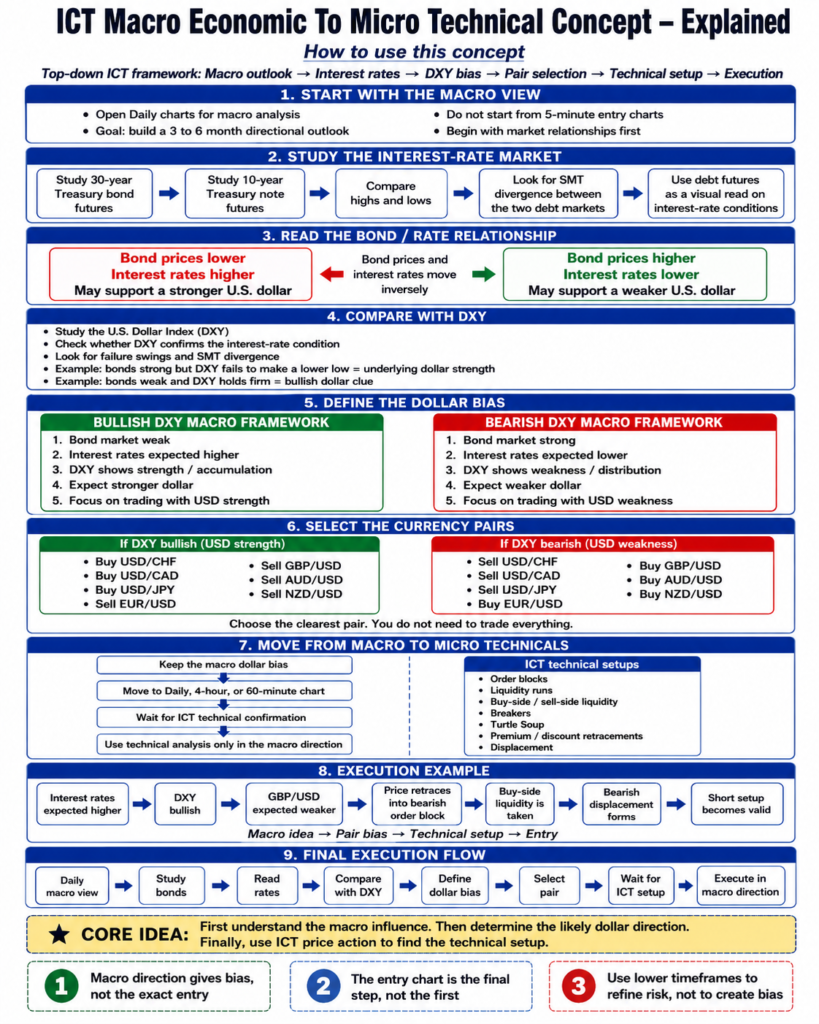
The ICT Macro Economic To Micro Technical concept can be simplified into a step-by-step process.
Step 1. Open the Daily Charts
Use Daily Charts for the macro analysis.
The initial objective is a three-to-six-month directional outlook.
Step 2. Study the 30-Year Treasury Bond
Determine whether bond prices are showing bullish or bearish conditions.
Remember the inverse relationship between bond prices and interest rates.
Step 3. Study the 10-Year Treasury Note
Compare the 10-year and 30-year debt instruments.
Look for SMT divergence at important highs and lows.
Step 4. Determine the Interest Rate Direction
Declining debt futures may indicate increasing interest rates.
Rising debt futures may indicate decreasing interest rates.
Step 5. Compare the Interest Rate Market With DXY
Study whether the Dollar Index confirms the expected interest-rate condition.
Look for failure swings and SMT divergence.
Step 6. Define the Dollar Bias
Determine whether DXY is more likely to move higher or lower.
Step 7. Select Currency Pairs
For bullish DXY conditions, study USD-based pairs for dollar strength.
For bearish DXY conditions, study foreign currency strength against USD.
Step 8. Apply ICT Technical Analysis
Move to Daily, 4-hour, 60-minute, or intraday charts.
Look for order blocks, liquidity runs, breakers, and other ICT setups.
Step 9. Execute in the Macro Direction
Use the lower timeframe setup to participate in the larger directional expectation.
Common Mistake: Starting With the Entry Chart
A common mistake is beginning the analysis on a very low timeframe.
The trader opens the 5-minute chart.
Price appears bullish.
The trader buys.
A few hours later, price moves sharply lower.
The trader had no understanding of the larger macro direction.
ICT Macro Economic To Micro Technical analysis starts from the opposite side.
First ask:
What are interest-rate markets suggesting?
Then:
What is the Dollar Index showing?
Then:
Which currencies should be strong or weak?
Finally:
Where is the technical setup?
The entry is the final part of the process, not the first.
Why the Concept Creates Directional Clarity
The main benefit of this concept is that it reduces directional ambiguity.
Without a macro framework, a trader may see both bullish and bearish setups on the same chart.
A bullish order block forms.
Then a bearish order block forms.
The trader constantly changes bias.
A macro framework provides a filter.
If interest-rate markets and DXY strongly support dollar strength, the trader can focus on setups aligned with that condition.
For GBP/USD, this may mean ignoring many bullish setups and concentrating on bearish retracements.
The trader is no longer trying to trade every price movement.
Final Thoughts
The ICT Macro Economic To Micro Technical concept teaches traders how to move from a long-term macroeconomic perspective into precise technical trade setups.
The process begins with interest rates.
ICT studies the 30-year Treasury bond and the 10-year Treasury note to understand the likely direction of the interest-rate environment.
SMT divergence between debt instruments can reveal an underlying shift.
The trader then compares this information with the U.S. Dollar Index.
If interest rates are increasing and DXY shows underlying strength, the trader may develop a bullish dollar outlook.
If interest-rate conditions support a weaker dollar, the trader may focus on foreign currency strength.
The analysis then moves from the Daily macro view into smaller technical timeframes.
Order blocks, liquidity runs, breakers, and other ICT setups are used to refine the entry.
As Michael J. Huddleston explains:
“It helps you. It builds an idea about where the market should go because of the underlying fundamentals.”
The purpose of ICT Macro Economic To Micro Technical analysis is not to replace technical trading.
It is used to give technical trading a larger directional framework.
First understand the macro influence.
Then determine the likely dollar direction.
Finally, use ICT price action to find the technical setup.
That is how ICT moves from macro economic analysis to micro technical execution.