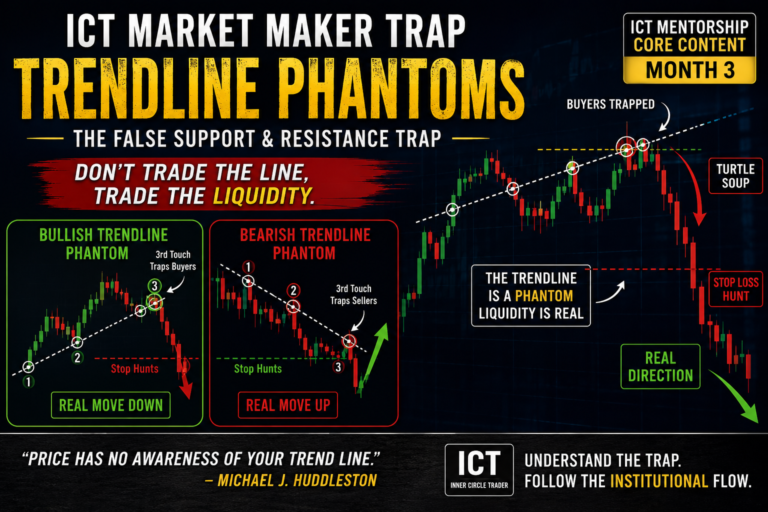
ICT Timeframe Selection & Defining Setups is an important concept taught by Michael J. Huddleston, the founder of ICT (Inner Circle Trader). This concept is taught in ICT Mentorship Core Content – Month 3 and explains how traders should select a timeframe, define a repeatable setup, and build a trading model that matches their own personality and lifestyle.
One of the biggest mistakes new traders make is trying to trade exactly like another trader. A day trader may force themselves to hold weekly positions. A swing trader may try to scalp a 1-minute chart.
According to ICT, timeframe selection should not be based only on potential profit. Your patience, psychology, available time, and ability to follow price action must also match the trading model.
As Michael J. Huddleston explains:
“It’s not about the setups or the time frame. It’s about your unique alignment with the setups.”
This is the core idea behind ICT Timeframe Selection & Defining Setups.
What is ICT Timeframe Selection?
ICT timeframe selection is the process of choosing a chart timeframe based on the type of trading you want to perform.
Different timeframes provide different forms of price information.
The Monthly Chart is mainly used for position trading.
The Weekly Chart is used for swing trading.
The Daily Chart is mainly used for short-term trading and higher timeframe directional analysis.
The 4-hour chart and lower timeframes are generally used for day trading and intraday execution.
The important point is that ICT concepts are not limited to one timeframe.
Order blocks, liquidity, stop runs, liquidity voids, and other price action characteristics can form on Monthly, Weekly, Daily, and intraday charts.
The timeframe changes the duration and frequency of the setup, but the underlying price action logic remains similar.
ICT Timeframe Selection Chart
| Timeframe | Trading Style | General Purpose |
|---|---|---|
| Monthly | Position Trading | Long-term price direction and major price swings |
| Weekly | Swing Trading | Intermediate-term price action and swing setups |
| Daily | Short-Term Trading | Daily bias, institutional levels, and short-term setups |
| 4 Hour or Lower | Day Trading | Intraday setups and execution |
Each trader does not need to trade all these timeframes in the same way.
The goal is to find the timeframe that allows you to execute your setup consistently.
Monthly Chart for Position Trading
In the ICT framework, the Monthly Chart provides a long-term price action reference.
It shows the largest price swings and helps traders identify where price has strongly moved away from an important level.
Monthly setups can take several months or even more than a year to form.
Because of this, position trading requires a very high level of patience.
However, when a Monthly setup develops, the potential price range can be extremely large.
The Monthly Chart can help identify:
- Long-term directional bias
- Major institutional reference points
- Monthly order blocks
- Large liquidity pools
- Equal highs and equal lows
- Long-term buy-side and sell-side liquidity
- Major price objectives
For example, suppose price trades into a Monthly bearish order block and large equal lows are present far below current price.
The trader may develop the expectation that price could move lower toward the sell-side liquidity below those lows.
The entire price swing between the Monthly bearish reference point and the liquidity objective creates a broad range.
A trader does not necessarily need to hold one trade for the entire range.
The Monthly Chart can simply provide the directional framework for Weekly, Daily, and intraday setups.
Weekly Chart for Swing Trading
The Weekly Chart provides an intermediate-term view of price action.
ICT associates the Weekly Chart mainly with swing trading.
A swing trader may only find a limited number of high-quality opportunities within several months. This means the trader must be comfortable waiting for a setup to develop.
The Weekly Chart can refine a Monthly price idea.
For example:
The Monthly Chart indicates bearish price delivery.
Price is expected to move toward sell-side liquidity.
The trader moves to the Weekly Chart.
Now the trader may identify:
- Weekly bearish order blocks
- Breakers
- Intermediate-term highs
- Intermediate-term lows
- Weekly liquidity
- Price consolidations
- Expansion phases
When price trades back into a Weekly bearish order block while the Monthly Chart remains bearish, it may provide another selling opportunity.
This is an important principle of ICT timeframe analysis.
The higher timeframe provides direction. The lower timeframe provides more detailed setup opportunities.
Why ICT Gives Importance to the Daily Chart
Michael J. Huddleston gives significant importance to the Daily Chart.
The Daily Chart provides both higher timeframe perspective and short-term price information.
It allows traders to see many important institutional price levels without the excessive speed of intraday price action.
The Daily Chart may show:
- Institutional order flow
- Previous highs and lows
- Buy-side liquidity
- Sell-side liquidity
- Fair Value Gaps
- Liquidity voids
- Order blocks
- Short-term highs and lows
- Daily directional bias
According to ICT, the Daily Chart can act as a bellwether for price direction.
A trader who wants to become a day trader should still learn how to study the Daily Chart.
The intraday entry may occur on the 15-minute, 5-minute, or lower timeframe, but the underlying directional idea can originate from Daily price action.
This is why blindly studying only lower timeframe candles can create confusion.
The trader may see a bullish move on the 5-minute chart while the larger price objective remains bearish.
Without higher timeframe context, the trader may misunderstand the actual purpose of the lower timeframe move.
4-Hour and Lower Timeframes for Day Trading
The 4-hour chart and lower timeframes are mainly associated with day trading.
These timeframes provide more frequent opportunities, but they also require more active monitoring.
Day trading is not suitable for every trader.
A trader may have:
- A full-time job
- A business
- College or university classes
- Family responsibilities
- Limited chart time
In such situations, forcing a day trading model may create unnecessary psychological pressure.
ICT day trading setups are also closely connected with time of day.
In the ICT framework, a day trader normally looks for intraday price swings and generally closes the trade by 14:00 New York time.
The important point is not that day trading is better than swing trading.
It simply provides faster capital turnover and more frequent trading opportunities.
Your Trading Model Must Match Your Psychology
A major part of ICT Timeframe Selection & Defining Setups is trader psychology.
Two traders can understand exactly the same ICT concept but use completely different timeframes.
One trader may comfortably wait several months for a Monthly or Weekly setup.
Another trader may become impatient after two days.
Neither trader is automatically wrong.
The problem starts when a trader selects a model that conflicts with their natural behaviour.
Timeframe selection should consider:
- Patience level
- Emotional response to volatility
- Available chart time
- Lifestyle
- Trading experience
- Ability to wait for setups
- Preferred trade duration
A trader who becomes emotionally affected by rapid intraday price movement may perform better on the Daily or Weekly Chart.
A trader who wants more frequent price action may naturally prefer short-term or day trading models.
The trading model must fit the trader.
Different Trading Models in ICT
Michael J. Huddleston explains several broad types of trading models.
Trend Trading
A trend trader follows the direction indicated by the Monthly and Weekly Charts.
When both higher timeframes are bearish, the trader mainly looks for short positions.
When both are bullish, the trader looks for buying opportunities.
These trades may be held for a long period.
Swing Trading
Swing traders mainly study Daily intermediate-term price action.
The setup frequency is lower, but the potential price movement can be large.
The trader must wait patiently for the correct formation.
Contrarian Trading
Contrarian trading focuses on reversal patterns near market extremes.
For example, price may move aggressively higher for a prolonged period and reach a significant higher timeframe level.
A reversal setup may form around this extreme.
The trader is not simply selling because the market has moved higher.
There must be a logical price level and a defined reversal setup.
A contrarian move may also be a short-term reaction instead of a complete market top or bottom.
Short-Term Trading
ICT short-term trading focuses mainly on Weekly ranges.
Trades are generally held for approximately one to five days.
This model provides more opportunities than long-term swing or position trading.
Day Trading
Day traders focus on intraday price swings.
The trader normally enters and exits within the same trading day.
ICT intraday models also require a deeper understanding of session timing and time-based price delivery.
How ICT Uses Higher Timeframes to Define Setups
A setup should not be selected randomly on a lower timeframe.
ICT begins with a larger price framework.
Suppose the Monthly Chart indicates that price may move lower.
A Monthly bearish order block has been reached.
Below current price, large equal lows are present.
The equal lows may contain sell stops and represent a logical liquidity objective.
The trader can now define a price range between:
Known High → Higher timeframe bearish reference point
and
Known Low → Expected liquidity objective
The Monthly Chart defines the overall range.
The Weekly Chart refines the intermediate-term structure.
The Daily Chart provides more detailed setup formations.
This is the process of moving from a broad price idea into a defined trading opportunity.
Grading the Expected Price Range
Once a higher timeframe range is identified, ICT traders can study different areas inside that range.
Price may react around:
- Range quarters
- Equilibrium
- Previous institutional reference points
- Liquidity voids
- Order blocks
For example, price may initially move 25% into the expected range and create a new setup.
Later, price may return toward equilibrium and continue lower.
Another retracement may fill a liquidity void before price continues toward the final objective.
The trader already has a higher timeframe expectation.
Therefore, lower timeframe retracements can be studied as potential opportunities to join the larger price move.
This is much different from randomly buying or selling every retracement.
The Three Main Setups Used by ICT
Michael J. Huddleston explains that his trading can technically be reduced to three primary price action setups.
1. Trading Inside a Known Range or Liquidity Void
Price may expand aggressively and create an exposed range or liquidity void.
Later, price returns into that range.
When the higher timeframe expectation remains valid, the trader can anticipate price filling the range and expanding again.
In a bullish scenario:
Price expands higher.
A liquidity void is created.
Price retraces into the exposed range.
The trader looks for a buying opportunity.
The expectation is for price to expand and potentially make a new high.
2. Order Block Setup
The trader may use a bullish or bearish order block that aligns with higher timeframe price direction.
Suppose the Monthly Chart is bearish.
Price retraces into a Daily bearish order block.
The trader may look for a short setup from that institutional reference point.
The order block is not traded simply because a candle formation appears on the chart.
The higher timeframe price objective gives the order block context.
3. Stop Run or Turtle Soup Setup
ICT Turtle Soup is a false breakout or liquidity run beyond a previous high or low.
Suppose the higher timeframe expectation is bearish.
A short-term high forms on the Daily Chart.
Buy stops may rest above the high.
Price trades slightly above the previous high, takes the buy-side liquidity, and then quickly accelerates lower.
This creates a potential bearish Turtle Soup setup.
The higher timeframe bearish direction explains why the stop run may become important.
Without higher timeframe context, every break above a previous high may appear to be a reversal setup.
That is not how ICT uses stop runs.
The liquidity run must make sense within the larger price narrative.
Choose One Setup You Can See Clearly
A trader does not need to master every ICT concept before developing a trading model.
Some traders naturally understand order blocks.
Another trader may struggle with order blocks but clearly identify Turtle Soup setups.
Another trader may prefer liquidity void retracements.
Michael J. Huddleston gives one of the most important lessons for traders:
“You only need one good pattern.”
The goal is to identify a price formation that you can objectively recognize.
Then study that setup repeatedly.
A trader should not abandon their model simply because another trader posts successful order block trades or uses a different ICT concept.
Your setup should be the formation you can see, understand, and execute consistently.
How to Define Your ICT Trading Setup
A simple process can be followed when defining an ICT trading model.
First, determine the higher timeframe price expectation.
Study the Monthly, Weekly, or Daily Chart and identify the likely direction of price.
Second, identify the price objective.
Ask where liquidity is resting.
This may be above old highs or below old lows.
Third, define the price range.
Use the known higher timeframe reference point and expected liquidity objective.
Fourth, select your setup pattern.
It may be:
- Turtle Soup
- Order Block
- Liquidity Void retracement
Fifth, wait for the setup to form in a logical location.
The pattern should align with the higher timeframe price expectation.
Finally, maintain the bias until price clearly invalidates the analysis or reaches the expected terminus of the move.
This creates an objective trading framework.
Higher Timeframe Direction and Lower Timeframe Setup
The most important principle behind ICT Timeframe Selection & Defining Setups is the relationship between direction and execution.
The Monthly Chart may show long-term bearish price delivery.
The Weekly Chart may identify an intermediate-term bearish order block.
The Daily Chart may run above a short-term high and take buy-side liquidity.
A lower timeframe chart may then provide the actual entry.
The setup becomes more meaningful because every timeframe is providing a part of the same price narrative.
The trader is not randomly searching for a candle pattern.
They already understand:
Where price may go.
What liquidity price may target.
Which direction they want to trade.
What setup they are waiting for.
This is how timeframe selection helps define a trading model.
Final Thoughts
ICT Timeframe Selection & Defining Setups teaches traders that there is no single perfect timeframe for everyone.
The Monthly Chart provides the long-term price action reference.
The Weekly Chart refines intermediate-term price action.
The Daily Chart provides directional bias and short-term setup information.
The 4-hour and lower timeframes provide intraday opportunities.
But selecting a timeframe is only one part of the process.
The trader must also define a repeatable setup that fits their psychology, patience, lifestyle, and ability to monitor the market.
ICT traders can focus on a liquidity void retracement, an order block, or a Turtle Soup stop run. You do not need hundreds of trading patterns.
Find the setup you can identify clearly.
Understand the higher timeframe price objective.
Wait for your pattern.
Then execute the same trading model repeatedly.
That is the real purpose of ICT Timeframe Selection & Defining Setups.