How To Use Intermarket Analysis is a higher timeframe concept taught by Michael J. Huddleston, founder of the ICT (Inner Circle Trader) concepts. This concept is taught in the ICT Mentorship Core Content – Month 5 and explains how traders can study relationships between different asset classes to understand the broader market direction.
World financial markets are connected. Bonds, interest rates, commodities, stocks, and currencies influence one another over time.
ICT uses these relationships to build a long-term directional bias without trying to analyze every economic report separately.
As Michael J. Huddleston explains:
“World markets are directly linked to one another.”
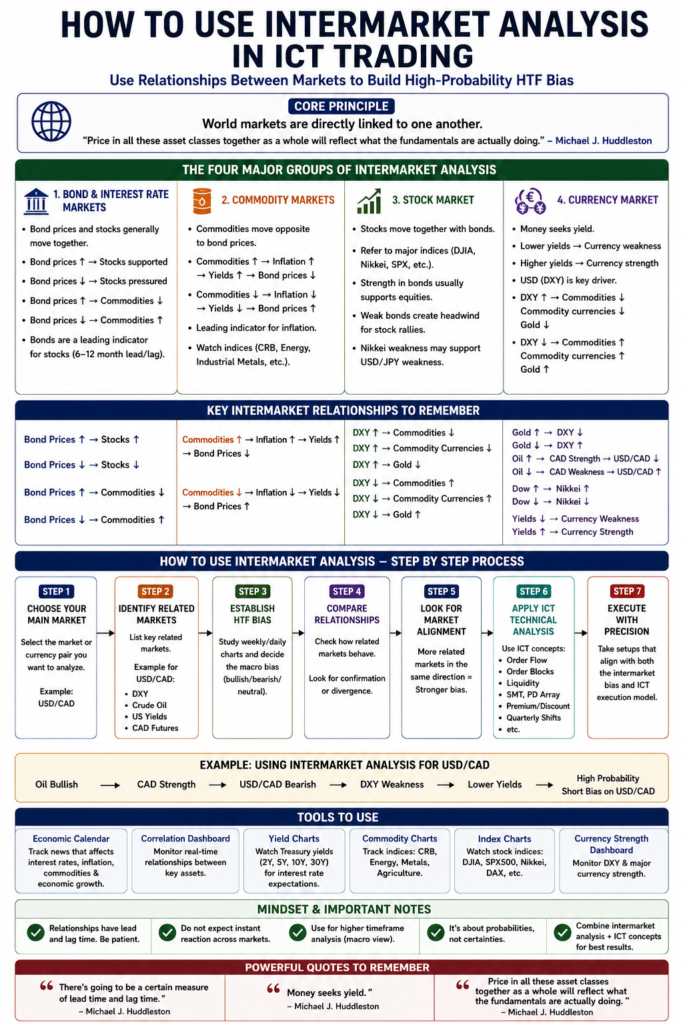
The objective of intermarket analysis is to study how major market groups behave together and determine whether they support the same higher timeframe idea.
What Is Intermarket Analysis?
Intermarket analysis is the study of relationships between different financial markets.
Instead of studying EUR/USD, gold, stocks, or bonds in isolation, the trader compares related markets.
For example:
US Dollar vs Commodities
Bonds vs Commodities
Bonds vs Stocks
Gold vs Dollar Index
Oil vs Canadian Dollar
Dow Jones vs Nikkei
Yields vs Currencies
The trader looks for confirmation across these markets.
If several related markets support the same higher timeframe direction, the trade idea may have a stronger macro foundation.
Four Major Groups of Intermarket Analysis
ICT focuses on four major market groups:
Bond and Interest Rate Markets
Commodity Markets
Stock Market
Currency Market
These four groups are closely related.
However, they do not always move together tick for tick.
A move in the bond market does not mean stocks or commodities must immediately react on the same day.
There can be a lead and lag period.
This is especially important when studying long-term trends.
Understanding Lead and Lag Time
Intermarket relationships are not always immediate.
One market may begin changing direction before another related market responds.
This is known as lead and lag time.
For some long-term relationships, the delay can be several months.
Michael J. Huddleston explains:
“There’s going to be a certain measure of lead time and lag time.”
This means traders should not expect instant confirmation.
For example, commodities may begin trending higher while bonds continue higher for some time.
Eventually, the bond market may begin declining and reflect the expected inverse relationship.
Intermarket analysis is therefore more useful for higher timeframe and macro analysis than exact short-term timing.
Bonds and Stocks Relationship
Bond prices and stocks generally have a positive correlation.
This means they usually move in the same broad direction.
Bond prices higher → Supportive for stocks
Bond prices lower → Bearish pressure on stocks
When Treasury bond prices are trending higher, interest rate yields are generally declining.
Lower interest rates can provide a supportive environment for equities.
The relationship can be simplified as:
Bond prices ↑
Bond yields ↓
Stocks supported
When bond prices decline:
Bond prices ↓
Bond yields ↑
Stocks face pressure
A stock market may still rally while bonds are declining.
However, ICT explains that the weakness in bonds can eventually weigh on the stock market.
Bonds as a Leading Indicator for Stocks
The Treasury bond market can act as a leading indicator for stock market direction.
This relationship may take time to become visible.
According to ICT, changes in long-term bond and stock trends can sometimes have a 6 to 12-month lead or lag period.
Therefore, the trader studies the broad trend.
If bond prices have been consistently declining, a stock trader should be careful about assuming that a stock market rally will continue indefinitely.
The bond market may be warning of higher interest rates and future pressure on equities.
Bonds and Commodities Relationship
Bonds and commodities generally have an inverse relationship.
This means they normally move in opposite directions.
Bond prices higher → Commodities lower
Bond prices lower → Commodities higher
The relationship is closely connected to inflation and interest rates.
Commodities can provide early indications of inflationary pressure.
When commodity prices begin rising, inflation concerns may increase.
Interest rates or bond yields may eventually increase.
Because bond prices and yields move inversely, higher yields are generally associated with lower bond prices.
The basic relationship becomes:
Commodities ↑ → Inflation pressure ↑ → Yields ↑ → Bond prices ↓
The reverse condition may also occur:
Commodities ↓ → Inflation pressure ↓ → Yields ↓ → Bond prices ↑
Commodities as an Inflation Indicator
ICT views commodities as an important market group for studying inflationary conditions.
Rising commodity prices can indicate increasing costs for raw materials, agricultural products, and energy.
This can eventually influence interest rate expectations.
The relationship may take months to fully develop.
Therefore, traders should not expect bonds to immediately reverse when commodities begin moving.
The broader trend is more important.
Using Commodity Indices
ICT discusses different commodity indices for different types of analysis.
The CRB Index can be used to study the broader commodity market.
However, it has significant exposure to agricultural and grain markets.
This includes markets such as:
Soybeans
Wheat
Corn
Cattle
Hogs
For energy-focused analysis, ICT refers to commodity indices that have greater exposure to the energy sector.
Industrial metal indices can also provide information about global economic trends.
Industrial metals include:
Copper
Aluminum
Zinc
Tin
These markets can reflect changes in global production and economic activity.
US Dollar and Commodities Relationship
The US Dollar Index and commodities generally have an inverse relationship.
Dollar Index higher → Commodities lower
Dollar Index lower → Commodities higher
When the US Dollar strengthens, commodities priced in Dollars may face bearish pressure.
When the Dollar weakens, commodities can become more supportive of bullish price movement.
The basic relationship is:
DXY ↑ → Commodities ↓
DXY ↓ → Commodities ↑
ICT traders can compare the Dollar Index with a broad commodity index to study this relationship.
US Dollar and Agricultural Exports
Agricultural markets can be particularly sensitive to Dollar strength.
A stronger US Dollar can reduce foreign demand for US exports because those products become relatively more expensive for overseas buyers.
This may affect grain and agricultural markets.
Strong Dollar → Export demand may decline
Weak Dollar → Export demand may increase
Therefore, ICT traders studying agricultural commodities should also monitor the Dollar Index.
The currency market can provide important context for commodity price direction.
Dollar Index and Commodity Currencies
Commodity currencies are currencies connected to economies with significant exposure to commodity exports.
The Dollar Index can show an inverse relationship with these currencies.
DXY higher → Commodity currencies may weaken
DXY lower → Commodity currencies may strengthen
For example, the Australian Dollar, New Zealand Dollar, and Canadian Dollar can be influenced by important commodity markets.
However, traders should also study the specific commodity relationship of each country.
Gold and the US Dollar Index
One of the important intermarket relationships used in ICT analysis is gold versus the Dollar Index.
Generally:
Bullish DXY → Bearish gold
Bearish DXY → Bullish gold
The relationship is inverse.
If the trader has a bullish Dollar Index bias, bearish conditions in gold may provide supporting intermarket confirmation.
If gold is showing significant strength while DXY is expected to decline, both markets may support the same macro idea.
The trader is looking for alignment between related markets.
Gold and AUD/NZD
ICT also connects gold with the Australian and New Zealand currencies because of their commodity-export relationships.
When gold is bullish, ICT looks for possible strength in:
AUD
NZD
This does not mean AUD/USD or NZD/USD must automatically rally whenever gold moves higher.
The relationship is used as a confirmation tool.
For example:
Gold bullish
DXY bearish
AUD showing strength
If these conditions align with higher timeframe technical analysis, the trader may have stronger confirmation for an Australian Dollar trade idea.
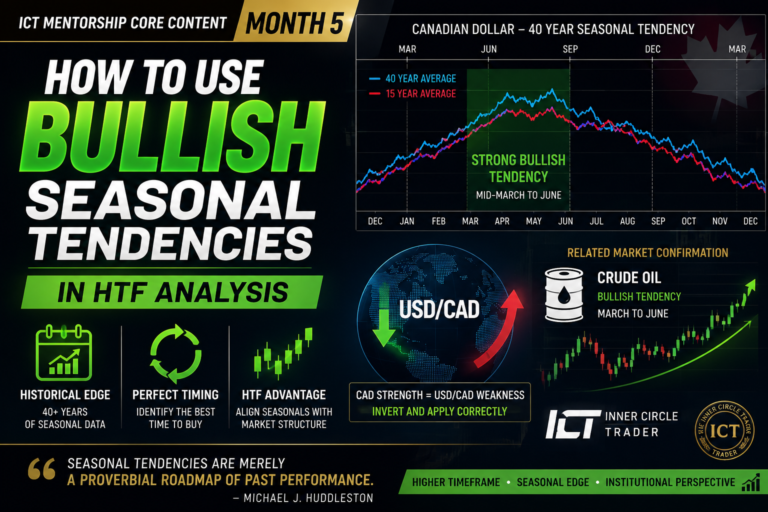
Oil and the Canadian Dollar
Canada has an important relationship with the energy market.
Therefore, crude oil can influence the Canadian Dollar.
ICT uses the following general relationship:
Oil bullish → Canadian Dollar strength
Oil bearish → Canadian Dollar weakness
Because USD/CAD places the US Dollar against the Canadian Dollar, the relationship is usually expressed as:
Oil bullish → USD/CAD bearish
Oil bearish → USD/CAD bullish
This is one of the most useful Forex intermarket relationships.
For example, if a trader expects USD/CAD to decline, bullish conditions in crude oil can support that idea.
Dow Jones and Nikkei Relationship
ICT also discusses the relationship between the Dow Jones and Nikkei Index.
The two equity indices can show a positive relationship.
Dow bullish → Nikkei bullish
Dow bearish → Nikkei weakness
The Nikkei can also provide information related to the Japanese Yen.
ICT explains that weakness in the Nikkei may support bearish conditions for USD/JPY.
These relationships can help traders connect equity markets with currency analysis.
Yields and Currency Direction
Interest rate yields are extremely important in currency analysis.
Money generally seeks yield.
Michael J. Huddleston states:
“Money seeks yield.”
When yields decline, a currency may lose some of its attractiveness to large capital flows.
Yield bearish → Currency weakness may develop
Yield bullish → Currency strength may be supported
This relationship should be combined with interest rate differentials and other ICT concepts.
The trader is not simply buying a currency because yields increased.
The objective is to determine whether yields support the broader macro direction.
Key Intermarket Relationships to Remember
Some important ICT intermarket relationships include:
DXY bullish → Gold bearish
Gold bullish → AUD and NZD may strengthen
Oil bullish → USD/CAD bearish
Oil bearish → USD/CAD bullish
Bond prices bullish → Stocks supported
Bond prices bearish → Stocks pressured
Bond prices bullish → Commodities pressured
Bond prices bearish → Commodities supported
DXY bullish → Commodities pressured
DXY bearish → Commodities supported
Yields declining → Currency may weaken
These relationships provide a framework for long-term analysis.
They are not automatic trade signals.
How To Use Intermarket Analysis in ICT
A simple process can be followed:
Step 1: Determine Your Main Market
Start with the market or currency pair you want to analyze.
For example, USD/CAD.
Step 2: Identify Related Markets
For USD/CAD, important related markets may include:
DXY
Crude oil
US yields
Canadian Dollar futures
Step 3: Establish the Higher Timeframe Bias
Study weekly and daily price action.
Determine whether the market is generally bullish or bearish.
Step 4: Compare Intermarket Relationships
If USD/CAD is expected to decline, look for supporting conditions.
Oil bullish
Canadian Dollar strength
Possible DXY weakness
Step 5: Look for Market Alignment
The more related markets supporting the same direction, the stronger the macro premise may become.
Step 6: Apply ICT Technical Analysis
Use concepts such as:
Institutional order flow
Order blocks
Liquidity
Premium and discount
Seasonal tendencies
Quarterly shifts
Step 7: Use the Macro Bias as a Trade Filter
Take lower timeframe setups that align with the higher timeframe intermarket premise.
Intermarket Analysis Does Not Predict Exact Timing
One of the biggest limitations of intermarket analysis is timing.
The trader may correctly identify the long-term direction but still enter too early.
Higher timeframe markets can move significantly against an entry before the broader trend begins.
This is why intermarket analysis should not replace execution models.
It provides directional context.
ICT technical concepts can then be used to refine entries.
The macro analysis tells the trader which direction may have stronger underlying support.
The execution model determines when to enter.
Can Day Traders Use Intermarket Analysis?
Yes.
Intermarket analysis is primarily a higher timeframe tool, but day traders can use it to establish directional bias.
For example, assume:
DXY is bearish
Gold is bullish
AUD is showing relative strength
Higher timeframe AUD/USD order flow is bullish
The trader may focus primarily on bullish AUD/USD intraday setups.
The intermarket relationships help reduce random trading.
Instead of trying to predict every small movement, the trader aligns lower timeframe execution with the larger market condition.
Why Intermarket Analysis Is Important in ICT
Intermarket analysis allows traders to study what price is communicating across multiple asset classes.
Large institutions, banks, producers, manufacturers, and exporters use economic information to make long-term decisions.
Their activity eventually appears in financial market prices.
By comparing bonds, commodities, stocks, and currencies, the trader can observe the result of these macro forces.
As Michael J. Huddleston explains:
“Price in all these asset classes together as a whole will reflect what the fundamentals are actually doing.”
This is the main purpose of ICT intermarket analysis.
The trader is studying the relationships between markets rather than trying to process every economic data release individually.
Final Thoughts
How To Use Intermarket Analysis in ICT trading begins with understanding that financial markets are connected.
The four major groups are the bond and interest rate markets, commodity markets, stock market, and currency market.
Bonds can provide information about stocks and interest rates. Commodities can provide information about inflation. The Dollar Index can influence commodities and commodity currencies. Gold, oil, equity indices, and yields can also help qualify currency direction.
These relationships do not always react immediately. Lead and lag periods are normal, especially in long-term macro trends.
ICT traders use intermarket analysis to build a higher timeframe directional bias and then combine that bias with technical concepts such as institutional order flow, SMT divergence, liquidity, order blocks, seasonal tendencies, and Quarterly Shifts.
The objective is not to find a guaranteed trade. It is to bring several related markets into alignment and increase the probability that the trader is following the broader institutional market direction.